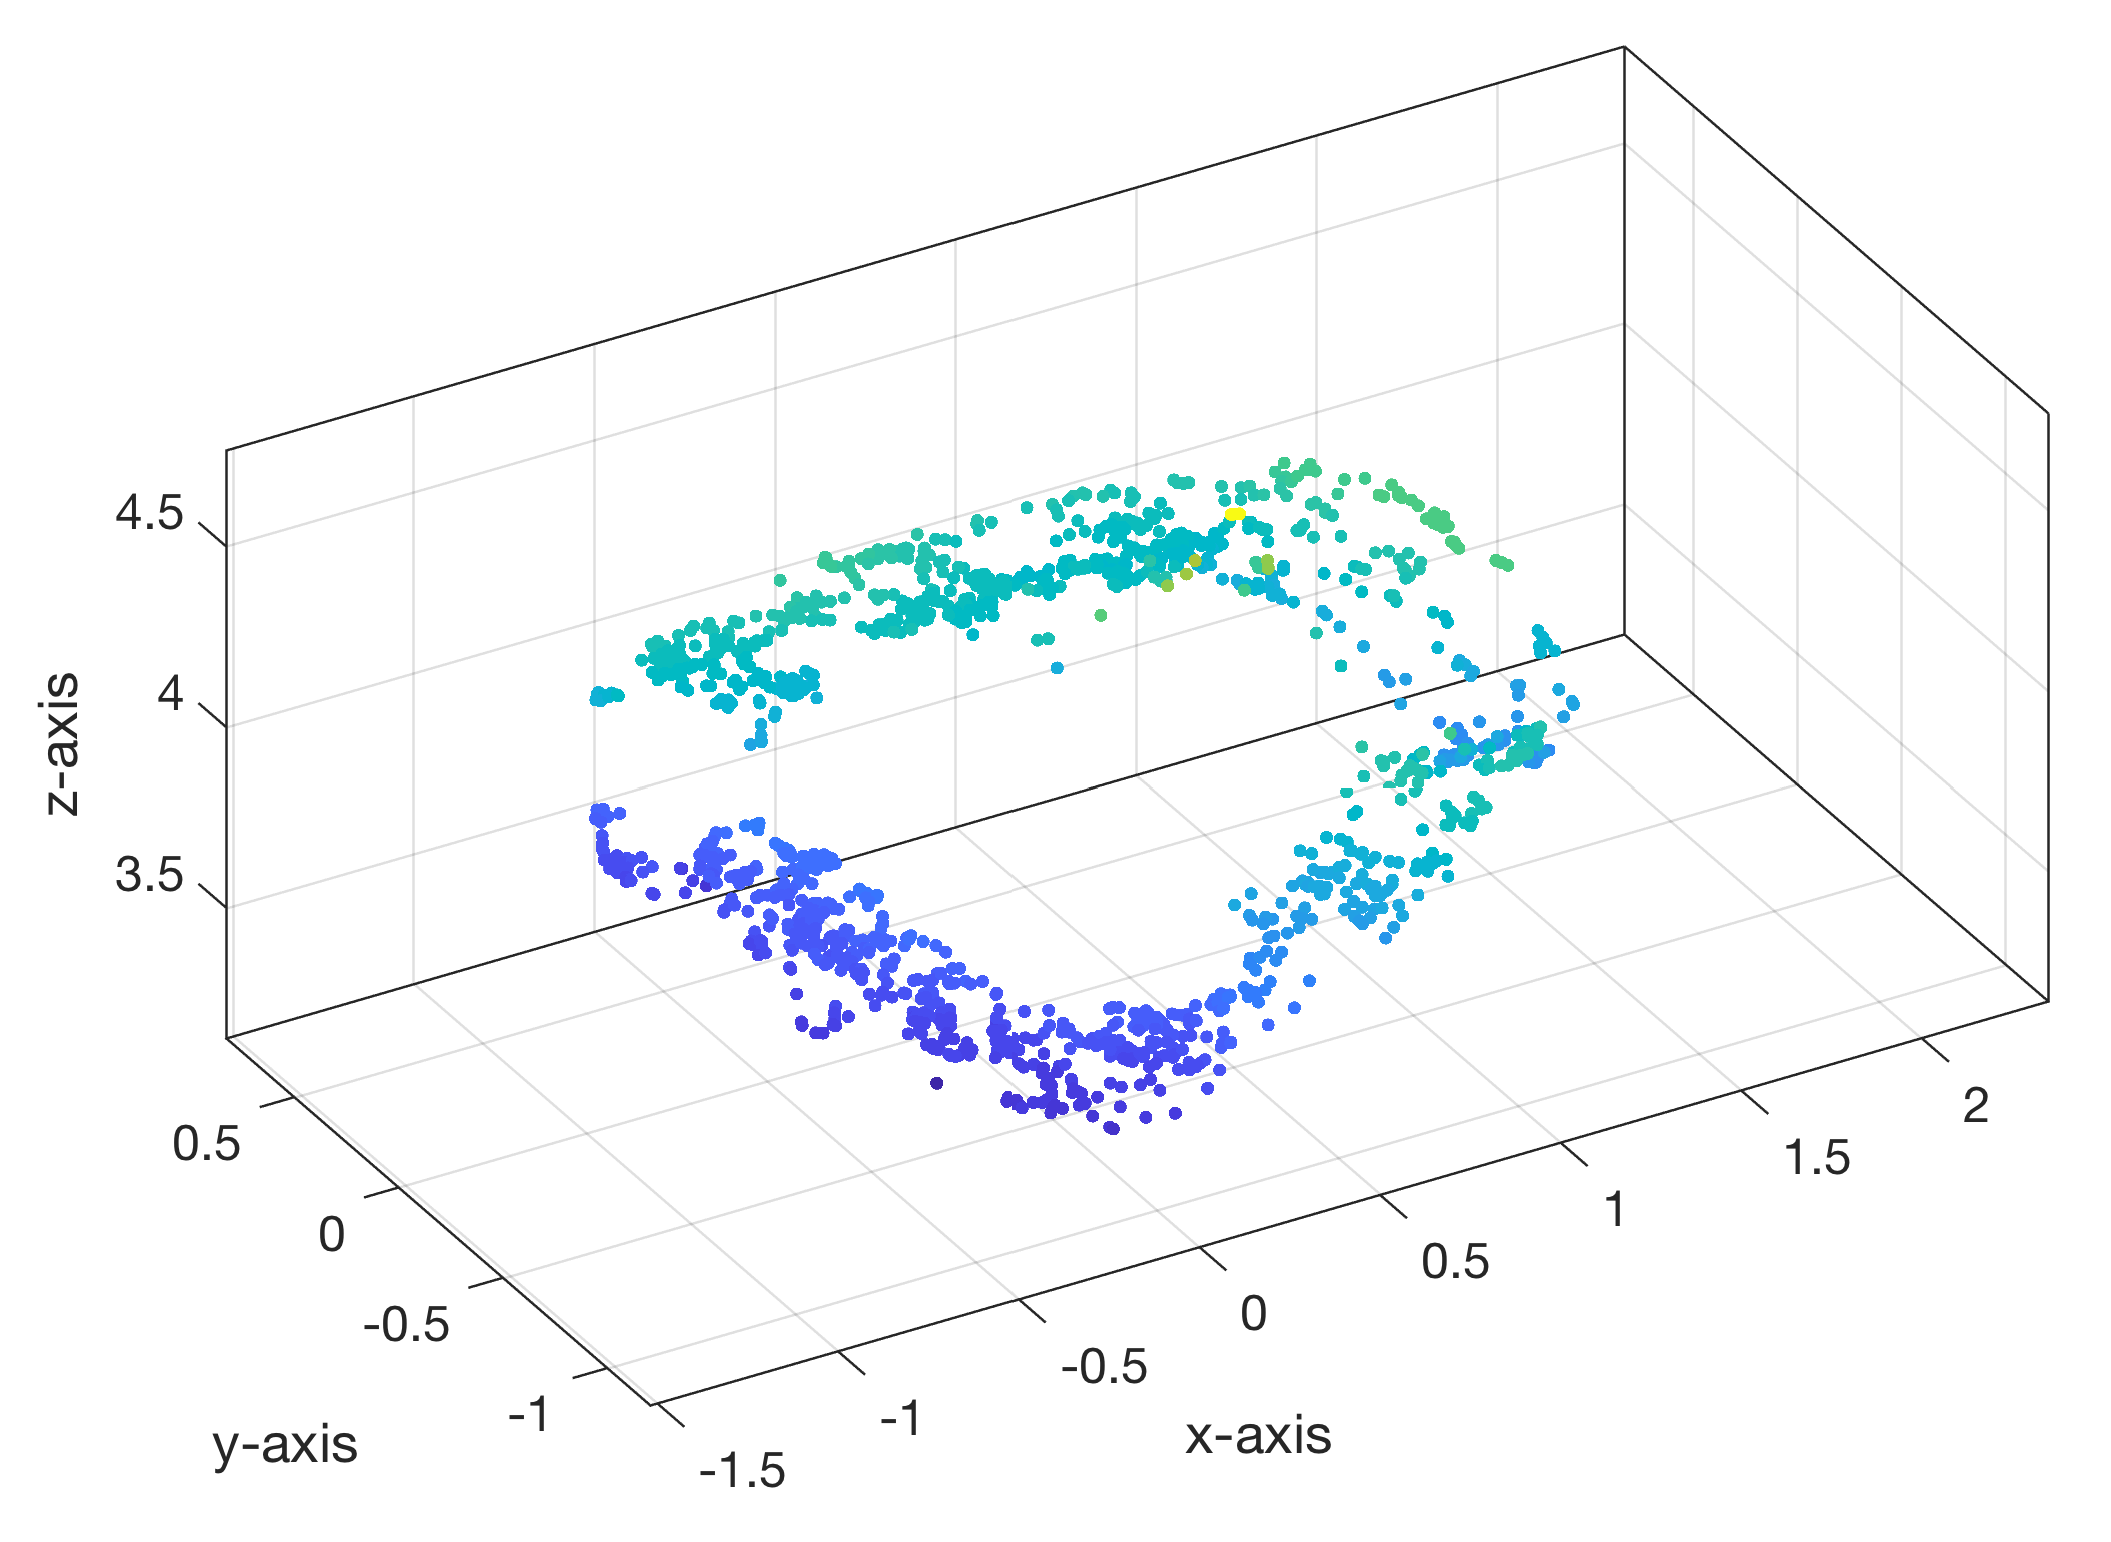
This exercise is intended to help students to understand how to calculate a 3D point cloud from stereo images. Continue reading “MATLAB/LEGO MINDSTORMS Exercise #7 Generating a Point Cloud From Stereo Images”

Martin H. Trauth, University of Potsdam, Germany
This exercise is intended to help students to understand how to calculate a 3D point cloud from stereo images. Continue reading “MATLAB/LEGO MINDSTORMS Exercise #7 Generating a Point Cloud From Stereo Images”
The book “MATLAB Recipes for Earth Sciences” (Springer, 2015) is again ranked 5th (Spring 2017) in the Top 100 out of more than 4,600 books in Earth Sciences, Geography & Environment of Springer. Thanks to all readers for buying the book!
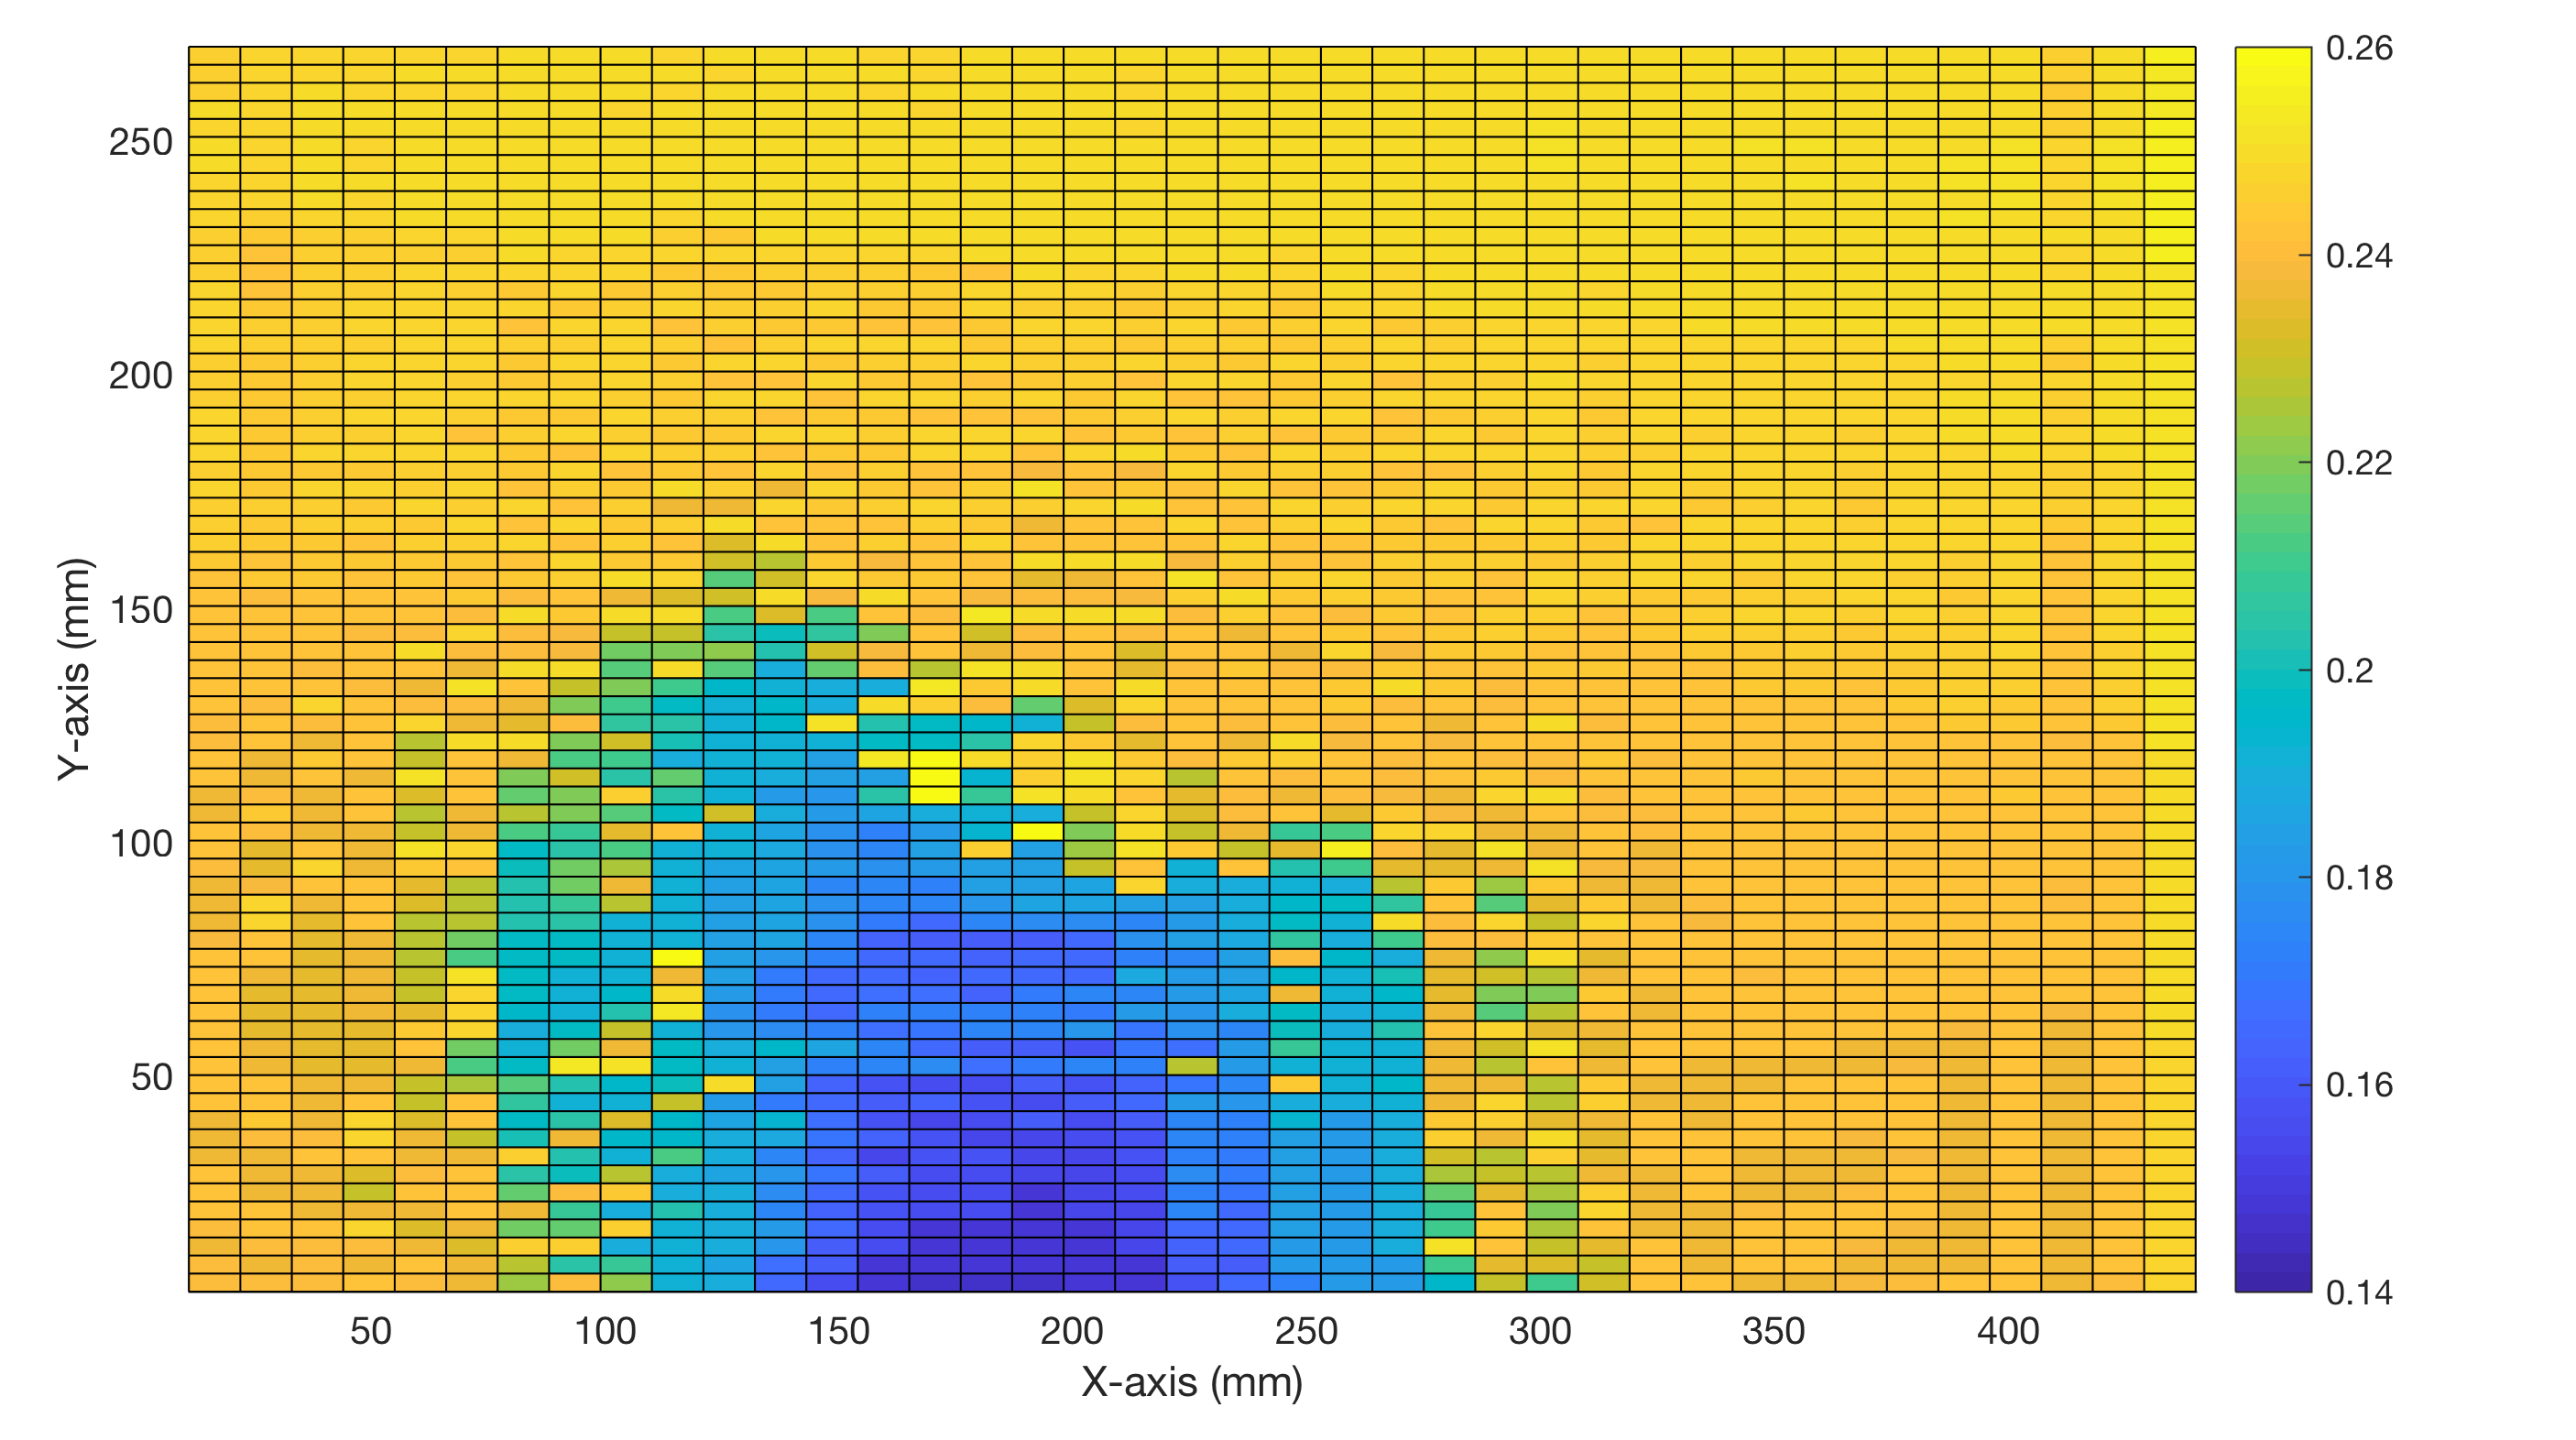
This exercise is intended to help students to understand how to scan the relative distance of a 3D object from an infrared sensor. The quality of the result, possible artefacts and sources of error are discussed in conjunction with the results of a previous exercise on the spatial resolution of the sensor. Continue reading “Object Scanning with MATLAB using the LEGO Infrared Sensor”
This exercise is intended to help students to understand how to scan the relative distance of a 3D object from a infrared sensor. Continue reading “MATLAB/LEGO MINDSTORMS Exercise #6 Object Scanning With the LEGO Infrared Sensor”
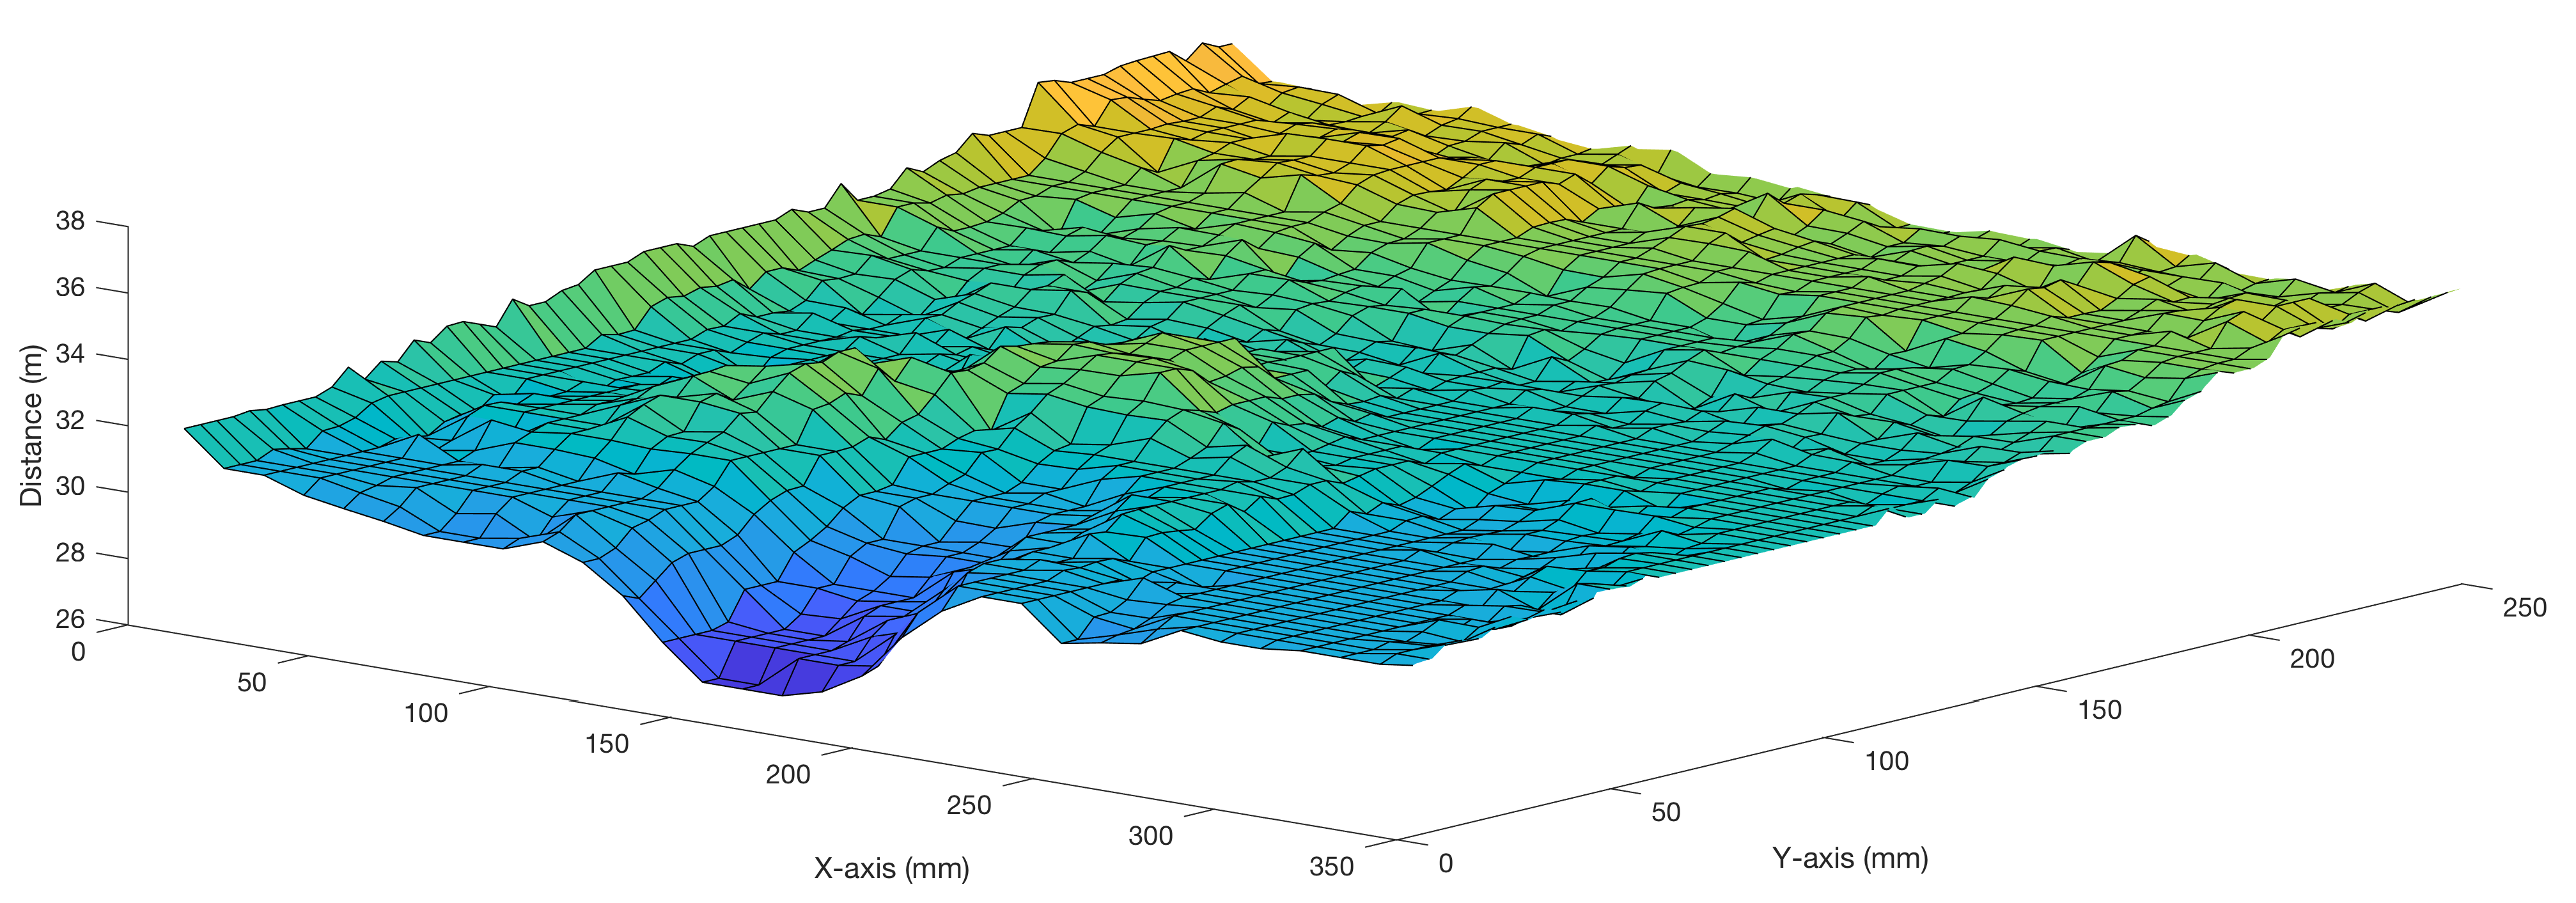
This exercise is intended to help students to understand how to scan the absolute distance (in meters) of a 3D object from a ultrasonic sensor. The quality of the result, possible artefacts and sources of error are discussed in conjunction with the results of a previous exercise on the spatial resolution of the sensor. Continue reading “Object Scanning with MATLAB using the LEGO Ultrasonic Sensor”
This exercise is intended to help students to understand how to scan the absolute distance of a 3D object from a ultrasonic sensor. Continue reading “MATLAB/LEGO MINDSTORMS Exercise #5 Object Scanning With the LEGO Ultrasonic Sensor”
One of the really missing things in MATLAB is a version history of specific functions. As a MATLAB user for 25 years, I have a lot of MATLAB code that contains functions that have been modified, exchanged, or completely disappeared. I am mainly concerned with functions from the Signal Processing Toolbox, but this can also be due to the fact that I use this toolbox the longest. Continue reading “Missing Version History of MATLAB Functions [UPDATE: Fixed]”
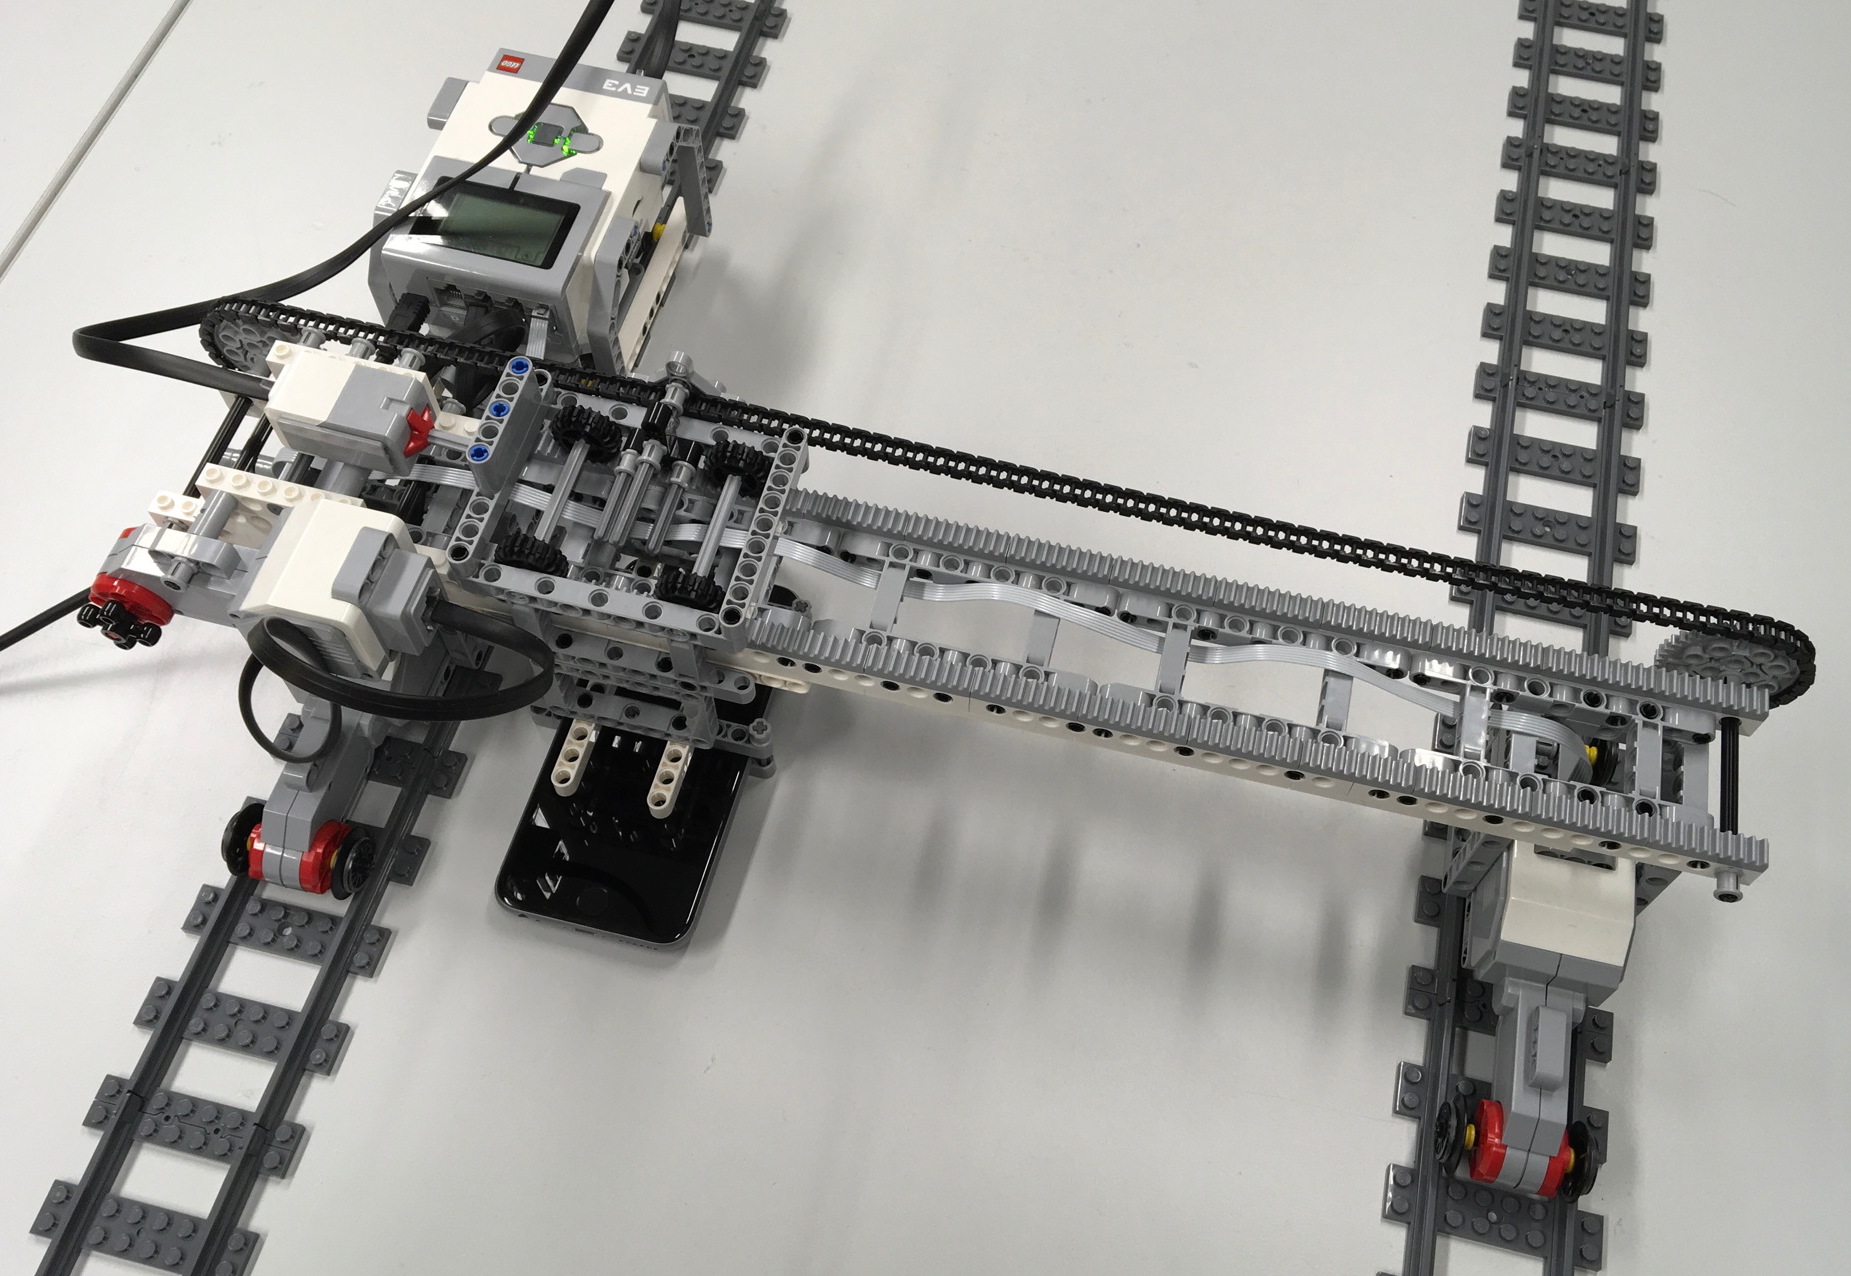
The Apple iPhone/MATLAB Mobile/LEGO MINDSTORMS scanner is an essential tool of our course in acquiring, processing and analyzing typical data earth sciences. Continue reading “The Apple iPhone/MATLAB Mobile/LEGO MINDSTORMS Scanner, Part 1”