
Since the introduction of electronic devices with touch controls, interactive 3D graphics objects have become increasingly popular in multimedia electronic books (ebooks). The Simulink 3D Animation available from The MathWorks, Inc. provides the necessary tools to create and export 3D graphics objects for inclusion in documents such as multimedia ebooks, interactive webpages, and presentations.
The VRML files are text files with the file extension .wrl for world, short for Virtual Reality World. Opening such a file in, for example, the MATLAB editor reveals that it contains vertices and edges for 3D polygons, together with parameters such as surface colors, textures, transparency and so on. The VRML files can be viewed using a browser plugin (of which there are many different types available online), or using 3D software such as the open-source MeshLab software or the free Blender software.
These tools (as well as others) can be used to convert the VRML format into other 3D graphics object file formats such as the Universal 3D .u3d and COLLADA .dae formats. As an example the U3D format is the format required to place a 3D graphics object onto a PDF page with Adobe Acrobat. The DAE format is used to include 3D graphics objects in Apple iBooks Author files, for use with Apple iPads and other iOS devices with touch controls.
Here is the script to create the interactive 3D graphics from the iOS version of MRES to be used with iOS devices (iPads, iPhones) and the Apple iBooks software for computers running macOS. We first load a tile of the GTOPO30 data set E020N40 (from Springer Extras) using the function gtopo30 contained in the Mapping Toolbox. A coordinate system can then be defined using the information that the lower-left corner is E020N40 (20 deg eastern longitude, 40 deg northern latitude).
clear
latlim = [-5 5]; lonlim = [30 40];
GTOPO30 = gtopo30('E020N40',1,latlim,lonlim);
[LON,LAT] = meshgrid(30:1/120:40-1/120,...
     -5:1/120:5-1/120);
The 30 arc second (about 1 km) global digital elevation data set GTOPO30 has been developed by the Earth Resources Observation System Data Center and is available from the U.S. Geological Survey web page. The model uses a variety of international data sources but is mainly based on raster data from the Digital Terrain Elevation Model (DTEM) and vector data from the Digital Chart of the World (DCW).
We also need to reduce the size of the array by a factor of 15 because most VRML clients limit the number of vertices in a VRML file. You can run an experiment with a larger number of vertices and see whether it works with your VRML software.
LON = LON(1:15:end,1:15:end);
LAT = LAT(1:15:end,1:15:end);
GTOPO30 = GTOPO30(1:15:end,1:15:end);
We also eliminate the edges of the data set, as these may cause problems when writing the VRML files.
LON = LON(2:end-1,2:end-1);
LAT = LAT(2:end-1,2:end-1);
GTOPO30 = GTOPO30(2:end-1,2:end-1);
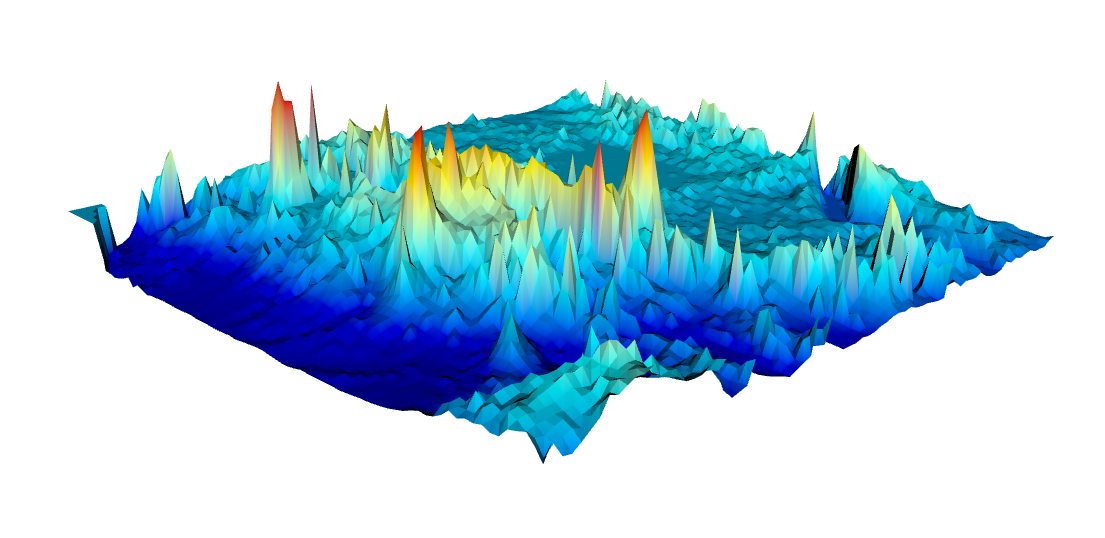
3D graphics can be generated from the elevation data using the function trimesh following Delaunay triangulation of the data set using delaunay.
tri = delaunay(LON,LAT);
trimesh(tri,LON,LAT,GTOPO30)
Next we reshape the array to a n-by-1 array.
[xdim ydim] = size(GTOPO30);
GTOPO30 = GTOPO30(:);
GTOPO30(isnan(GTOPO30)==1) = nanmean(GTOPO30);
We then determine the range of the z-values and define the spacing in x and y directions.
zrange = range(GTOPO30);
xspace = 10;
yspace = 10;
We again use the colormap jet to display the GTOPO30 data set.
cmap = jet(256);
We then normalize the elevation data to the [1,length(cmap)] range.
 cmap = cmap(round((GTOPO30-min(GTOPO30))...
     .*(size(cmap,1)-1)./zrange)+1,:);
The Simulink 3D Animation User’s Guide contains a great introduction in its chapter Interact with Virtual Reality Worlds, which explains the following steps in greater detail than provided here. We first need to make sure that all virtual reality worlds are closed and deleted.
out = vrwho;
    for i=1:length(out)
         while (get(out(i),'opencount')~=0)
    close(out(i));
    end
    delete(out(i));
end
We then create a new virtual reality world myworld using vrworld.
myworld = vrworld('');
open(myworld)
Our world then needs a shape and a grid. We create the shape newShape with the name Landscape and the grid newGrid using vrnode. The function vrnode creates a handle to either an existing or a new node.
shapeName = ['Landscape'];
newShape = vrnode(myworld,shapeName,'Shape');
newGrid = vrnode(newShape,'geometry',...
    'DEM','ElevationGrid');
We can access the contents of the variable newShape from the vrworld class in a similar manner to structure arrays, e.g., by typing
getfield(newShape.geometry)
which lists a number of the de ning parameters of newShape such as, for example, the color. The nodes of the world can be accessed using one of the two commands
nodes(myworld)
mynodes = get(myworld,'Nodes')
We can access the fields of the node Landscape using one of the two commands
fields(myworld.Landscape)
fields(myworld.DEM)
and the DEM using
fields(mynodes(1))
fields(mynodes(2))
both with a detailed output of all the parameter settings of the nodes. We can also list the fields in newShape and newGrid using
fields(newShape)
fields(newGrid)
and modify the values of the various parameters of newShape and newGrid. As an example we can reduce the height values to 20% of the original GTOPO30 values in order to change the proportions of the 3D graphics.
setfield(newGrid, ...
    'xDimension',xdim,...
    'zDimension',ydim,...
    'xSpacing',xspace,...
    'zSpacing',yspace,...
    'height',0.05*GTOPO30);
We then use the colormap cmap based on elevation
GridColor = vrnode(newGrid,...
     'color','TerrainColor',...
     'Color');
GridColor.color = cmap;
getfield(newGrid,'color')
and save the world myworld created with Simulink 3D Animation to a new VRML file ainteractive_7_2.wrl.
save(myworld,'ainteractive_7_2.wrl')
close(myworld)
delete(myworld)
We then close and delete the world myworld. Importing the resulting VRML file into a VRML client such as MeshLab or Blender reveals the terrain model does indeed have colors, as defined by jet. We can use the file in the VRML format to create an interactive document. However, the so ware to create such interactive documents, such as Adobe Acrobat or Apple iBooks Author, may require different file formats; these can easily be converted with the MeshLab or Blender software. Here you can download the result in various formats. There is also an animated PDF file with the 3D graphics included.