The free 1-arc minute Shuttle Radar Topography Mission (SRTM) data are very popular digital terrain models (DEM). Here is a script for merging and visualizing multiple SRTM data sets to larger DEMs with MATLAB.
The Shuttle Radar Topography Mission (SRTM) was a radar system on board the Space Shuttle Endeavour during an 11-day mission in February 2000 (Farr et al. 2000, 2007). SRTM was an international project spearheaded by the National Geospatial-Intelligence Agency (NGA) and the National Aeronautics and Space Administration (NASA). Detailed information on the SRTM project, including a gallery of images and a user’s forum, can be accessed through the NASA SRTM web page.
Chapter 7.5 of the MRES book demonstrates how to import, process and display a single SRTM tile. Neighboring tiles overlap one line or column, which we must delete when merging SRTM data sets. We use the Baringo basin in Kenya as an example, which is covered by two SRTM tiles. We first load the two SRTM data sets as described in the MRES book:
clear, close all, clc
fid = fopen('N00E035.hgt','r');
SRTM1 = fread(fid,[1201,inf],'int16','b');
fclose(fid);
fid = fopen('N00E036.hgt','r');
SRTM2 = fread(fid,[1201,inf],'int16','b');
fclose(fid);
Next we transpose and flip the data sets up and down, before we replace the 16-bit signed integer no-data identifier -32768 by the MATLAB no-data identifier NaN (not-a-number).
SRTM1 = SRTM1'; SRTM1 = flipud(SRTM1);
SRTM2 = SRTM2'; SRTM2 = flipud(SRTM2);
SRTM1(find(SRTM1 == -32768)) = NaN;
SRTM2(find(SRTM2 == -32768)) = NaN;
We elimate the overlapping (identical) column in the first tile SRTM1 and horizontically concatenate it with the second tile SRTM2 using horzcat.
SRTM1(:,1201) = [];
SRTM = horzcat(SRTM1,SRTM2);
clear SRTM1 SRTM2
A popular way to eliminate gaps in digital elevation models is by filling gaps with the arithmetic means of adjacent elements:
for i = 2 : 1200
    for j = 2 : 2400
        if isnan(SRTM(i,j)) == 1
            SRTM(i,j) = nanmean(nanmean(...
            SRTM(i-1:i+1,j-1:j+1)));
        end
    end
end
clear i j
We smooth the data using a running mean. Contrary to a previous post, the side effects of the running means are not important at this point.
B = 1/25 * ones(5,5);
SRTM = filter2(B,SRTM);
Next we define a coordinate grid and contour levels.
[LON,LAT] = meshgrid(35:1/1200:37,0:1/1200:1);
v = [700 800 900 1000 1100 1200 ...
     1300 1500 2000 2500 3000];
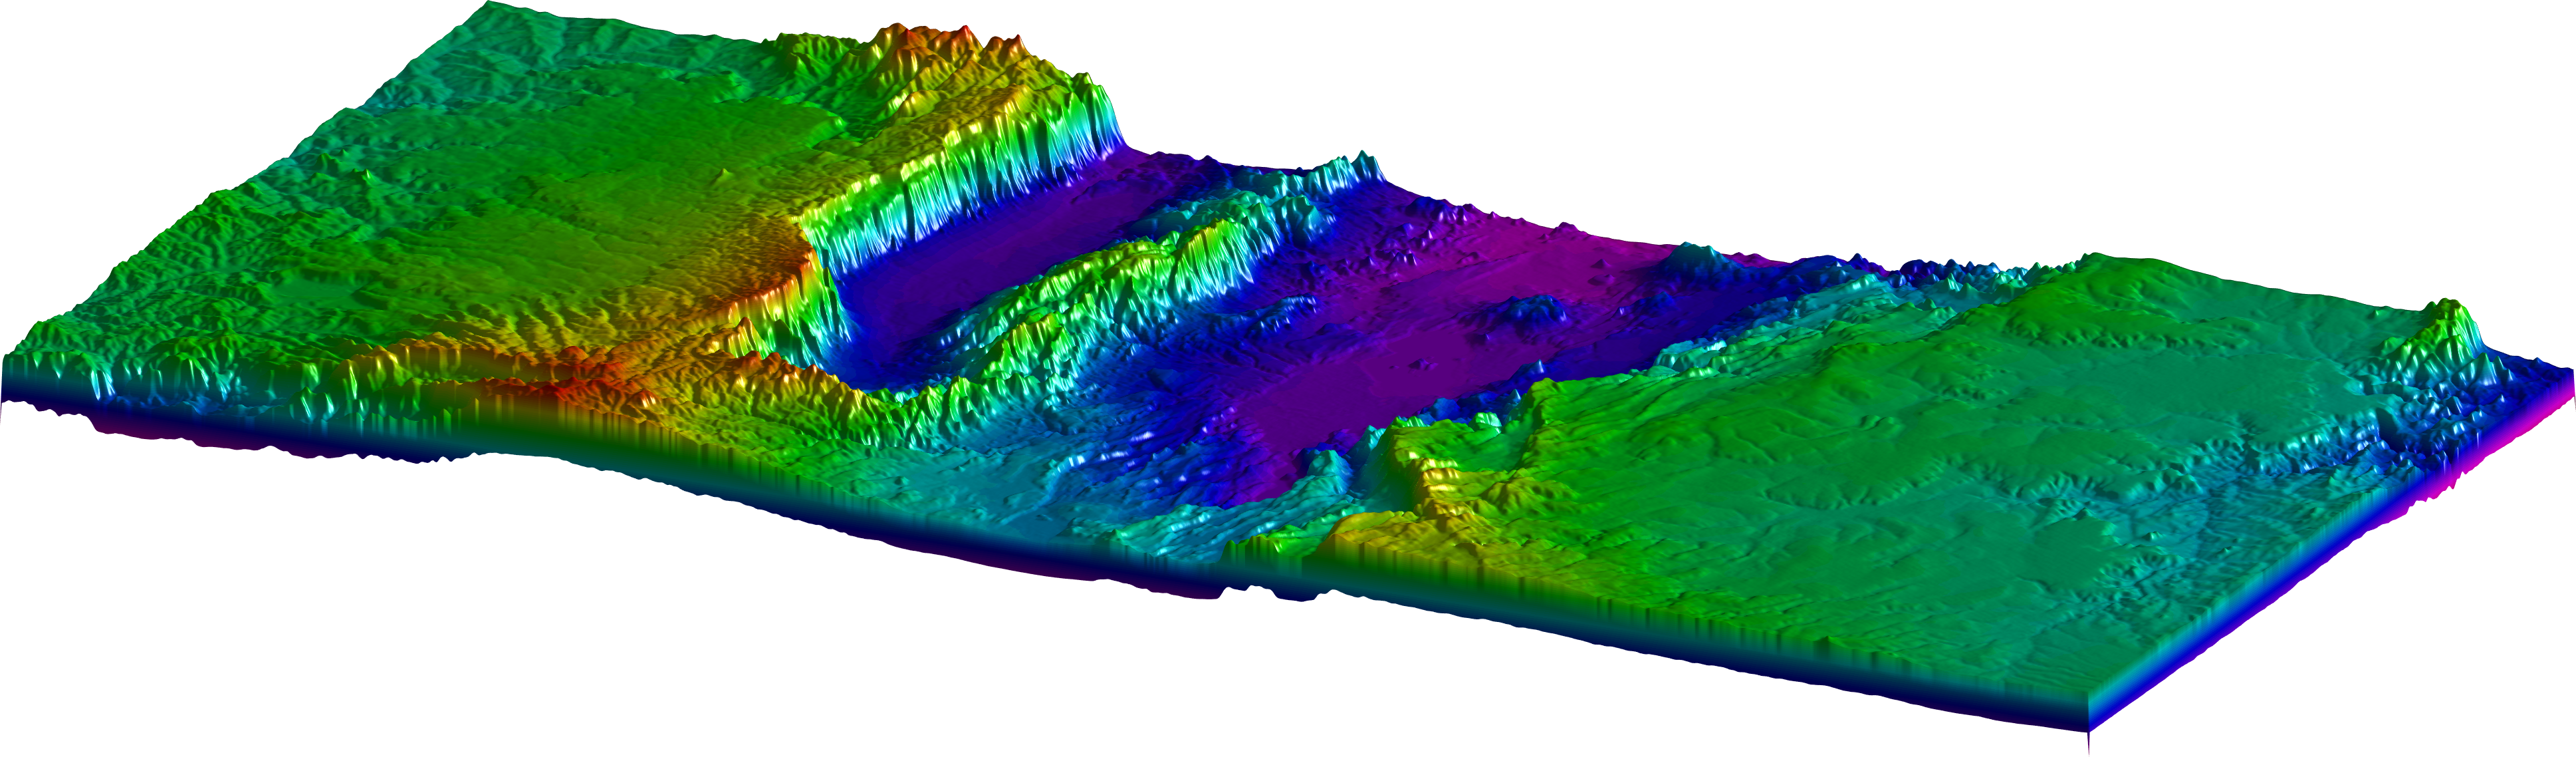
Here is the script of a beautiful display of the data. Please note the use of the function daspect to reduce the length of the z-axis.
figure1 = figure('Color',[1 1 1],...
    'Position',[50 50 1200 600]);
axes1 = axes('Visible','off',...
    'Units','centimeters',...
    'FontSize',8);
hold(axes1,'all');
surf1 = surf(LON,LAT,SRTM,...
    'SpecularExponent',20,...
    'FaceLighting','phong',...
    'FaceColor','interp',...
    'EdgeColor','none');
light1 = light('Parent',axes1,...
    'Style','local',...
    'Position',[145 70 900000]);
set(gca,'View',[25 20])
daspect([1 1 20000])
colormap(flipud(hsv))
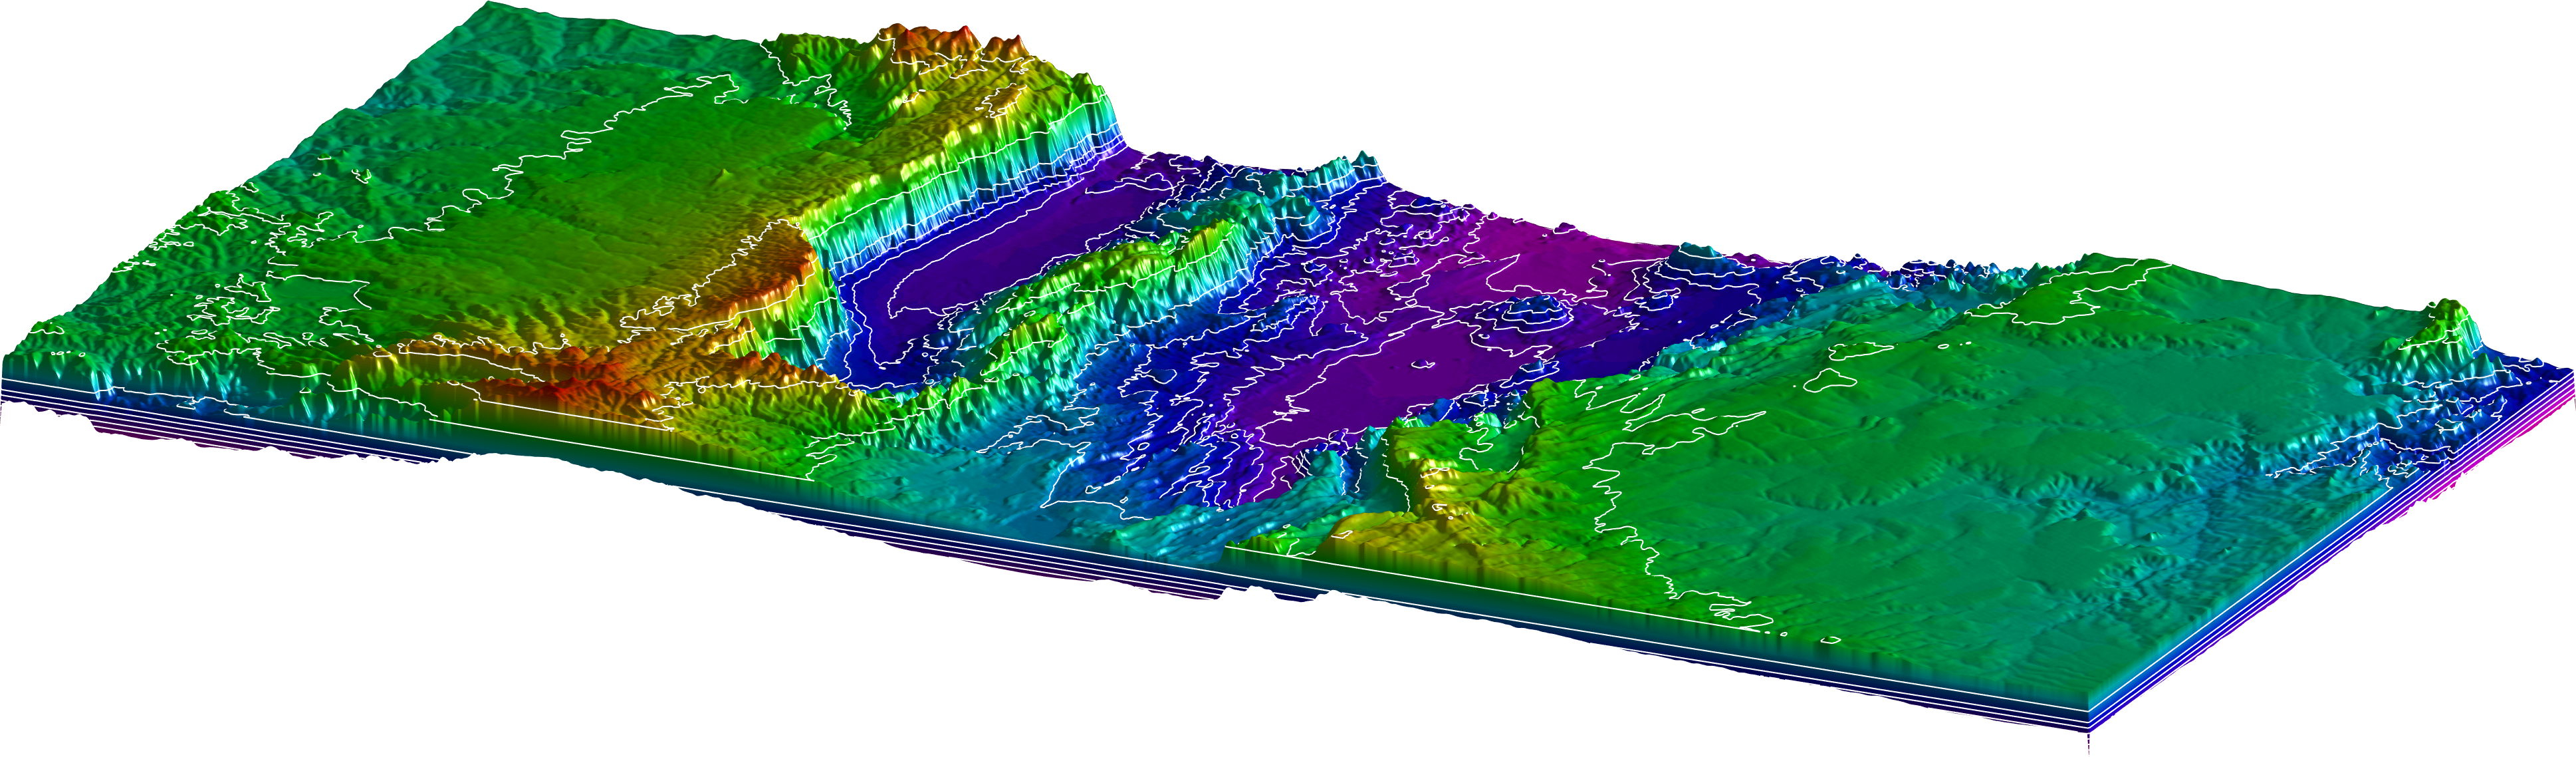
Alternatively we can add white contours.
figure1 = figure('Color',[1 1 1],...
    'Position',[50 50 1200 600]);
axes1 = axes('Visible','off',...
    'Units','centimeters',...
    'FontSize',8);
hold(axes1,'all');
surf1 = surf(LON,LAT,SRTM,...
    'SpecularExponent',20,...
    'FaceLighting','phong',...
    'FaceColor','interp',...
    'EdgeColor','none');
light1 = light('Parent',axes1,...
    'Style','local',...
    'Position',[145 70 900000]);
set(gca,'View',[25 20])
daspect([1 1 20000])
colormap(flipud(hsv))
contour3(LON,LAT,SRTM,v,...
    'Color','w')
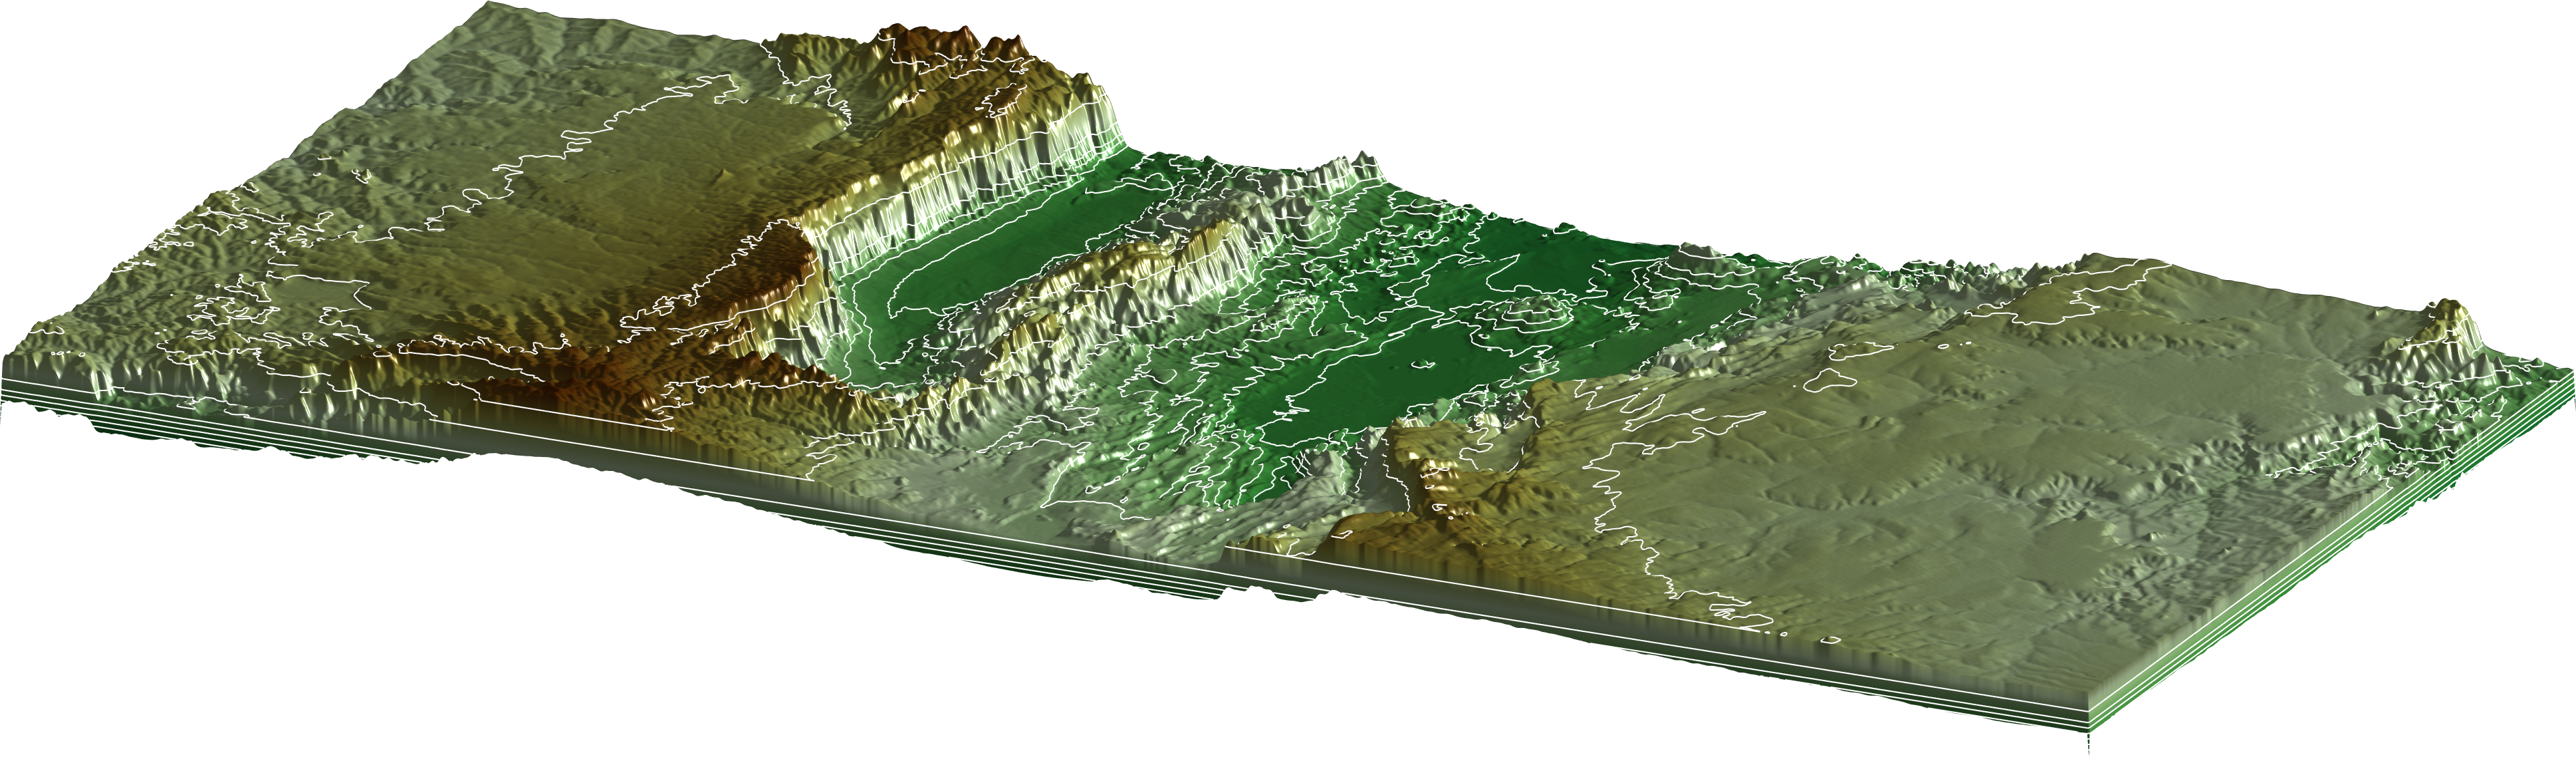
The Mapping Toolbox includes the function demcmap, which creates and assigns a colormap appropriate for elevation data since it relates land and sea colors to hypsometry and bathymetry. Alternatively, the function cptmap available from the MathWorks file exchange provides a large collection of colormaps for DEMs.
figure1 = figure('Color',[1 1 1],...
    'Position',[50 50 1200 600]);
axes1 = axes('Visible','off',...
    'Units','centimeters',...
    'FontSize',8);
hold(axes1,'all');
surf1 = surf(LON,LAT,SRTM,...
    'SpecularExponent',20,...
    'FaceLighting','phong',...
    'FaceColor','interp',...
    'EdgeColor','none');
light1 = light('Parent',axes1,...
    'Style','local',...
    'Position',[145 70 900000]);
set(gca,'View',[25 20])
daspect([1 1 20000])
colormap(flipud(hsv))
contour3(LON,LAT,SRTM,v,...
    'Color','w')
demcmap(SRTM)