
In a time series project, we faced the problem that we needed more than two axes. The function plotyy or the new function yyaxis was not sufficient. I solved that with a simple script that displays any number of axes.
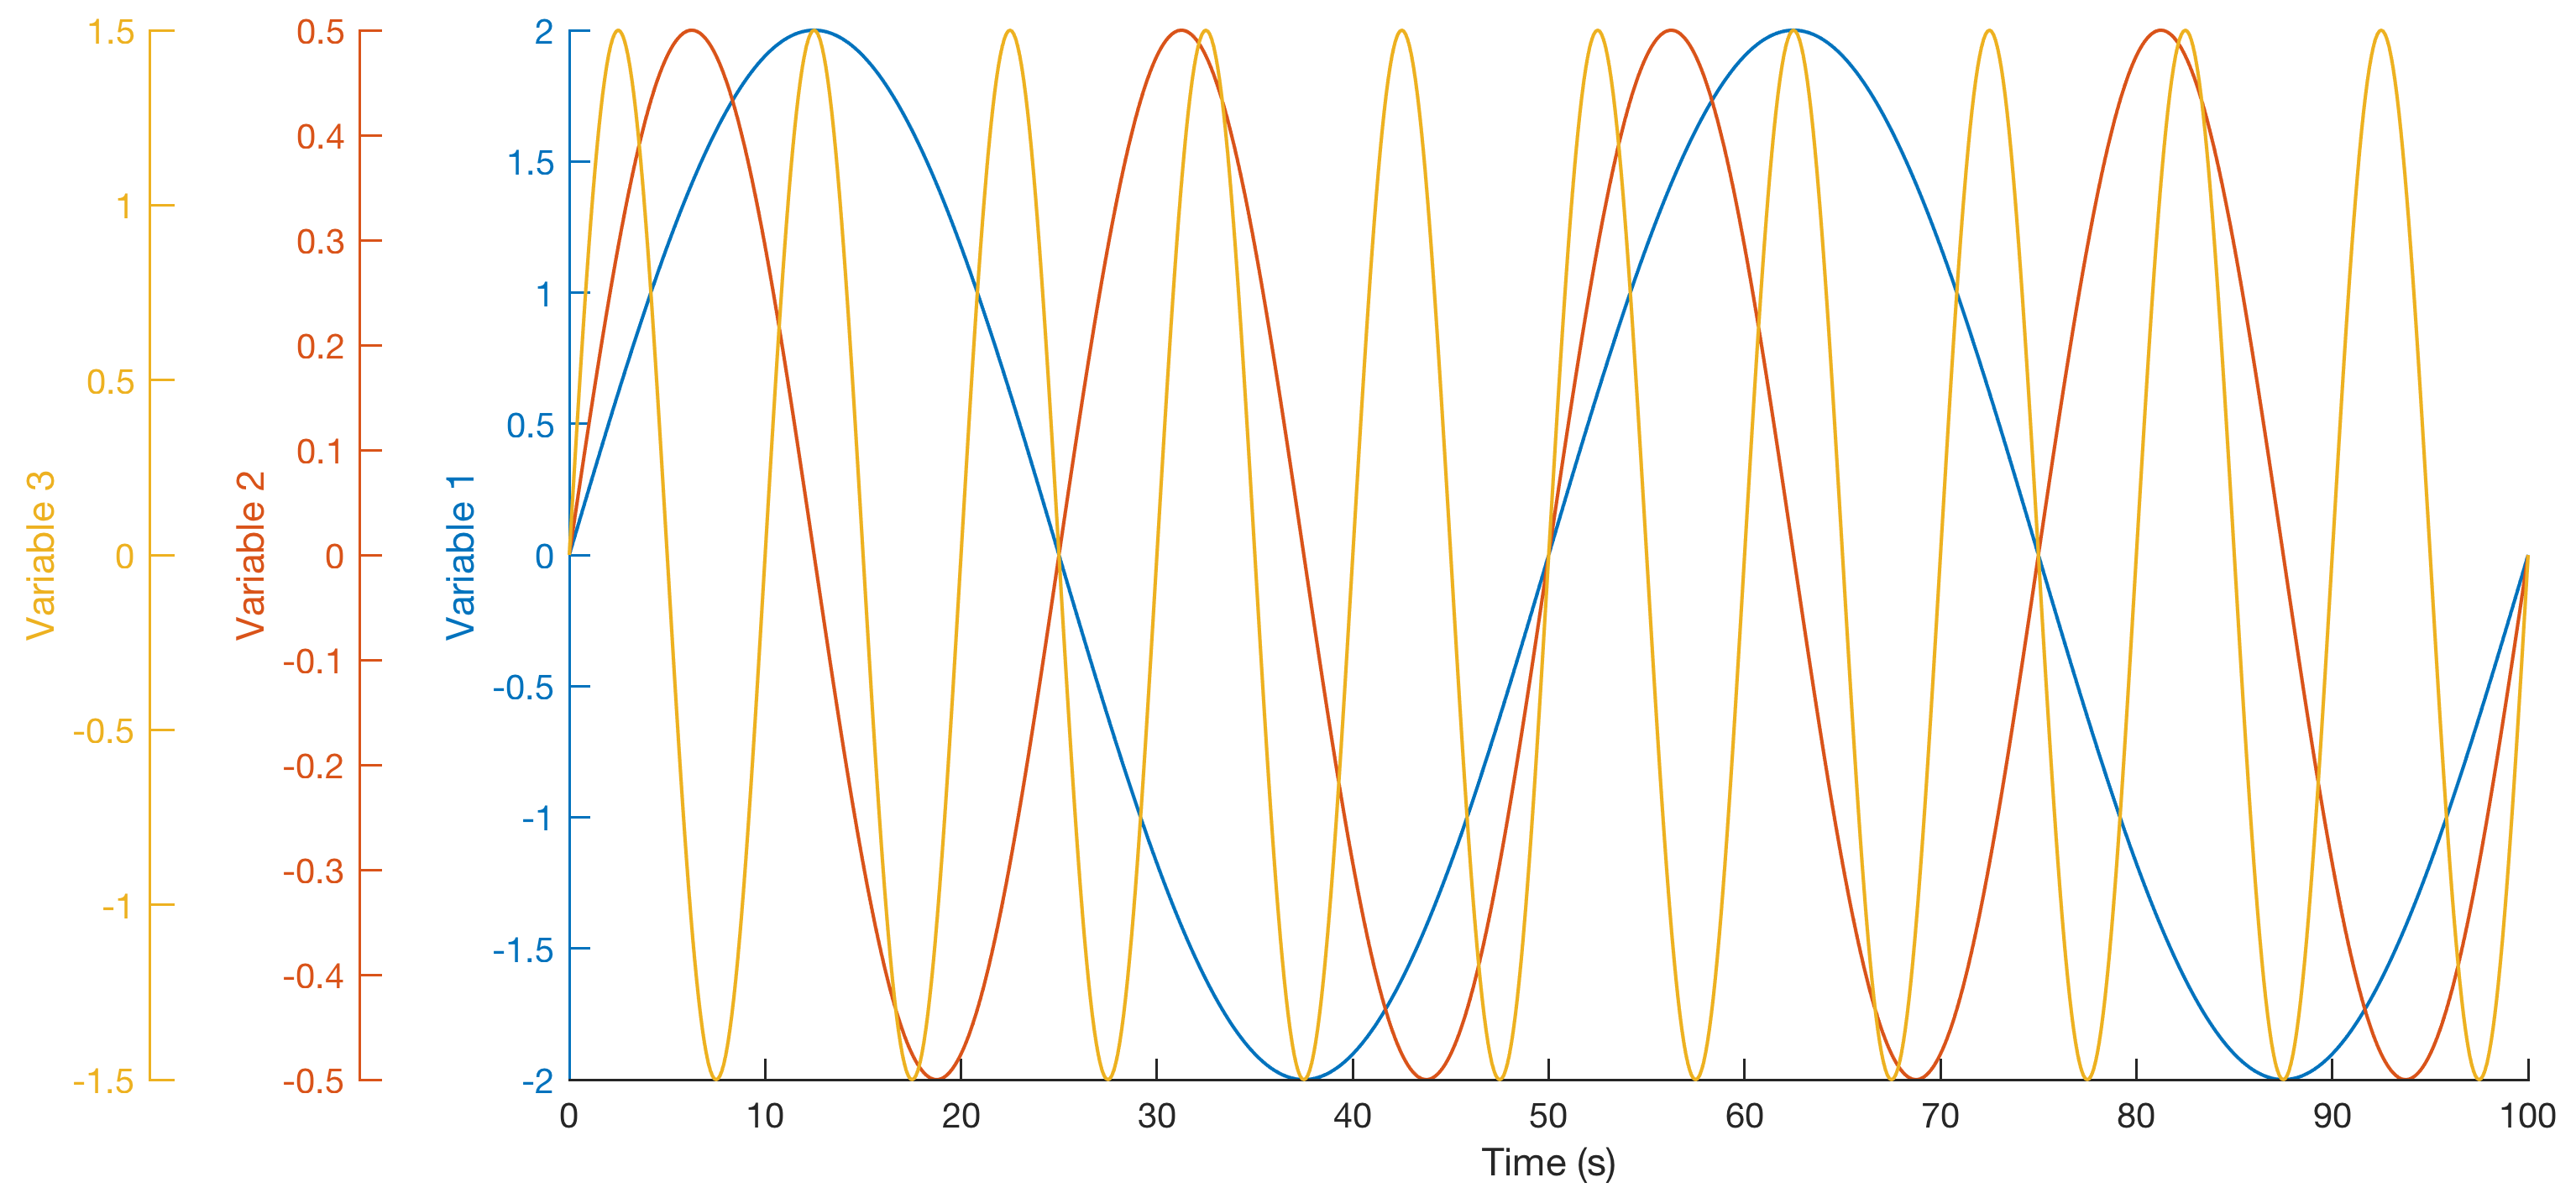
First, we generate a synthetic data from sinusoidal oscillations with different wavelengths and amplitudes.
clear, clc, close all
t = 0 : 0.1 : 100;
data(:,1) = 2*sin(2*pi*t/50);
data(:,2) = 0.5*sin(2*pi*t/25);
data(:,3) = 1.5*sin(2*pi*t/10);
For the graphics we produce three colors.
colors = [
      0 114 189
    217 83 25
    237 177 32]./255;
Then we open a figure window, create the axes and plot a line plot in these axes.
figure('Position',[50 600 800 400],'Color',[1 1 1])

ax(1) = axes('Position',[0.225 0.15 0.7 0.75],...
   'XLim',[min(t) max(t)],...
   'LineWidth',0.7,...
   'YTick',[],...
   'Color','None',...
   'YColor','None'); hold on
xlabel('Time (s)')
line(t,data(:,1),...
   'LineWidth',1,...
   'Color',colors(1,:))
ax(2) = axes('Position',[0.225 0.15 0.7 0.75],...
   'XLim',[min(t) max(t)],...
   'YLim',get(ax(1),'YLim'),...
   'LineWidth',0.7,...
   'XTick',[],...
   'YAxisLocation','Left',...
   'Color','None',...
   'XColor','None',...
   'YColor',colors(1,:)); hold on
ylabel('Variable 1')

ax(3) = axes('Position',[0.225 0.15 0.7 0.75],...
   'XLim',[min(t) max(t)],...
   'LineWidth',0.7,...
   'XTick',[],...
   'YTick',[],...
   'Color','None',...
   'YColor','None'); hold on
line(t,data(:,2),...
   'LineWidth',1,...
   'Color',colors(2,:))
ax(4) = axes('Position',[0.15 0.15 0.775 0.75],...
   'XLim',[min(t) max(t)],...
   'YLim',get(ax(3),'YLim'),...
   'LineWidth',0.7,...
   'XTick',[],...
   'YAxisLocation','Left',...
   'Color','None',...
   'XColor','None',...
   'YColor',colors(2,:)); hold on
ylabel('Variable 2')

ax(5) = axes('Position',[0.225 0.15 0.7 0.75],...
   'XLim',[min(t) max(t)],...
   'LineWidth',0.7,...
   'XTick',[],...
   'YTick',[],...
   'Color','None',...
   'YColor','None'); hold on
line(t,data(:,3),...
   'LineWidth',1,...
   'Color',colors(3,:))
ax(6) = axes('Position',[0.075 0.15 0.85 0.75],...
   'XLim',[min(t) max(t)],...
   'YLim',get(ax(5),'YLim'),...
   'LineWidth',0.7,...
   'XTick',[],...
   'YAxisLocation','Left',...
   'Color','None',...
   'XColor','None',...
   'YColor',colors(3,:)); hold on
ylabel('Variable 3')
The graphic has three axes with different axis limits.