
The XrdML file format is used to store X-ray powder diffraction measurements. Since XrdML format using the .xrdml file extension is an XML-based open file format using an ASCII format, reading such files with MATLAB is easy. Here is an example of reading multiple XrdML files from a file directory, convert the files in text files, display the measurements together with standard mineral data from a XRD data base.
The XrdML format was created by PANalytical B.V. as a version of the open XML format to store XRD results. The following MATLAB script allows to extract the 2theta and intensity from the XrdML files. You can also define min and max 2theta values, as well as an interval to interpolate the data upon an alternative theta grid. The script then saves the 2theta values to the file collect2theta.txt and the intensities of all XrdML in a single file collectintensities.txt.
Do you wish to use the original data (thetaopt=0) or to limit the 2thetas (thetaopt=1) or to limit and/or decimate the 2thetas (thetaopt=2)? The new 2theta limits *thetaminnew* and *thetamaxnew* have to be defined, as well as the 2theta interval *thetaint* for thetaopt=2. If the values of thetaminnew and thetamaxnew are outside the range of 2theta in the data set the values will be adjusted to thetamin and thetamax. This avoids extrapolation of the data beyond the limits of the original data.
clear, clc, close all
thetaopt = 2;
thetaminnew = 30;
thetamaxnew = 50;
thetaint = 0.015;
Do you wish to display the spectra? no=0, yes=1
dispopt = 1;
Define and read file from RRUFF data base (https://www.rruff.net)
fidA = fopen('Analcime__R040128-1.txt');
A2 = textscan(fidA,'%f %f',...
   'Delimiter',',',...
   'Headerlines',11,...
   'CollectOutput',1);
fclose(fidA);
rruff = A2{1};
Listing XrdML files in the current working directory (data from Foerster et al., 2018).
filelist = dir('*.xrdml');
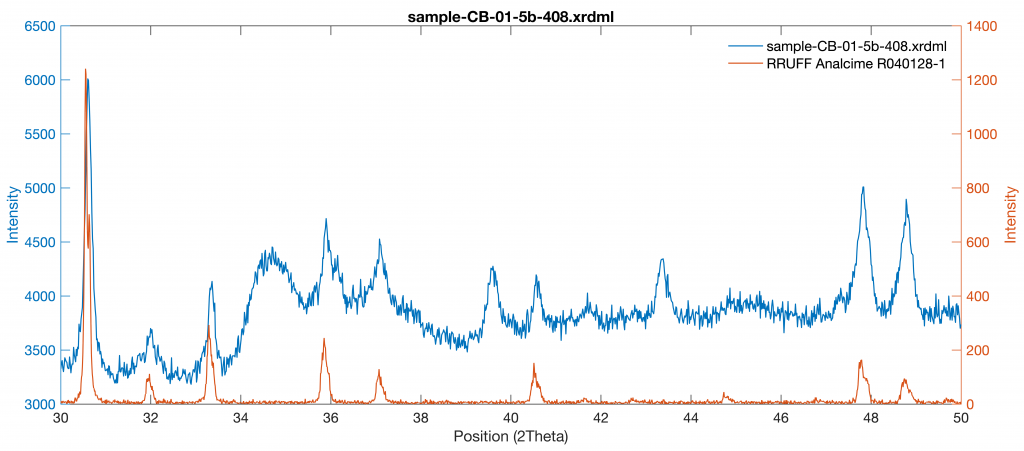
Read all files listed in *list* and convert to .txt files. It also display the measurements (in blue) together with the mineral standard (in orange).
h = waitbar(0,'Please wait...');

for i = 1 : size(filelist,1)

waitbar(i/size(filelist,1),h)
filename = filelist(i).name;

clear *data

fidA = fopen(filename);
formatSpec='<startPosition>%f</startPosition>';
A1 = textscan(fidA,formatSpec,...
   'Delimiter',{'>';'<'},...
   'Headerlines',89);
fclose(fidA);
thetamin = A1{1};

fidA = fopen(filename);
formatSpec='<endPosition>%f</endPosition>';
A2 = textscan(fidA,formatSpec,...
   'Delimiter',{'>';'<'},...
   'Headerlines',90);
fclose(fidA);
thetamax = A2{1};

fidA = fopen(filename);
formatSpec = '%s';
A3 = textscan(fidA,formatSpec,...
   'Delimiter',{'>';'<';' '},...
   'Headerlines',100);
fclose(fidA);
A3 = A3{1}(4:end-9);
intensities = str2double(A3);

clear fidA

theta = thetamin : (thetamax-thetamin)/...
   (size(A3,1)-1) : thetamax;
theta = theta';

if thetaminnew < thetamin
disp('The value of thetaminnew is adjusted')
thetaminnew=thetamin
end
if thetamaxnew > thetamax
disp('The value of thetamaxnew is adjusted')
thetamaxnew=thetamax
end

data(:,1) = theta;
data(:,2) = intensities;

if thetaopt==1
newdata = data(data(:,1)>=thetaminnew & ...
   data(:,1)<=thetamaxnew,:);
data = newdata;
elseif thetaopt==2
newdata(:,1) = thetaminnew : thetaint : ...
   thetamaxnew;
newdata(:,2) = interp1(data(:,1),data(:,2),...
newdata(:,1),'pchip');
data = newdata;
end

if dispopt==1
figure(...
   'Position',[200 200 1200 300],...
   'Color',[1 1 1])
axes(...
   'Box','on',...
   'LineWidth',0.6,...
   'XLim',[thetaminnew thetamaxnew],...
   'FontName','Helvetica',...
   'FontSize',10);
yyaxis left
line(data(:,1),data(:,2),...
   'LineWidth',0.75)
xlabel('2Theta')
ylabel('Intensity')
yyaxis right
line(rruff(:,1),rruff(:,2),...
   'LineWidth',0.75)
ylabel('Intensity')
title(filename)
legend(filenname,...
   'RRUFF Analcime R040128-1',...
   'Location','Northeast',...
   'Box','Off');
end

newfilename = [filename(1:end-6),'.txt'];
save(newfilename,'data','-ascii')
collect2theta(:,1) = data(:,1);
collectintensities(:,i) = data(:,2);

end
close(h)

save('collect2theta.txt','collect2theta',...
    '-ascii')
save('collectintensities.txt',...
    'collectintensities','-ascii')
References
Foerster, V., Deocampo, D., Asrat, A., Günter, C., Junginger, A., Krämer, H., Stroncik, N., Trauth, M.H. (2018) Towards an understanding of climate proxy formation in the Chew Bahir basin, southern Ethiopian Rift. Palaeogeography, Palaeoclimatology, Palaeoecology, 501, 111-123.