
Creating Graphical User Interfaces (GUIs) with MATLAB is very easy and can be done either by coding the GUI entirely in the MATLAB Editor, by using the GUI Design Environment (GUIDE) or the new MATLAB App Designer. Here is an example for creating a GUI with GUIDE within ten minutes.
When I first programmed a GUI in the early 1990s, there was neither the GUIDE nor the App Designer. My first GUI, coded in the MATLAB Editor, was designed to create an easy way of using an adaptive filter, described in an earlier post. For the 4th edition of MRES I redesigned the GUI using GUIDE. At about the same time, the App Designer was introduced but it was not fully developed and still in the testing stage.
GUIDE is a drag-and-drop environment for laying out graphical user interfaces (GUIs). GUIDE provides various interactive components, including menus, tool bars, and tables. In addition to standard components such as buttons, check boxes, and panels also available with the GUIDE, the App Designer has gauges, lamps, knobs, and switches for inclusion in your app. The App Designer I will present in a later post, while it is here first about the GUIDE.
The best way to create a graphical user interface with MATLAB is using the GUI Design Environment (GUIDE). We start GUIDE by typing
guide
in the Command Window. Calling GUIDE opens the GUIDE Quick Start dialog where we can create a new one from a template. From the dialog we choose the GUIDE template Blank GUI (Default) and click OK, after which the GUIDE Layout Editor starts. First, we enable Show names in component palette in the GUIDE Preferences under the File menu and click OK. Second, we select Grid and Rulers from the Tools menu and enable Show rulers. The GUIDE Layout Editor displays an empty layout with dimensions of 670-by-388 pixels. We resize the layout to 500-by-300 pixels by clicking and dragging the lower right corner of the GUI.
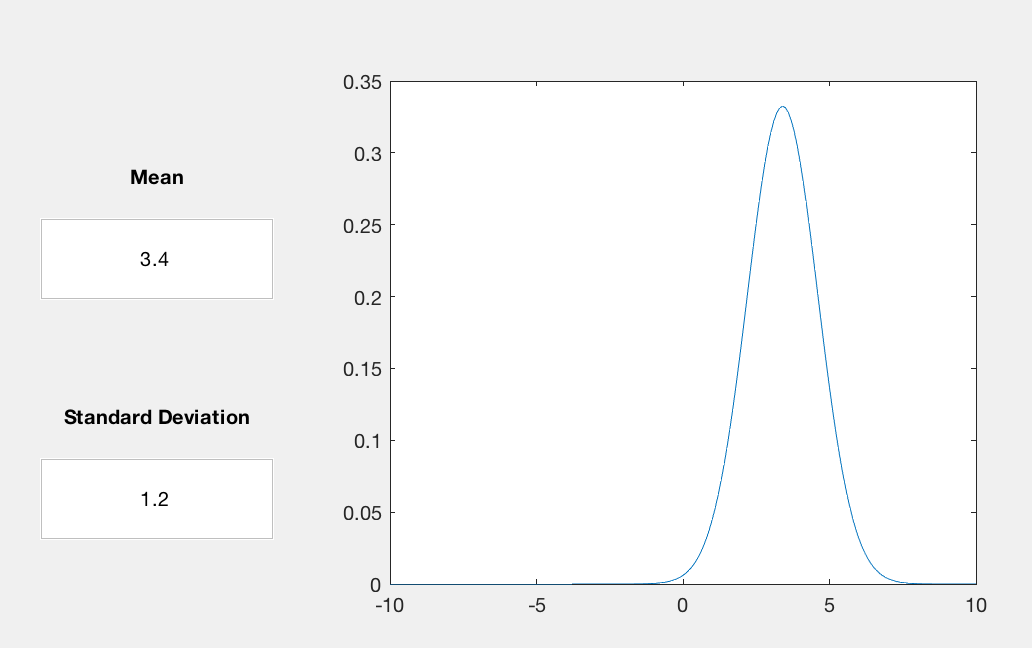
Next, we place components such as static text, edit text, and axes onto the GUI by choosing the corresponding controls from the component palette. In our example we place two Edit Text areas on the left side of the GUI, along with a Static Text area containing the title Mean, with Standard Deviation above it. Double clicking the static text areas, the Property Inspector comes up in which we can modify the properties of the components. We change the String of the static text areas to Mean and Standard Deviation.
Instead of the default Edit Text content of the edit text areas we choose 0 for the mean and 1 for the standard deviation text area. We then place an axis with dimensions of 250-by-200 pixels to the right of the GUI. Next, we save and activate the GUI by selecting Run from the Tools menu. GUIDE displays a dialog box with the question Activating will save changes …?, where we click Yes. In the following Save As dialog box, we define a FIG-file name such as gaussiantool.fig.
GUIDE then saves this figure file together with the corresponding MATLAB code in a second file named gaussiantool.m. Furthermore, the MATLAB code is opened in the Editor and the default GUI is opened in a Figure Window with no menu or toolbar. As we can see, GUIDE has automatically programmed the code of our GUI layout, including an initialization code at the beginning of the file that we should not edit. This code is included in the main routine named gaussiantool.
The file also contains other functions called by gaussiantool, for instance the function gaussiantool_Opening_Fcn (executed before gaussiantool is made visible), gaussiantool_OutputFnc (sending output to the command line, not used here), edit1_CreateFcn and edit2_CreateFcn (initializing the edit text areas when they are created), and edit1_Callback and edit2_Callback (accepting text input and returning this input either as text or as a double-precision number).
We now add code to our GUI gaussiantool. First, we add initial values for the global variables mmean and mstd in the opening function gaussiantool_Opening_Fcn by adding the following lines after the last comment line marked by % in the first column:
global mmean mstd
mmean = 0;
mstd = 1;
The two variables must be global because they are used in the callbacks that we edit next. The first of these callbacks edit1_Callback gets three more lines of code after the last comment line:
global mmean
mmean = str2double(get(hObject,'String'));
calculating_gaussian(hObject, eventdata, handles)
The first line defines the global variable mmean, which is then obtained by converting the text input into double precision with str2double in the second line. The function edit1_Callback then calls the function calculating_gaussian, which is a new function at the end of the file. This function computes and displays the Gaussian function with a mean value of mmean and a standard deviation of mstd.
function calculating_gaussian(hObject, eventdata, handles)
% hObject    handle to edit2 (see GCBO)
% eventdata  reserved - to be defined in a
%            future version of MATLAB
% handles    empty - handles not created
%            until after all CreateFcns called
global mmean mstd
x = -10 : 0.1 : 10;
y = normpdf(x, mmean, mstd);
plot(x,y)
The second callback edit2_Callback picks the value of the standard deviation mstd from the second Edit Text area, which is then also used by the function calculating_gaussian.
global mstd
mstd = str2double(get(hObject,'String'));
calculating_gaussian(hObject, eventdata, handles)
After saving the file gaussiantool.m we can run the new GUI by typing
gaussiantool
in the Command Window. The GUI starts where we can change the values of the mean and the standard deviation, then press return. The plot on the right is updated with each press of the return key. Using
edit gaussiantool
guide gaussiantool
we can open the GUI code and Figure Window for further edits. Such GUIs allow a very direct and intuitive handling of functions in MATLAB that can also include animations. On the other hand, however, GUIs always require an interaction with the user who needs to click push buttons, move sliders and edit text input fields while the data is being analyzed. The automatic processing of large quantities of data is therefore usually carried out using scripts and functions with no graphical user interface.