Creating functions with a graphical user interface (GUI), previously know as tools, now called apps (for applications), with MATLAB is easy thanks to the AppDesigner. Here is an update of an demonstration published in Section 2.12 of the MRES book.
The manual entitled MATLAB App Building (MathWorks 2023) provides a comprehensive guide to the creation of GUIs with MATLAB. This manual, however, demonstrates a rather complex example with many interactive elements, rather than providing the simplest possible example of a GUI. The following text therefore provides a very simple example of a GUI that computes and displays a Gaussian function for a mean and a standard deviation that can be defined by the user. Creating such a simple GUI with MATLAB requires two steps: the first step involves designing the layout of the GUI, and the second step involves adding functions to the components of the GUI.
We can create a graphical user interface with MATLAB using the App Designer. We start the App Designer by typing
appdesigner
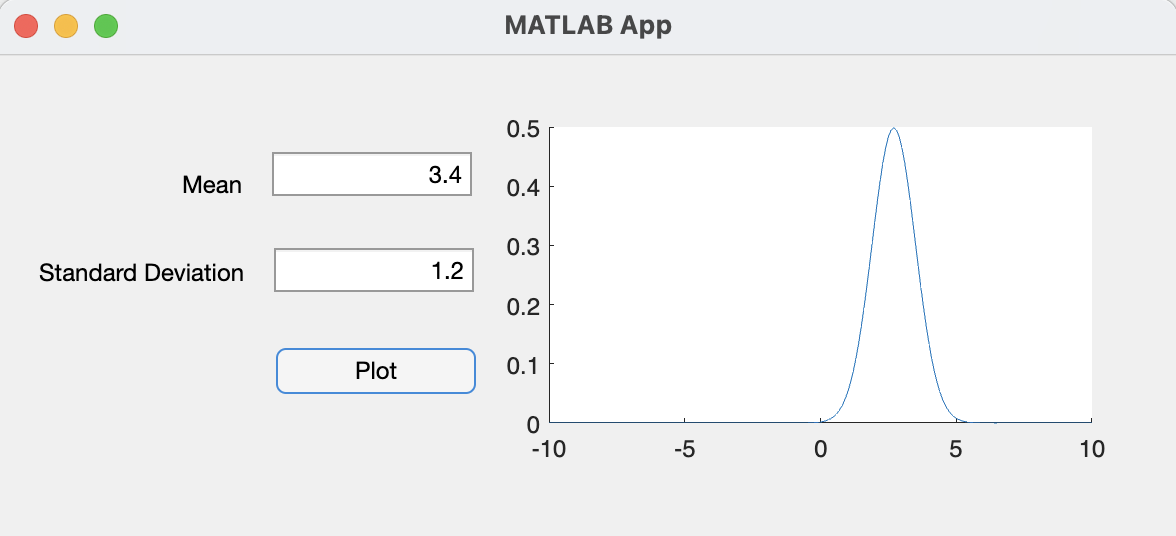
in the Command Window. We drag and drop components such as two Edit Field (Numeric) areas on the left side of the GUI, which contains static text areas that we change to Mean and Standard Deviation and an empty field for entering numerical values. Below these we place a Button whose label we change to Plot. We then place an axis on the right of the GUI. Next, we save and activate the GUI by selecting Run from the toolbar of the App Designer. In the following Save As dialog box, we define a name such as gaussiantool.mlapp.
The App Designer then saves the app and the default GUI is opened in a Figure Window entitled UI Figure, with no menu or toolbar. The App Designer has automatically programmed the code of our GUI layout, which we can view by switching from the Design View to the Code View in the user interface of the tool. The App Designer allows us to edit only those parts of the code that are highlighted in white, while all lines highlighted in gray are not editable.
First, we add functions for the Edit Field (Numeric) areas, the Button and the axis. To do this, we right-click on add.MeanEditField in the Component Browser on the right, then on Callbacks and then on Add ValueChangedFcn callback. This operation inserts the function MeanEditFieldValueChanged into the code in which we first define a global variable mmean. This variable is then changed in the callback function app.MeanEditField.Value, where we change the variable value to mmean. The function now looks like this:
% Value changed function: MeanEditField
function MeanEditFieldValueChanged(app,event)
   app.mmean = app.MeanEditField.Value;
end
We change the function to enter the standard deviation accordingly:
% Value changed function: StdEditField
function StdEditFieldValueChanged(app,event)
   app.mstd = app.StdEditField.Value;
end
Finally we modify the code for the push button:
% Button pushed function: PlotButton
function PlotButtonPushed(app, event)
   x = -10 : 0.1 : 10;
   y = normpdf(x,app.mmean,app.mstd);
   plot(app.UIAxes,x,y)
This function creates an array x running from –10 to +10 in steps of 0.1. It then computes and displays the Gaussian function with a mean value of mmean and a standard deviation of mstd. Finally, we define mmean and mstd as public properties to share data within the app by pushing the Public Property button of the toolbar. This creates a public properties block where we can the two properties mmean and mstd as well as their initial values.
properties (Access = public)
   mmean = 3.4; % Mean
   mstd = 1.2; % Standard deviation
end
After saving the file gaussianapp.mlapp we can run the new GUI by typing
gaussianapp
in the Command Window. The GUI starts where we can change the values of the mean and the standard deviation, then press Plot. The plot on the right is updated with each press of the Plot button. Using
appdesigner gaussianapp
we can open the GUI for further edits. Such GUIs allow a very direct and intuitive handling of functions in MATLAB that can also include animations such as the one used in canctool (Section 6.10), and the display of an audio-video signal. On the other hand, however, GUIs always require an interaction with the user, who needs to click push buttons, move sliders and edit text input fields while the data is being analyzed. The automatic processing of large quantities of data is therefore more often carried out using scripts and functions with no graphical user interface.
Download code of the Gaussian App.
References
MathWorks (2023) MATLAB App Building. The MathWorks, Inc., Natick, MA
Trauth, M.H. (2021) MATLAB Recipes for Earth Sciences – Fifth Edition. Springer International Publishing, 517 p., ISBN 978-3-030-38440-1. (MRES)