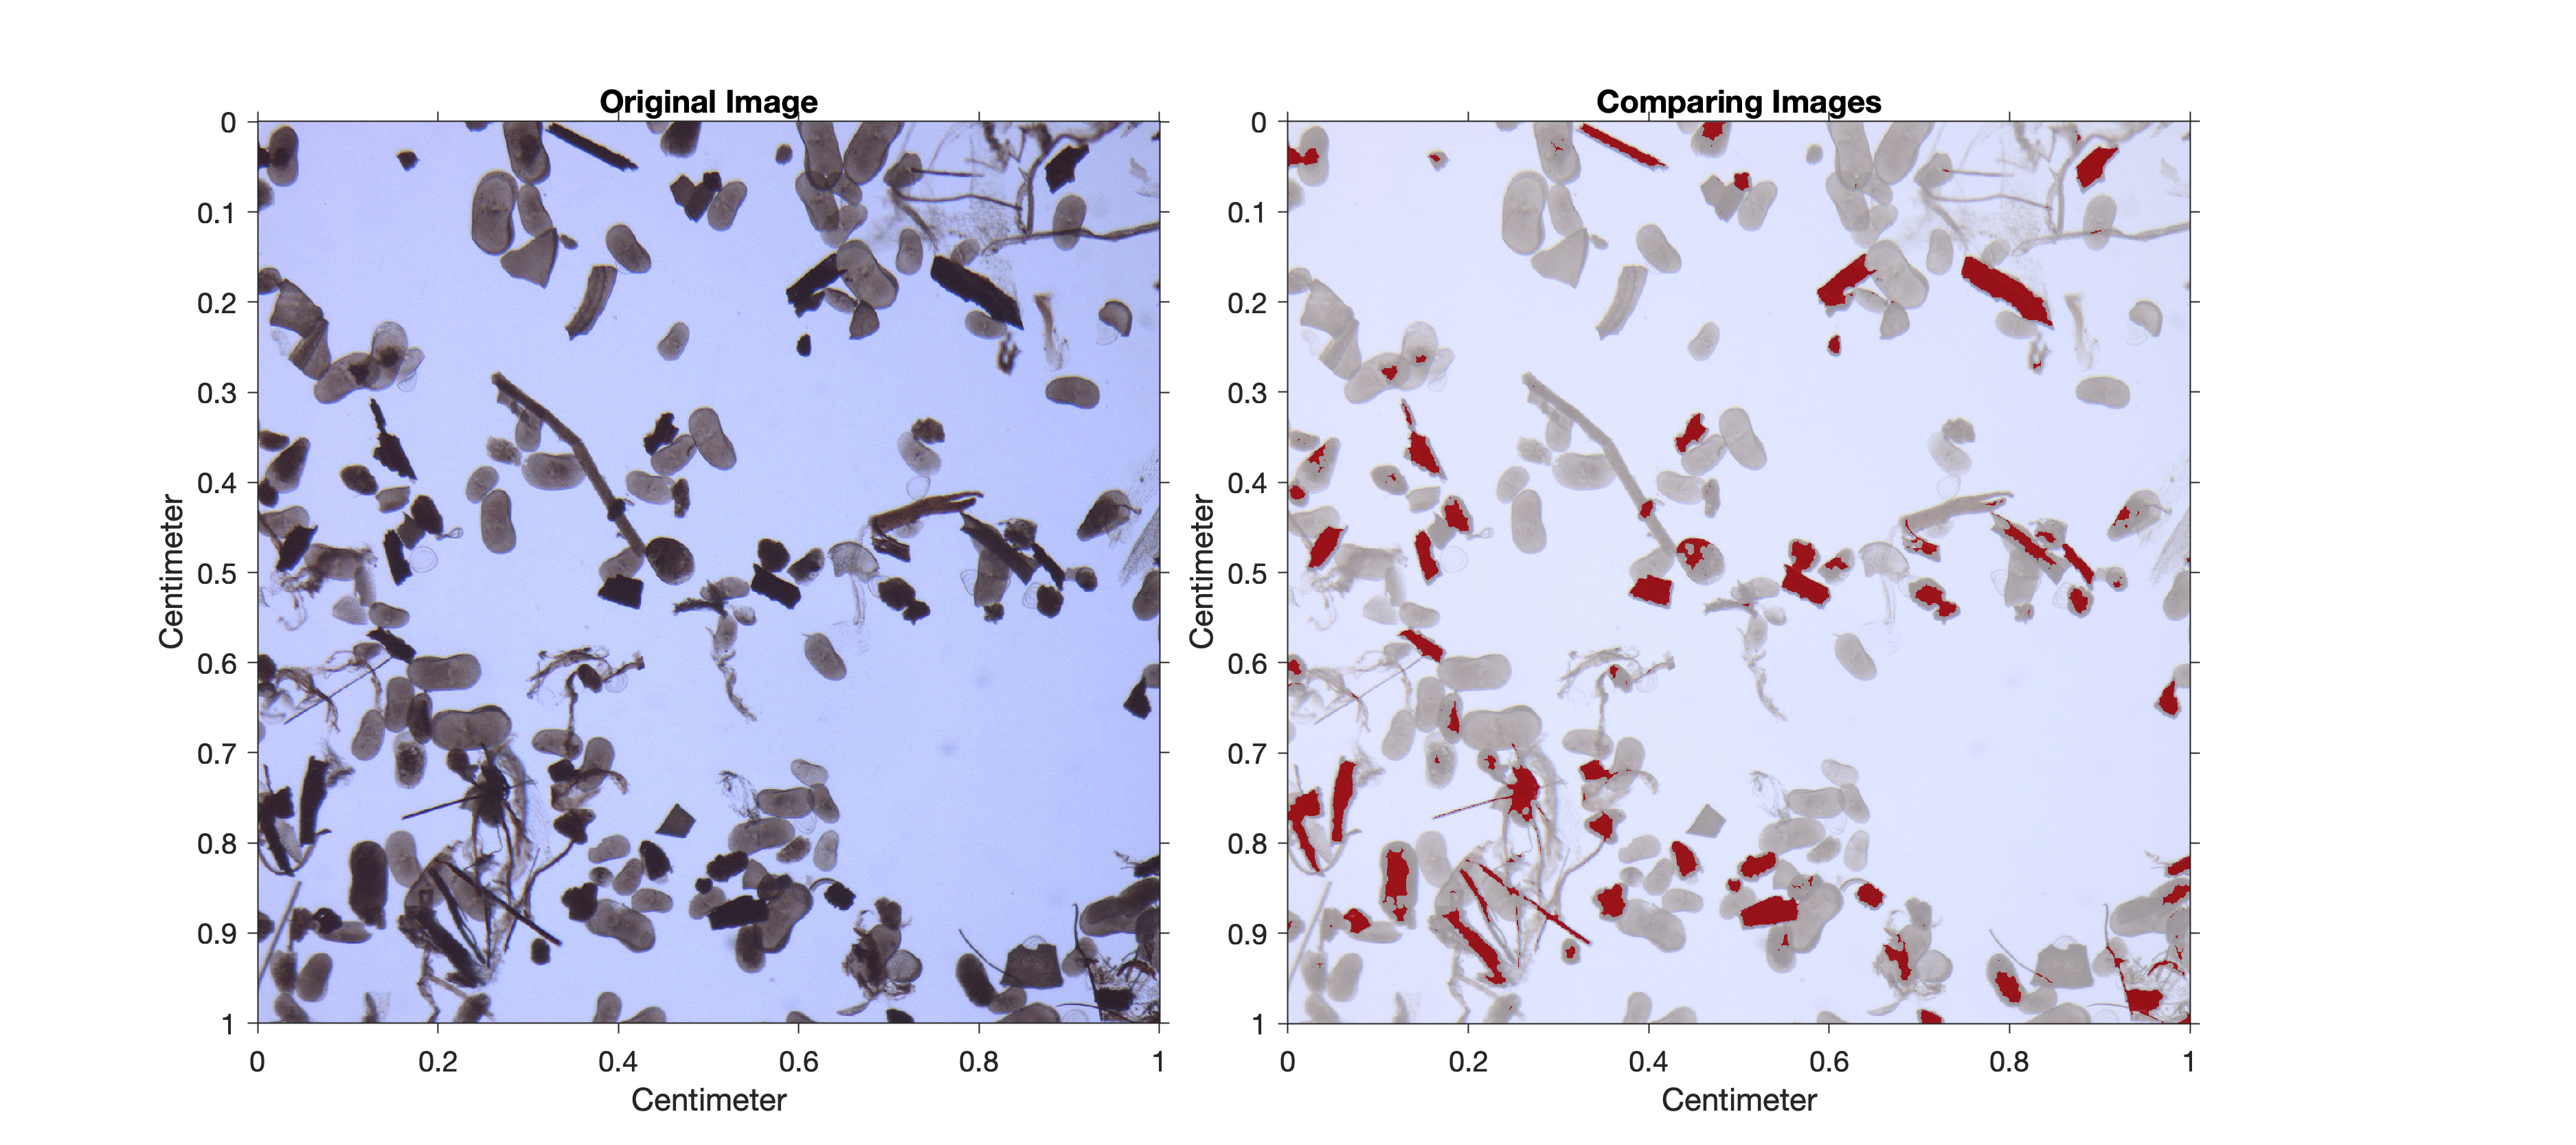
Principal Component Analysis in 6 Steps – the Python Version

The Principal Component Analysis (PCA) is equivalent to fitting an n-dimensional ellipsoid to the data, where the eigenvectors of the covariance matrix of the data set are the axes of the ellipsoid. The eigenvalues represent the distribution of the variance among each of the eigenvectors. To understand the method, it is helpful to know something about matrix algebra, eigenvectors, and eigenvalues. Here is a n=2 dimensional example to perform a PCA without the use of the NumPy function pca, but with the function of eig for the calculation of eigenvectors and eigenvalues. Continue reading “Principal Component Analysis in 6 Steps – the Python Version”

MATLAB Code of “TURBO2: A MATLAB simulation to study the effects of bioturbation on paleoceanographic time series” (Trauth, C&G 2013)

Here you find the MATLAB code and data of my paper “TURBO2: A MATLAB simulation to study the effects of bioturbation on paleoceanographic time series” published in the Elsevier journal Computers & Geosciences. Continue reading “MATLAB Code of “TURBO2: A MATLAB simulation to study the effects of bioturbation on paleoceanographic time series” (Trauth, C&G 2013)”

55th Online Shortcourse on MATLAB & Python Recipes for Earth Sciences

The popular online course on data analysis in the geosciences will be taught bilingual for the first time, using the two leading programming languages and development environments MATLAB and Python in parallel on 19–23 September 2022. The course is based on the 5th edition of my book MATLAB Recipes for Earth Science (Springer 2021) and on the new book Python Recipes for Earth Sciences (Springer, in press).

Continue reading “55th Online Shortcourse on MATLAB & Python Recipes for Earth Sciences”

Creating Attractive 3D graphics with MATLAB and Python – A Competition!

While I was writing the new book Python Recipes for Earth Sciences, a Python version of my popular textbook MATLAB Recipes for Earth Sciences, difficulties kept cropping up in reproducing the MATLAB graphs. Either it took much longer with Python or the graphics were just less pretty. Of course, it’s up to me, a less experienced Python user, so I invite all Python users to do better! Continue reading “Creating Attractive 3D graphics with MATLAB and Python – A Competition!”