
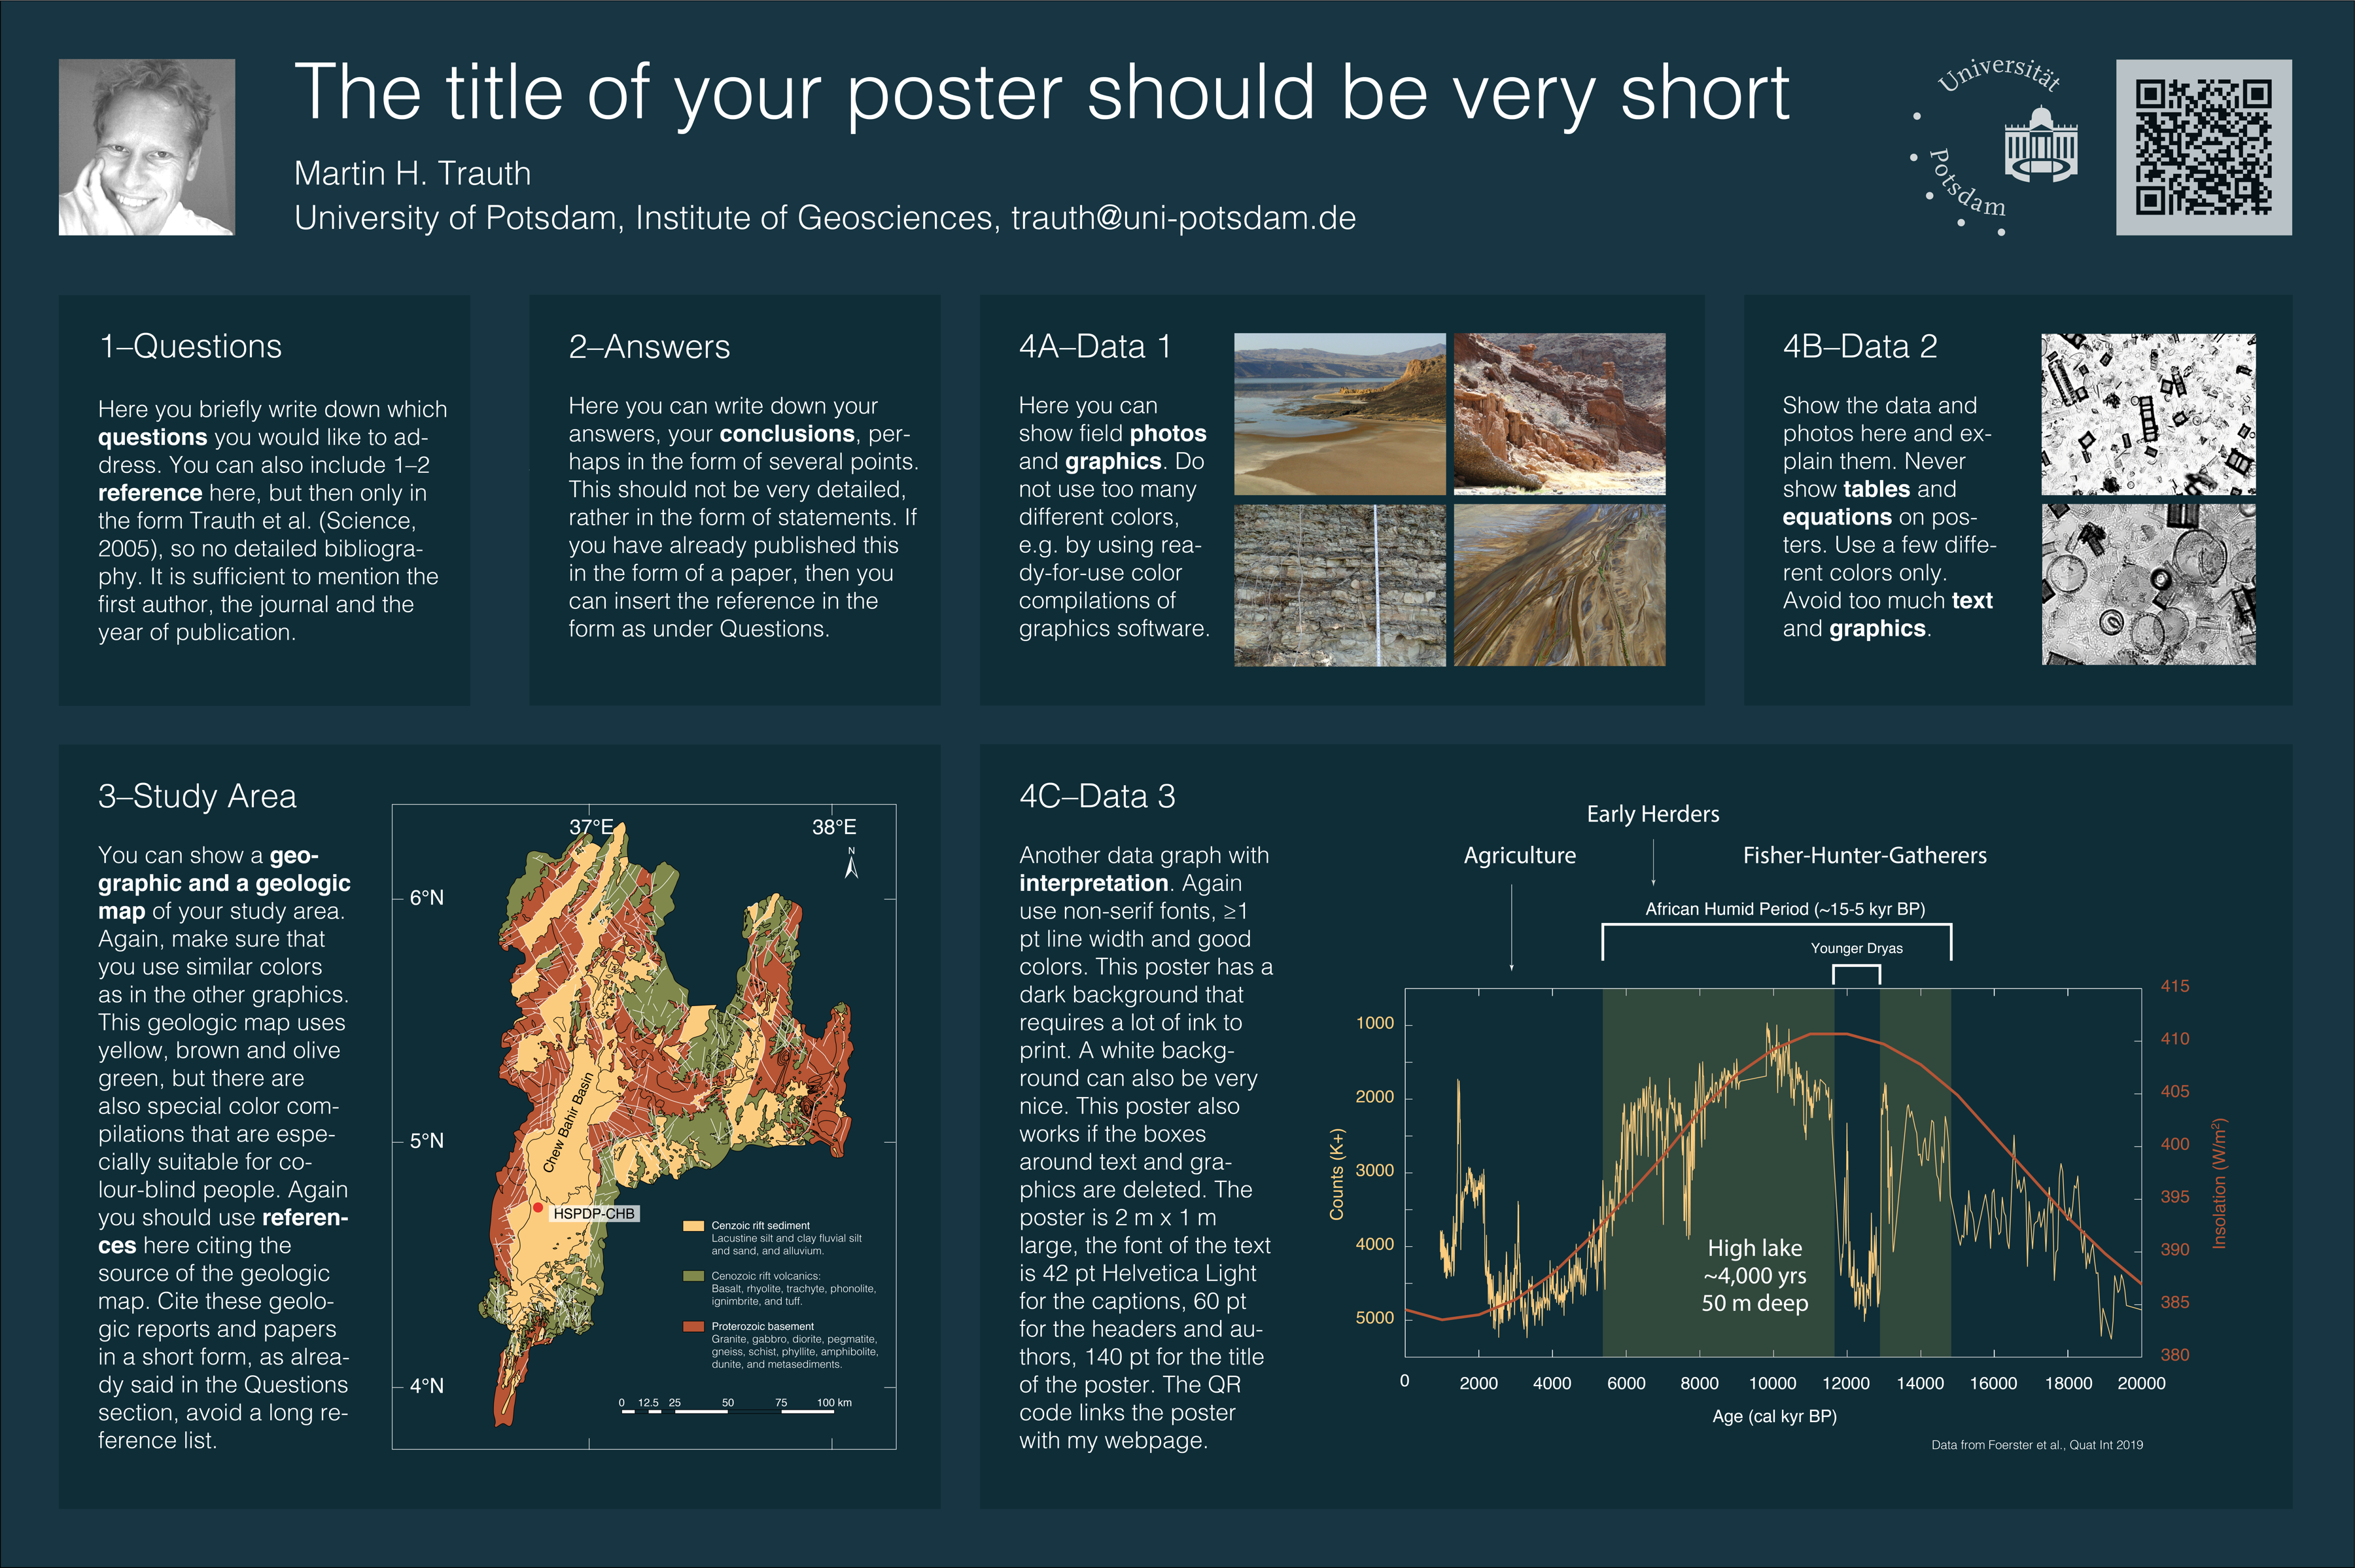
 In two earlier posts, I presented templates for a conference poster with dark and white background. Here’s the white template in various formats.
This week the topic of designing posters was hot again on Twitter. And quickly a passionate discussion developed about whether one should design posters with PowerPoint. The main argument of the supporters of the idea to design posters with PowerPoint is that almost all of them have it available as part of the Microsoft Office suite.
In fact, PowerPoint is a vector graphics program (as opposed to a raster or pixel editing program like Adobe Photoshop). It allows you place vector objects such as rectangles or text and change their graphic attributes such as line thicknesses, color or size. Also, it has some essential features of vector graphics software, such as grouping or locking objects, which prevents accidental moving or modifying objects during design.
However, it lacks an essential function of vector graphics software, namely the creation, locking and hiding of layers (Ebenen, in German). Here’s the structure of the Adobe Illustrator / PDF template that you can download from below:
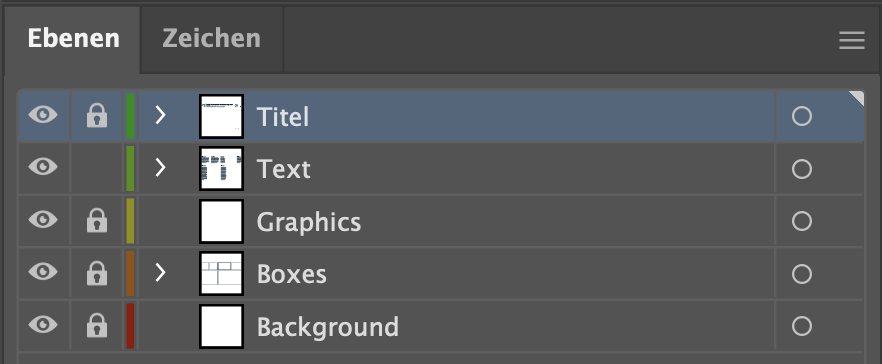
In many of my graphs I use 10-20 layers, in geological maps often much more, which makes working with these graphs much easier. However, I recognize that many scientists have been using PowerPoint for years and see no reason to switch, simply because their posters are not very complicated.
For these colleagues I offer two more templates, in addition to the Adobe Illustrator template with layers, namely for the presentation programs Microsoft PowerPoint and Apple Keynote. These templates look almost the same, but have no layers. Since this program does not allow large formats like 150 cm x 100 cm, care must be taken when printing to scale the posters accordingly.
Download poster template as a PDF file (927 KB)
Download poster template as Microsoft PowerPoint file (496 KB)
Download poster template as Apple Keynote file (2.2 MB)
Download poster template as LibreOffice Impress file (2.2 MB)