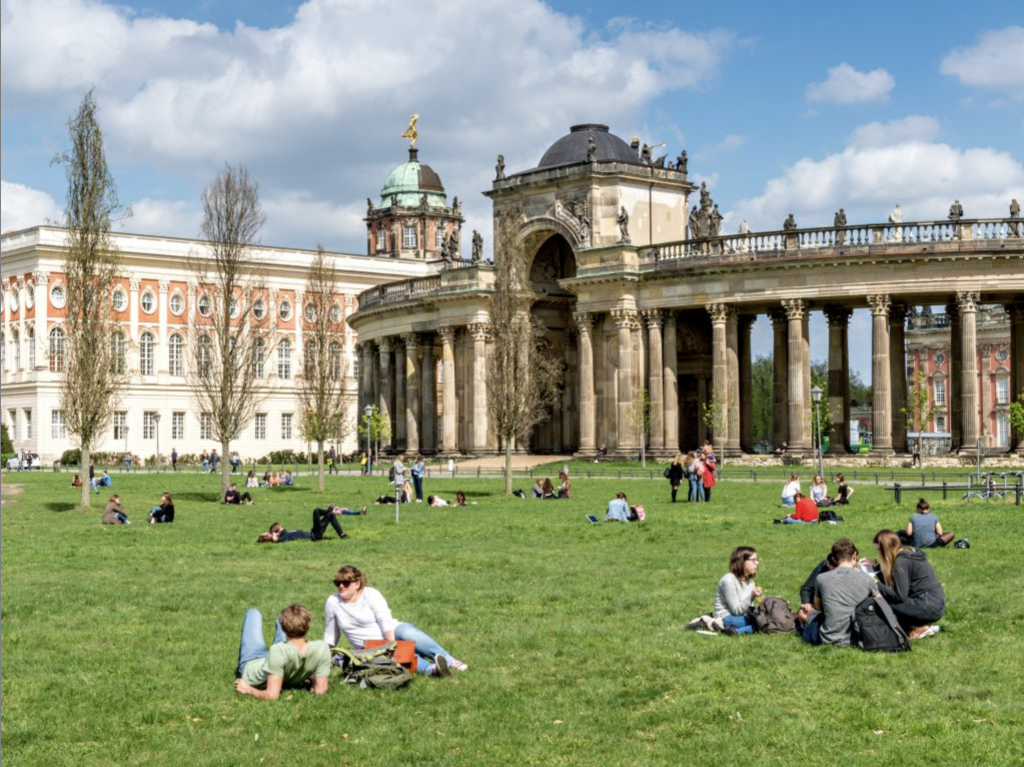
Now that the recipe book is available for both MATLAB and Python, many Python users will also look into the MATLAB version and discover the beauty of the older sister of Python. There is hope for these people, especially if they want to switch: you can call Python in MATLAB! Here is how.
Creating Apps with the MATLAB App Designer
Creating functions with a graphical user interface (GUI), previously know as tools, now called apps (for applications), with MATLAB is easy thanks to the AppDesigner. Here is an update of an demonstration published in Section 2.12 of the MRES book. Continue reading “Creating Apps with the MATLAB App Designer”
Removing Periodic Noise from Images with MATLAB
It can happen that an electromagnetic field disturbs the images of cameras on microscopes with a periodic noise. While the specialists are looking for the source of the interference, I quickly wrote a MATLAB script to filter the noisy image.
Continue reading “Removing Periodic Noise from Images with MATLAB”
Quantifying Charcoal in Microscope Images Using MATLAB, Part 2
Quantifying the composition of substances in geosciences, such as the mineral composition of a rock in thin sections, or the amount of charcoal in sieved sediment samples, is facilitated by the use of image processing methods. Thresholding provides a simple solution to segmenting objects within an image that have different coloration or grayscale values. As an example we use thresholding to separate the dark charcoal particles and count the pixels of these particles after segmentation. Continue reading “Quantifying Charcoal in Microscope Images Using MATLAB, Part 2”
Adaptive Filters in Paleoclimatology – the Python Version
Paleoclimate time series are often very noisy due to the combined effect of low sedimentation rates, intensive bioturbation and small sample sizes (5-20 foraminifers). Adaptive filters may help to increase the signal-to-noise ratio of such time series where conventional methods such as fixed filters cannot be applied if optimal filtering is to be achieved, because the signal-to-noise ratio is unknown and varies with time. Continue reading “Adaptive Filters in Paleoclimatology – the Python Version”
Analyzing Climate Transitions with MATLAB
Detecting, measuring and classifying transitions in climate time series is one of the most important applications in modern time series analysis (Mudelsee, 2000; Trauth et al., 2018, 2021). Three methods are presented here: sigmoid fit, ramp fit and change point detection. Continue reading “Analyzing Climate Transitions with MATLAB”
Creating a Map with Coastlines and Topo Contours with MATLAB
Variants of a map of northeastern Africa appear in recent publications (e.g., Trauth et al., 2021a, b) using coastlines from the GSHHG data set and topography from the ETOPO1 data set. Here I show how it was made. Continue reading “Creating a Map with Coastlines and Topo Contours with MATLAB”
Creating a Bubble Chart Animation with MATLAB
We wanted to display pulsating circles on a map and save the result in a video. Here is part one, the pulsating circles. The map will come in the next post.
Continue reading “Creating a Bubble Chart Animation with MATLAB”