
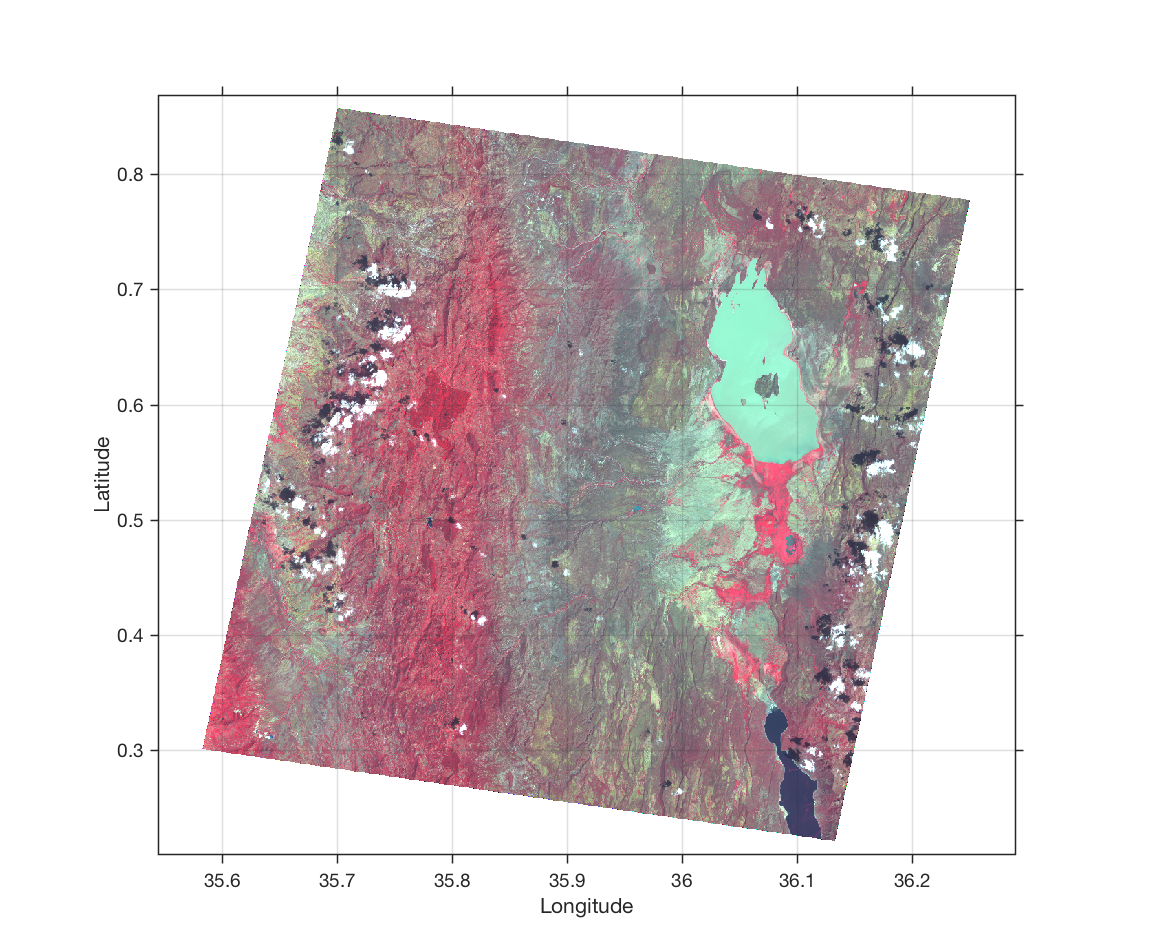
 Since 1 April 2016 all ASTER data products are free to all users. Here is an example, different from the one described in the MRES book, to demonstrate how to import, enhance and georeference an ASTER image with MATLAB. Continue reading “Importing and Georeferencing TERRA ASTER Images with MATLAB, Part 1”
MATLAB-Based Detection of the Orientation of Handaxes
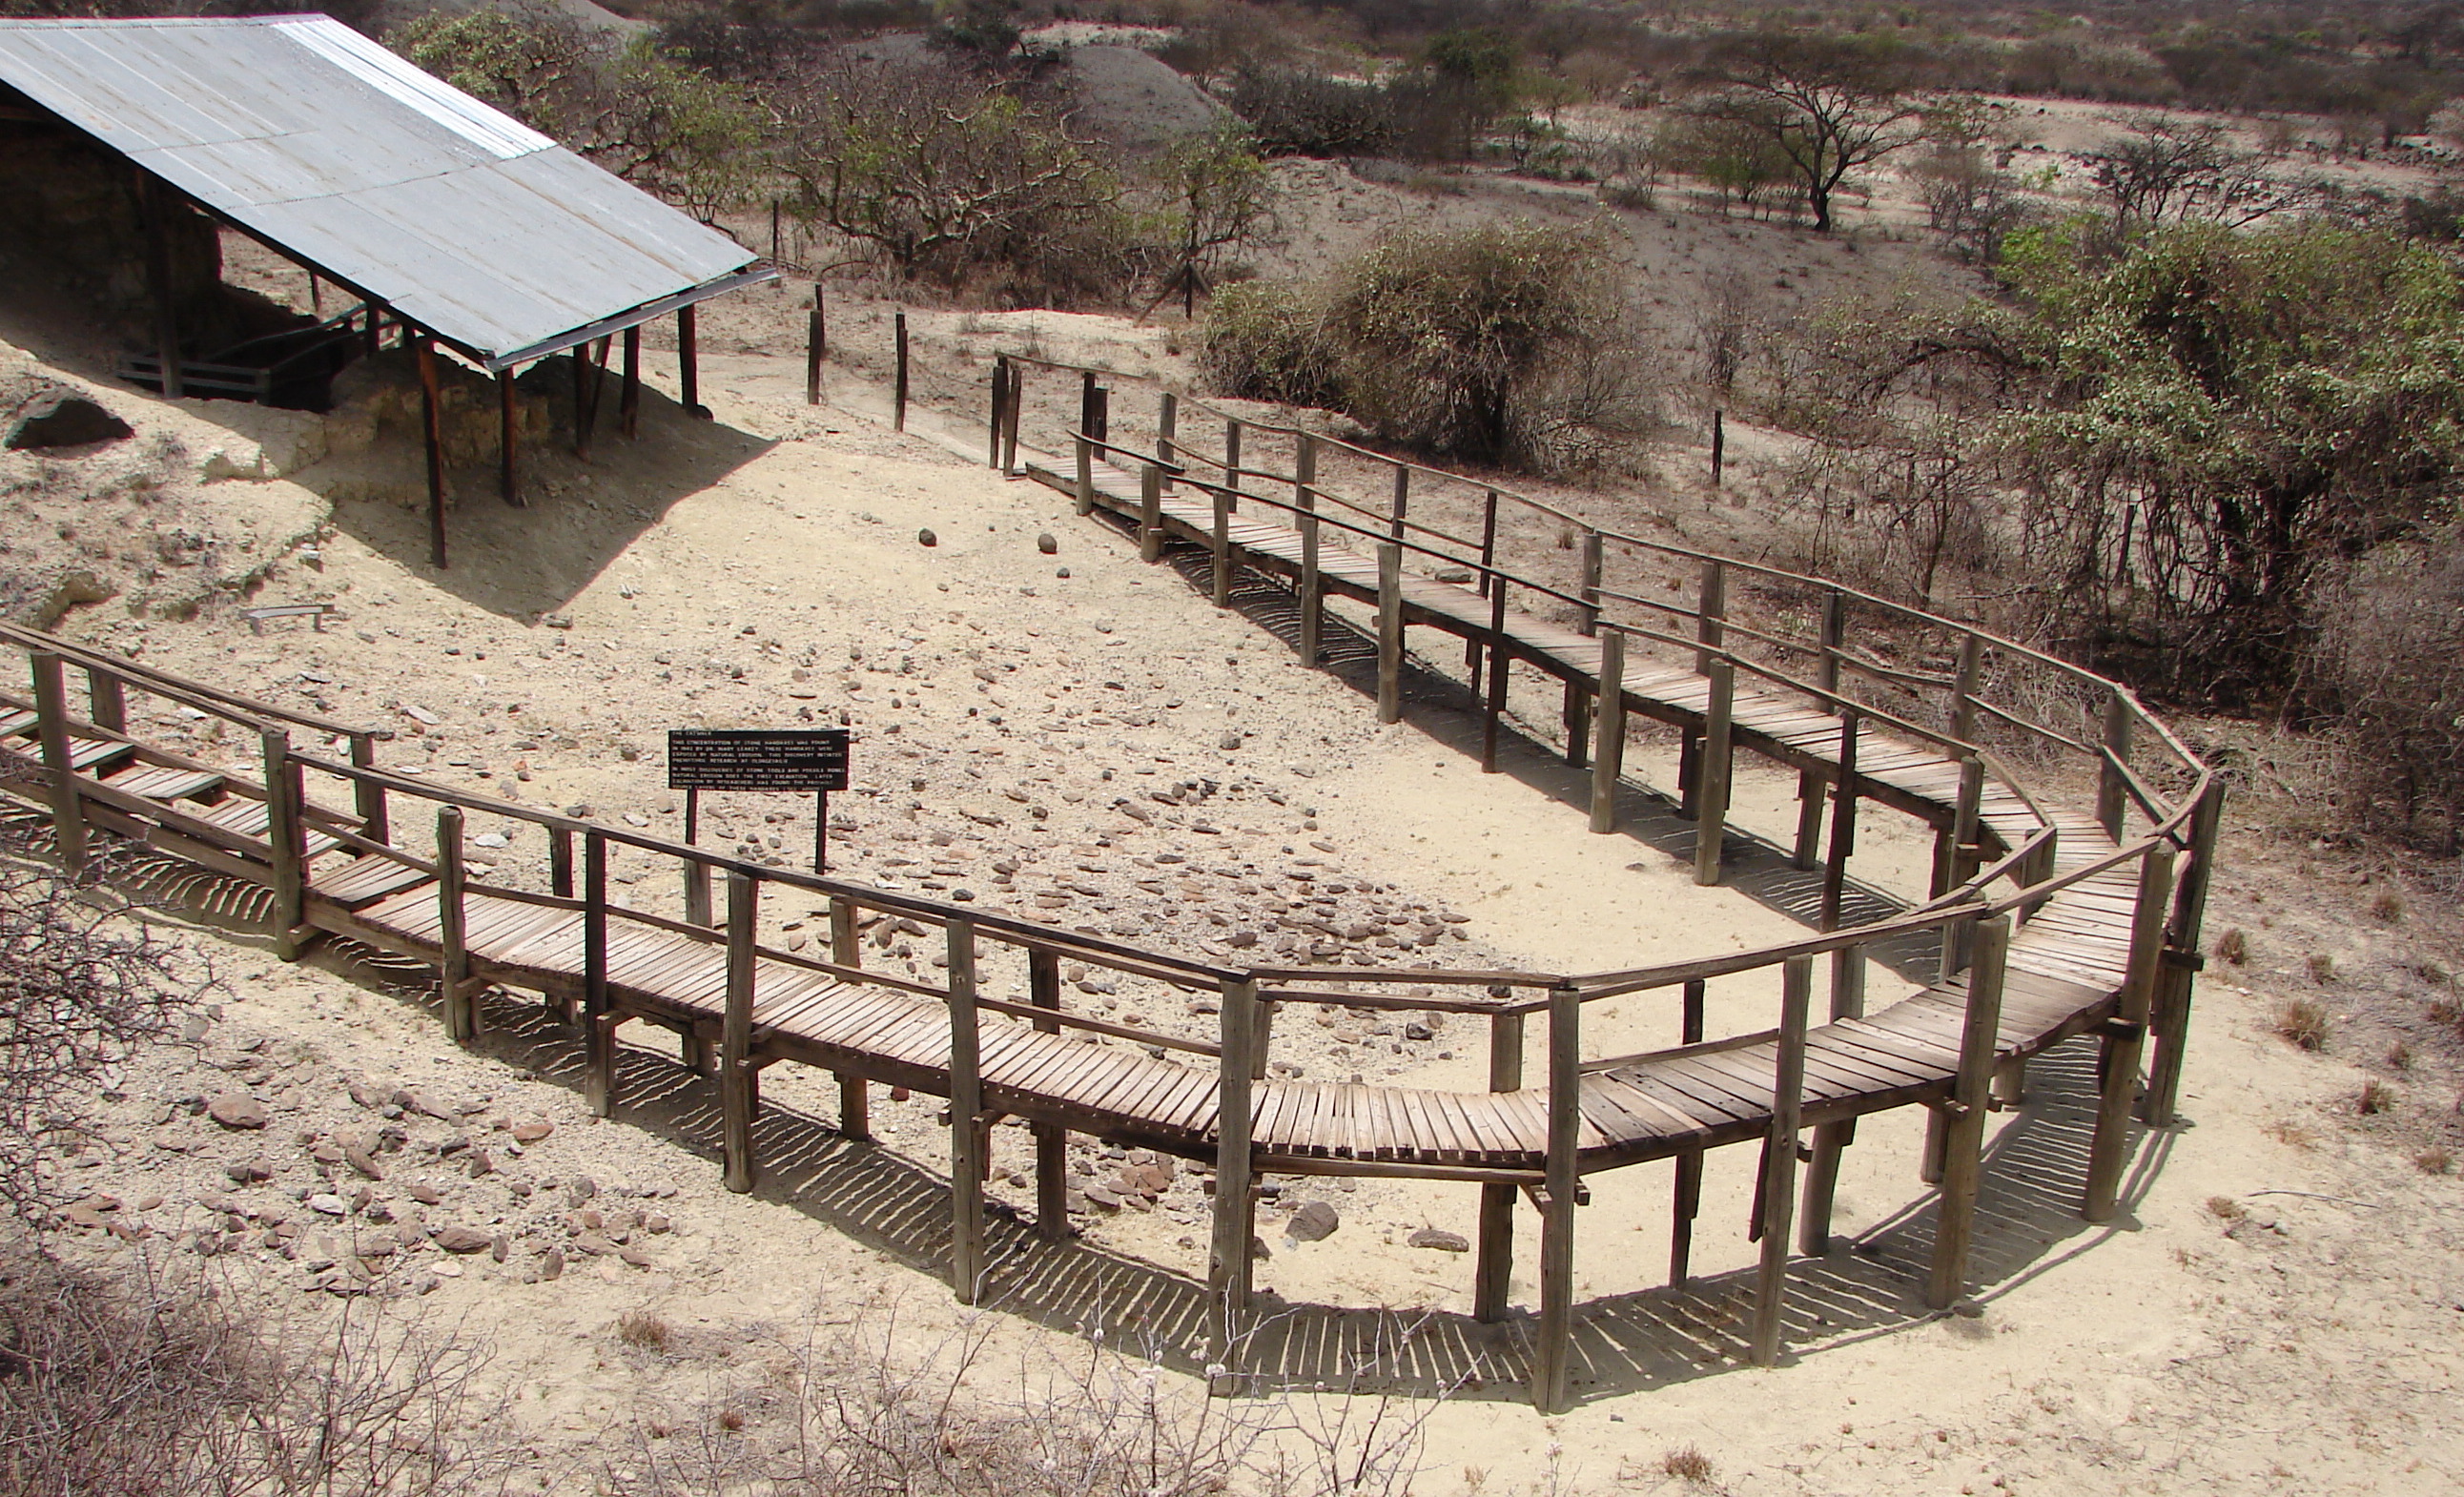
Some archeological sites in East Africa revealed unusual accumulations of Acheulean handaxes, such as in Olorgesailie in Southern Kenya (see photo above) and in Kariandusi in Central Kenya. It has been debated whether these accumulations were a result of fluvial reworking or of in situ deposition by hominins. A MATLAB-based algorithm to automatically determine the orientation of handaxes in excavation plans helps to test the preferred orientation of stone tools as the result of fluvial reworking.
Continue reading “MATLAB-Based Detection of the Orientation of Handaxes”
Exporting EPS Files from MATLAB with CMYK Colors
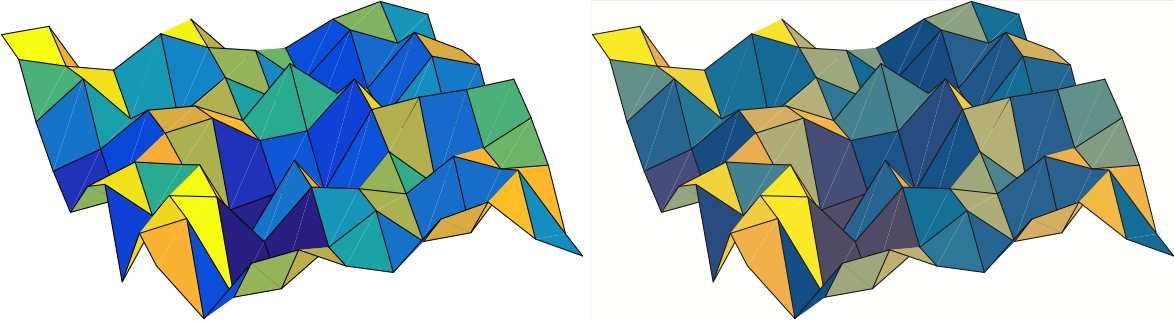
Most graphics exported from MATLAB, as said in a previous post, are of publishable quality, but some graphics require further editing to add more graphics elements. Unfortunately, EPS files with a CMYK model exported from MATLAB use a US color profile, not a ISO color profile. Import these files into Adobe Illustrator with a ISO set of color profiles, the colors are not displayed correctly. The following blog post explains the problem and provides a possible solution. Continue reading “Exporting EPS Files from MATLAB with CMYK Colors”
Merging SRTM Files in MATLAB
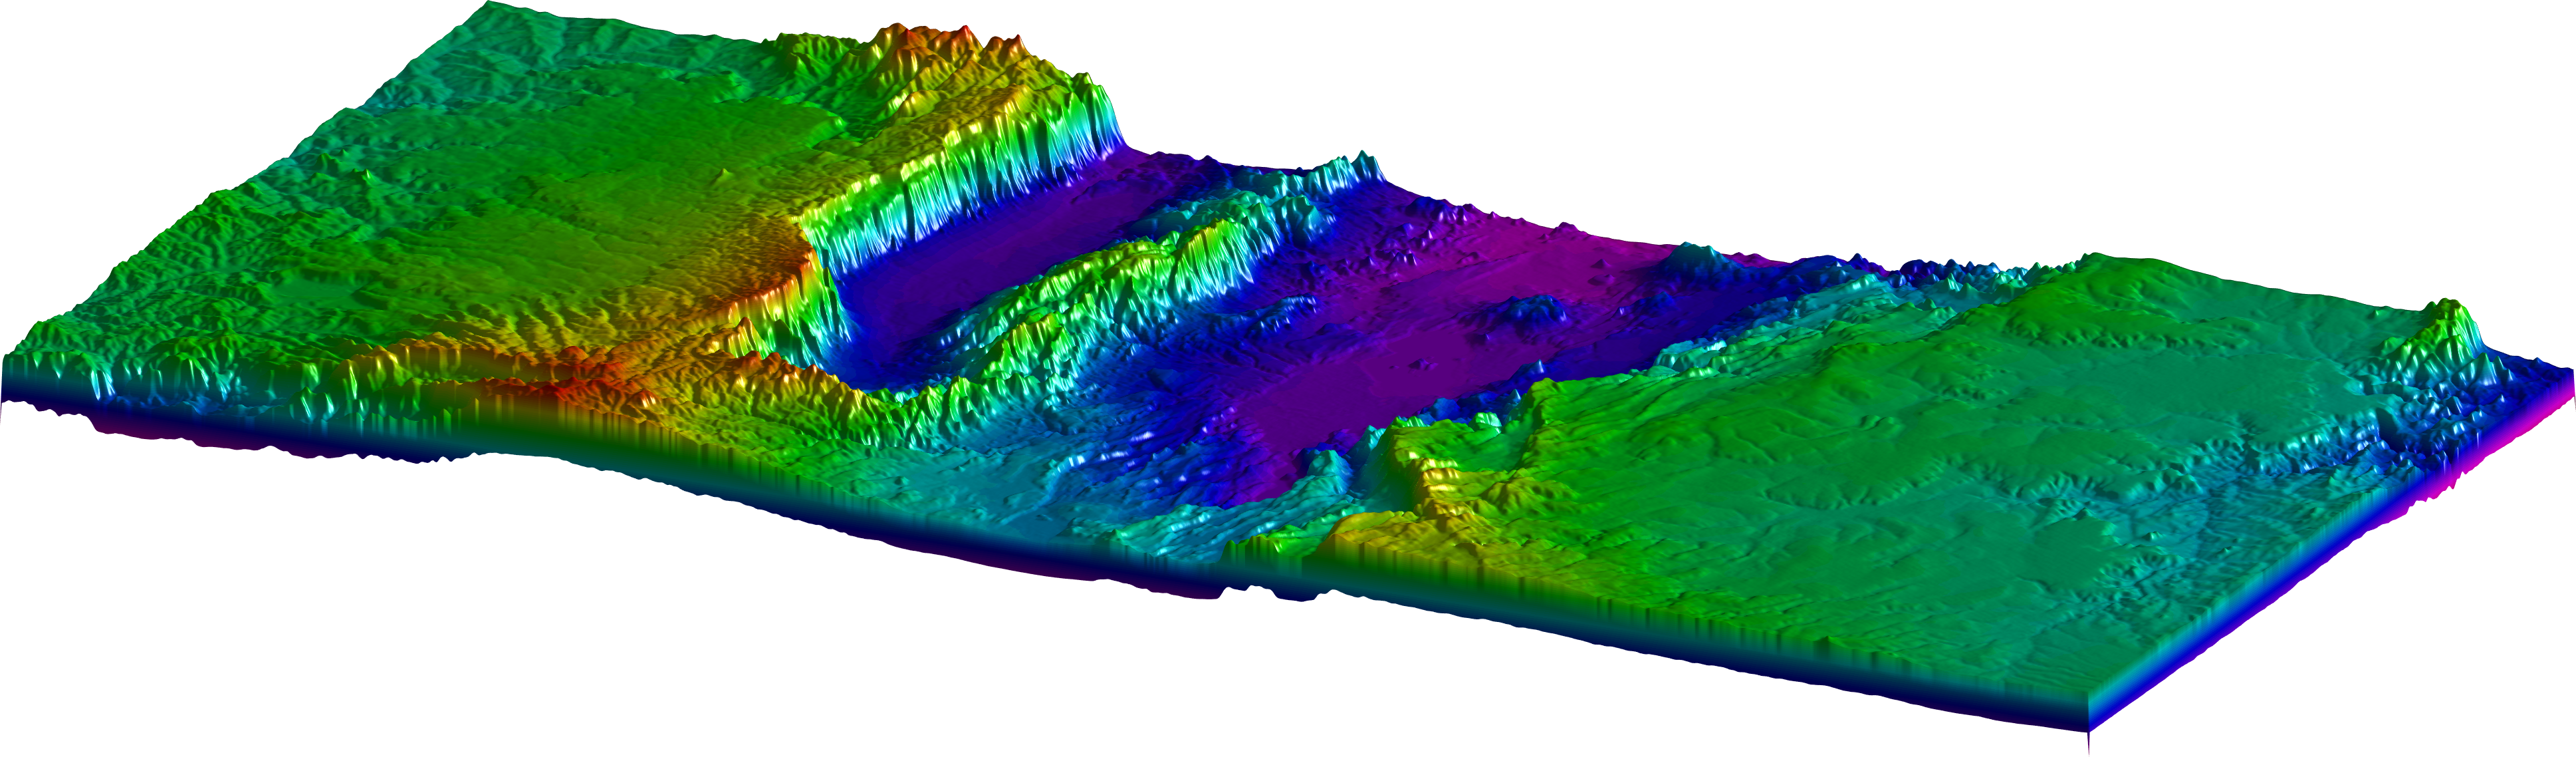
The free 1-arc minute Shuttle Radar Topography Mission (SRTM) data are very popular digital terrain models (DEM). Here is a script for merging and visualizing multiple SRTM data sets to larger DEMs with MATLAB. Continue reading “Merging SRTM Files in MATLAB”
The Story of the MRES Book
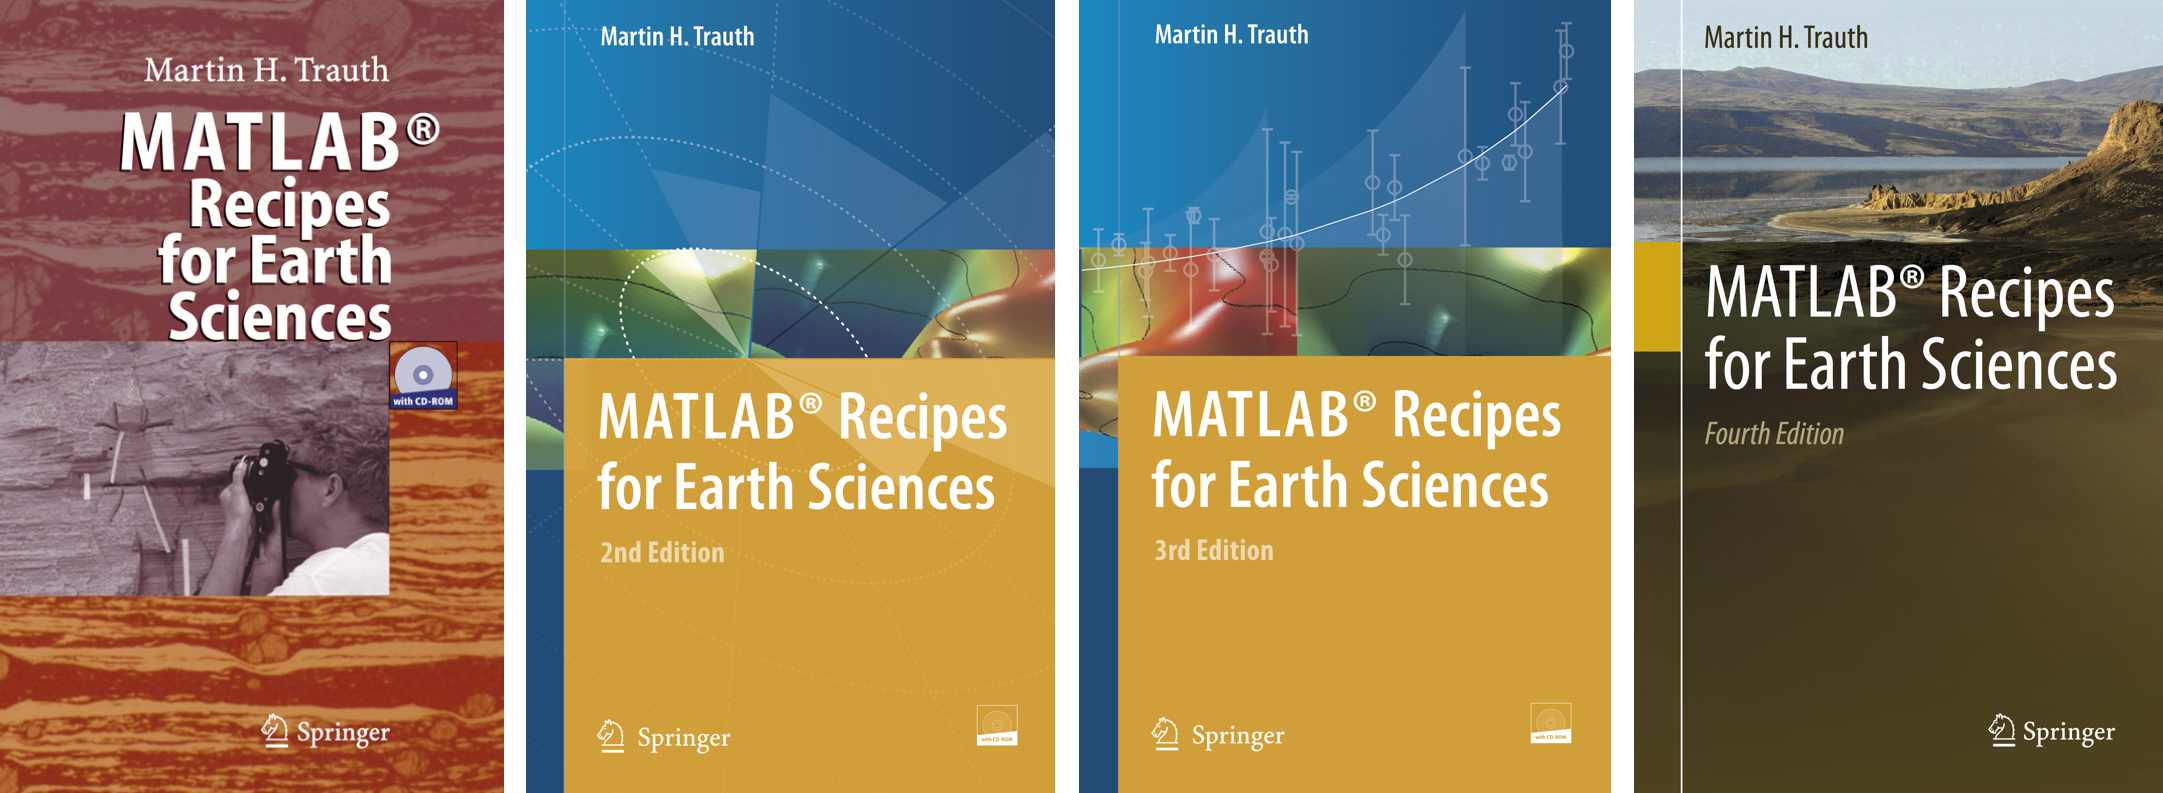
The success of the MRES book surprised me. Wolfgang Engel, the late editor of Springer, obviously had a good nose after we first met at the AGU conference in San Francisco in December 2004. Here is the story to the book.
Sample Size: How Many is Enough?
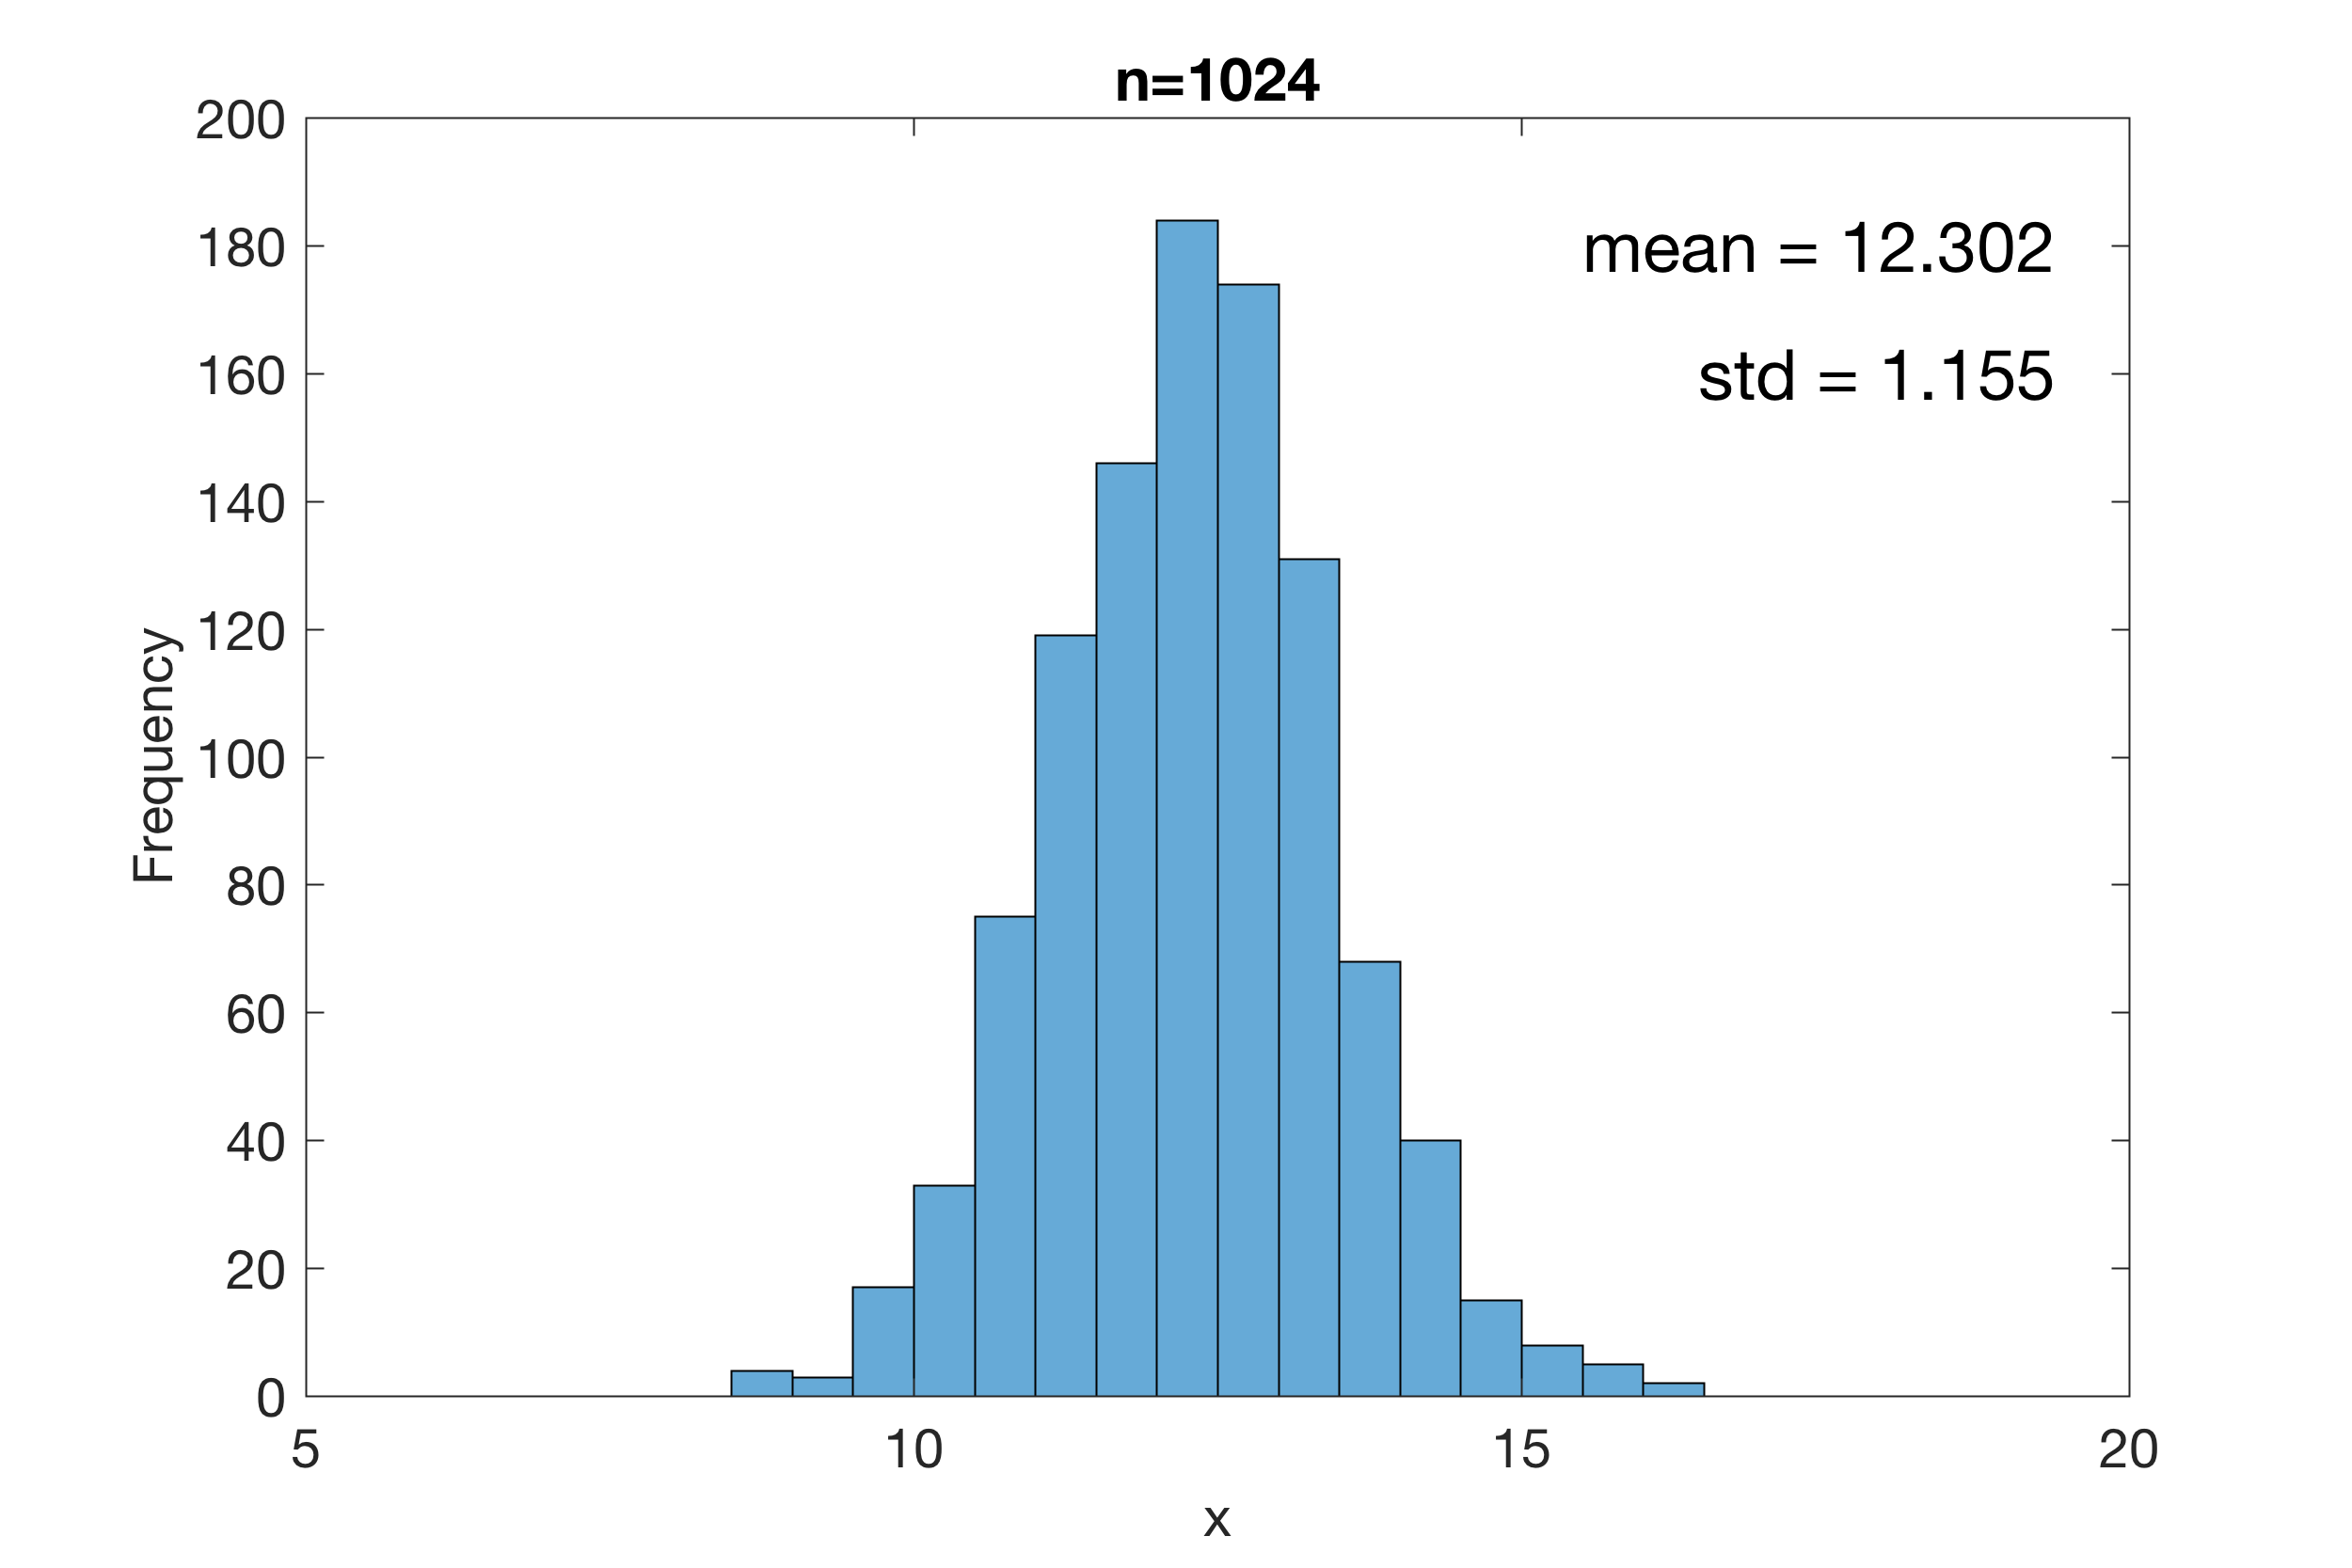
What is a good sample size? How many replicate measurements do we need to make inferences about a population from the sample? There are scientific articles on this subject, such as the one by H.W. Austin (1983), of which the title of the blog post is borrowed. There is no universal answer to this question. It depends very much on the studied phenomenon and the requirements on the results. Here is a nice example of how MATLAB helps to get a sense of the relationship between sample size and quality of the result.
MathWorks Supports Curriculum Development
![]() MathWorks supports the curriculum development of the MATLAB/LEGO MINDSTORMS Environmental Remote Sensing Lab by Martin H. Trauth, in collaboration with Jens Tronicke and Bodo Bookhagen. Sebastian Gross, Senior Education Technical Specialist of MathWorks, advises us on all matters involving the development of the new curriculum. The course for undergraduate and graduate students aims to improve their skills to build efficient teams to solve typical problems in earth sciences in acquiring, processing and analyzing typical multispectral, geophysical and geometric data. The progress of course development as well as course materials will be provided on this blog.
MathWorks supports the curriculum development of the MATLAB/LEGO MINDSTORMS Environmental Remote Sensing Lab by Martin H. Trauth, in collaboration with Jens Tronicke and Bodo Bookhagen. Sebastian Gross, Senior Education Technical Specialist of MathWorks, advises us on all matters involving the development of the new curriculum. The course for undergraduate and graduate students aims to improve their skills to build efficient teams to solve typical problems in earth sciences in acquiring, processing and analyzing typical multispectral, geophysical and geometric data. The progress of course development as well as course materials will be provided on this blog.
SERC Teaching Geoscience with MATLAB

Lisa Kempler, MATLAB Community Strategist at MathWorks, runs a great website at the Science Education Resource Center (SERC) at Carleton College, Northfield, Minnesota USA. The website provides a collection of geoscience-related MATLAB applications. Continue reading “SERC Teaching Geoscience with MATLAB”