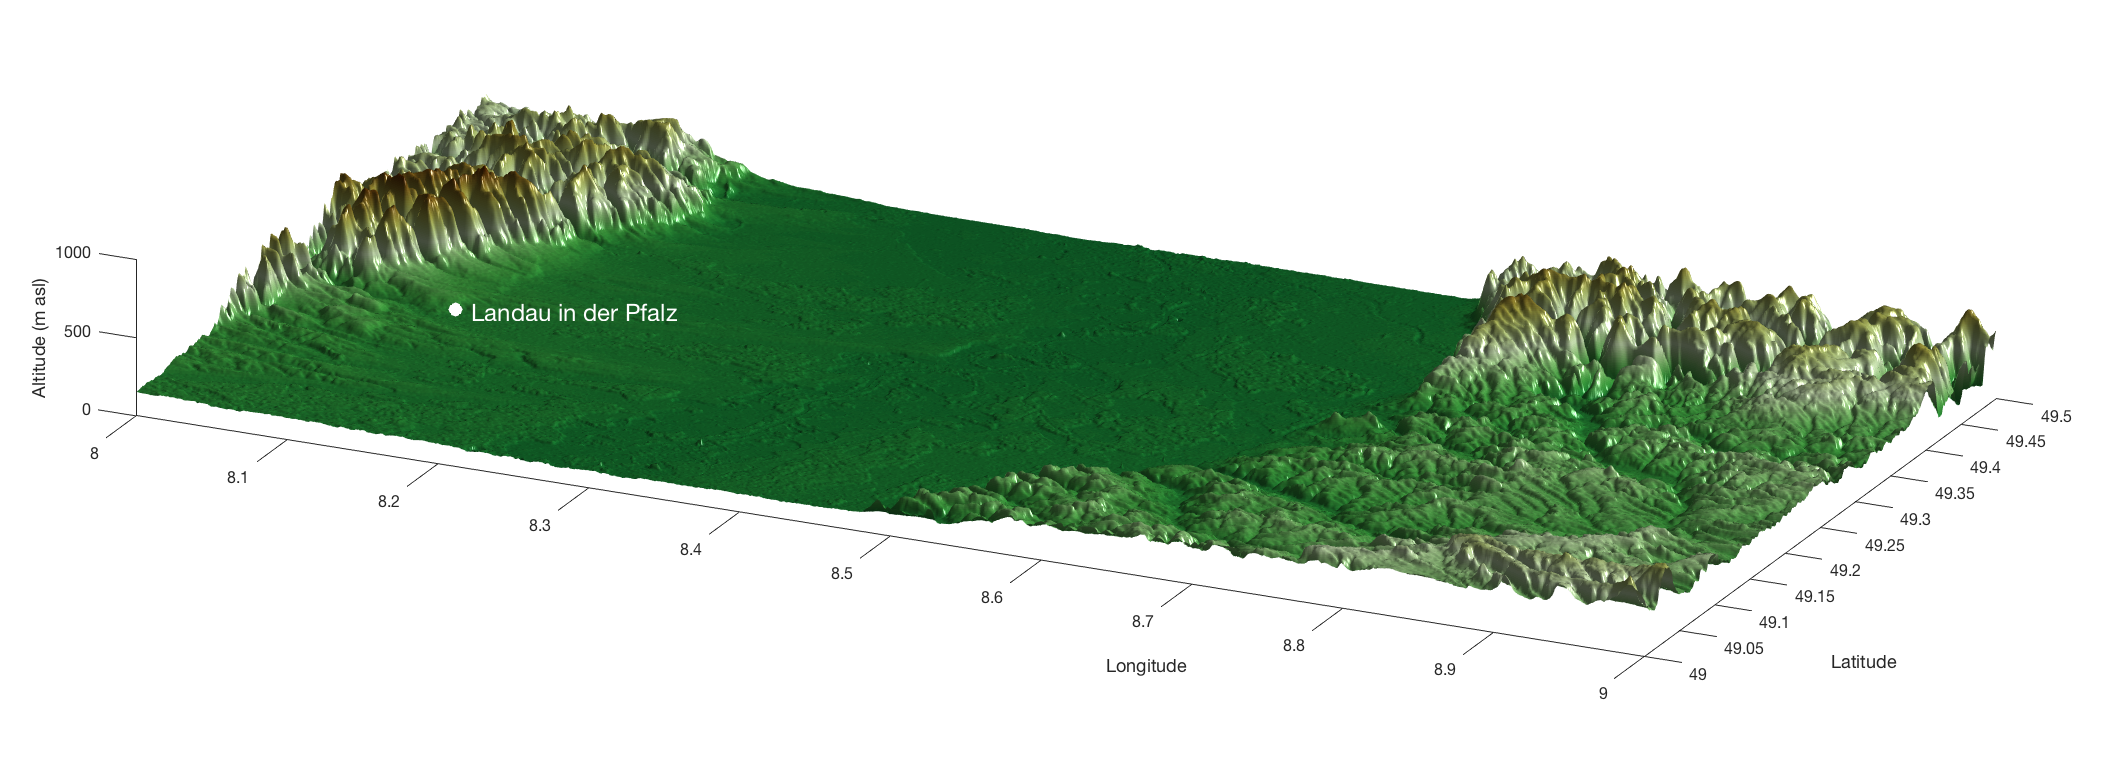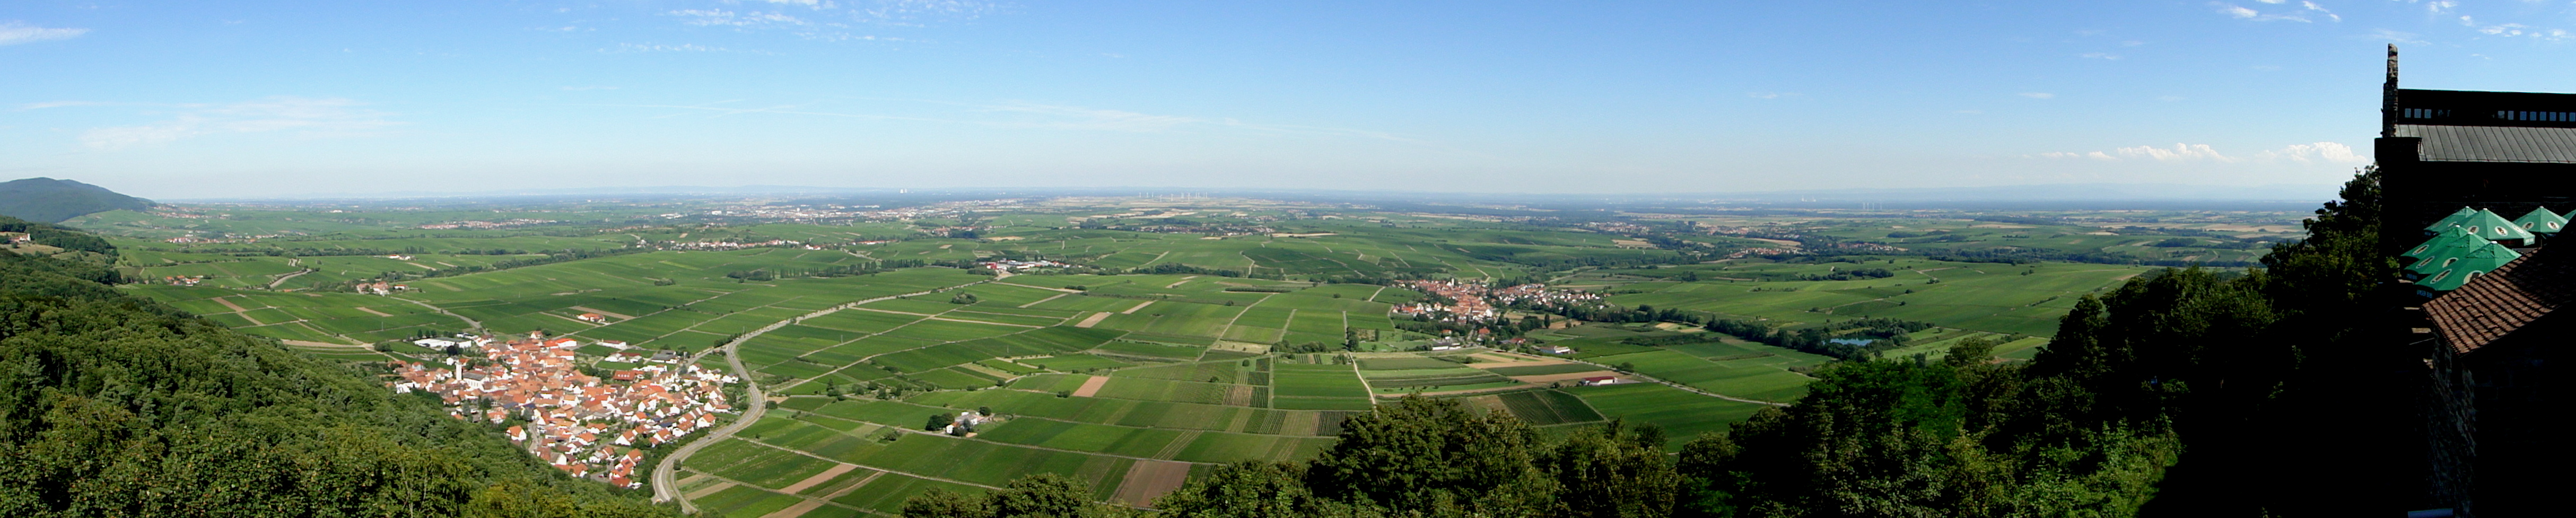
During our early summer vacation my family and I will spend a few days near Landau in der Pfalz, where I grew up many years ago. The place is a beautiful town located in the Rhine Rift, east of the Pfälzerwald (Palatinate Forest). Here is a MATLAB script to visualize part of the Rhine Rift, similar to the one used to display the digital elevation model of the Kenya Rift, whose exploration I have devoted most of my career to.
The free 1-arc minute Shuttle Radar Topography Mission (SRTM) data are very popular digital terrain models (DEM). Chapter 7.5 of the MRES book demonstrates how to import, process and display a single SRTM tile. We first load the data set N49E008.hgt as described in the MRES book:
clear, close all, clc
fid = fopen('N49E008.hgt','r');
SRTM = fread(fid,[1201,inf],'int16','b');
fclose(fid);
Next we transpose and flip the data sets up and down, before we replace the 16-bit signed integer no-data identifier -32768 by the MATLAB no-data identifier NaN (not-a-number).
SRTM = SRTM'; SRTM = flipud(SRTM);
SRTM(SRTM == -32768) = NaN;
A popular way to eliminate gaps in digital elevation models is by filling gaps with the arithmetic means of adjacent elements:
for i = 2 : 1200
    for j = 2 : 2400
        if isnan(SRTM(i,j)) == 1
            SRTM(i,j) = nanmean(nanmean(...
            SRTM(i-1:i+1,j-1:j+1)));
        end
    end
end
clear i j
Next we define a coordinate grid.
[LON,LAT] = meshgrid(8:1/1200:9,49:1/1200:50);
Here is the script of a beautiful display of the data. Please note the use of the function daspect to reduce the length of the z-axis.
figure1 = figure('Color',[1 1 1],...
    'Position',[50 50 1200 600]);
axes1 = axes('Units','centimeters',...
    'FontSize',8,...
    'YLim',[49 49.5]);
hold(axes1,'all');
surf1 = surf(LON,LAT,SRTM,...
    'SpecularExponent',20,...
    'FaceLighting','phong',...
    'FaceColor','interp',...
    'EdgeColor','none');
light1 = light('Parent',axes1,...
    'Style','local',...
    'Position',[145 70 900000]);
set(gca,'View',[25 20])
daspect([1 1 10000])
demcmap(SRTM)
plot3(8.118,49.2012,200,...
    'Marker','o',...
    'MarkerSize',6,...
    'MarkerEdgeColor','w',...
    'MarkerFaceColor','w')
text(8.118+0.01,49.2012,200,...
    'Landau in der Pfalz',...
    'Color','w',...
    'FontSize',12)
xlabel('Longitude')
ylabel('Latitude')
zlabel('Altitude (m asl)')