Today the 2nd Edition of MDRES was published at SpringerNature, now with the new title “Collecting, Processing and Presenting Geoscientific Information“. The book, with coauthor and designer Dipl.-Ing. (FH) Elisabeth Sillmann from BlaetterwaldDesign, aims at introducing students to searching relevant literature, reviewing and ranking published books and journal articles, extracting relevant information from the literature in the form of text, data, or graphs, searching and processing the relevant original data using MATLAB, and compiling and presenting the results as posters, abstracts, and oral presentations using graphics design software.
How to Stop Excel Automatically Changing Numbers to Dates
During the current MATLAB data analysis course, we discussed the safest way to import data into MATLAB. Like all the years before, I still recommend saving the data in ASCII format, checking it carefully and then importing the data into MATLAB – despite the availability of functions such as xlsread in MATLAB. Continue reading “How to Stop Excel Automatically Changing Numbers to Dates”
First Paper about the MATLAB/LEGO MINDSTORMS Practical Online!
Yesterday the first paper about the MATLAB/LEGO MINDSTORMS Practical was published online in the European Journal of Physics, “Classroom-sized geophysical experiments: magnetic surveying using modern smartphone devices”, by Jens Tronicke and Martin H. Trauth. Continue reading “First Paper about the MATLAB/LEGO MINDSTORMS Practical Online!”
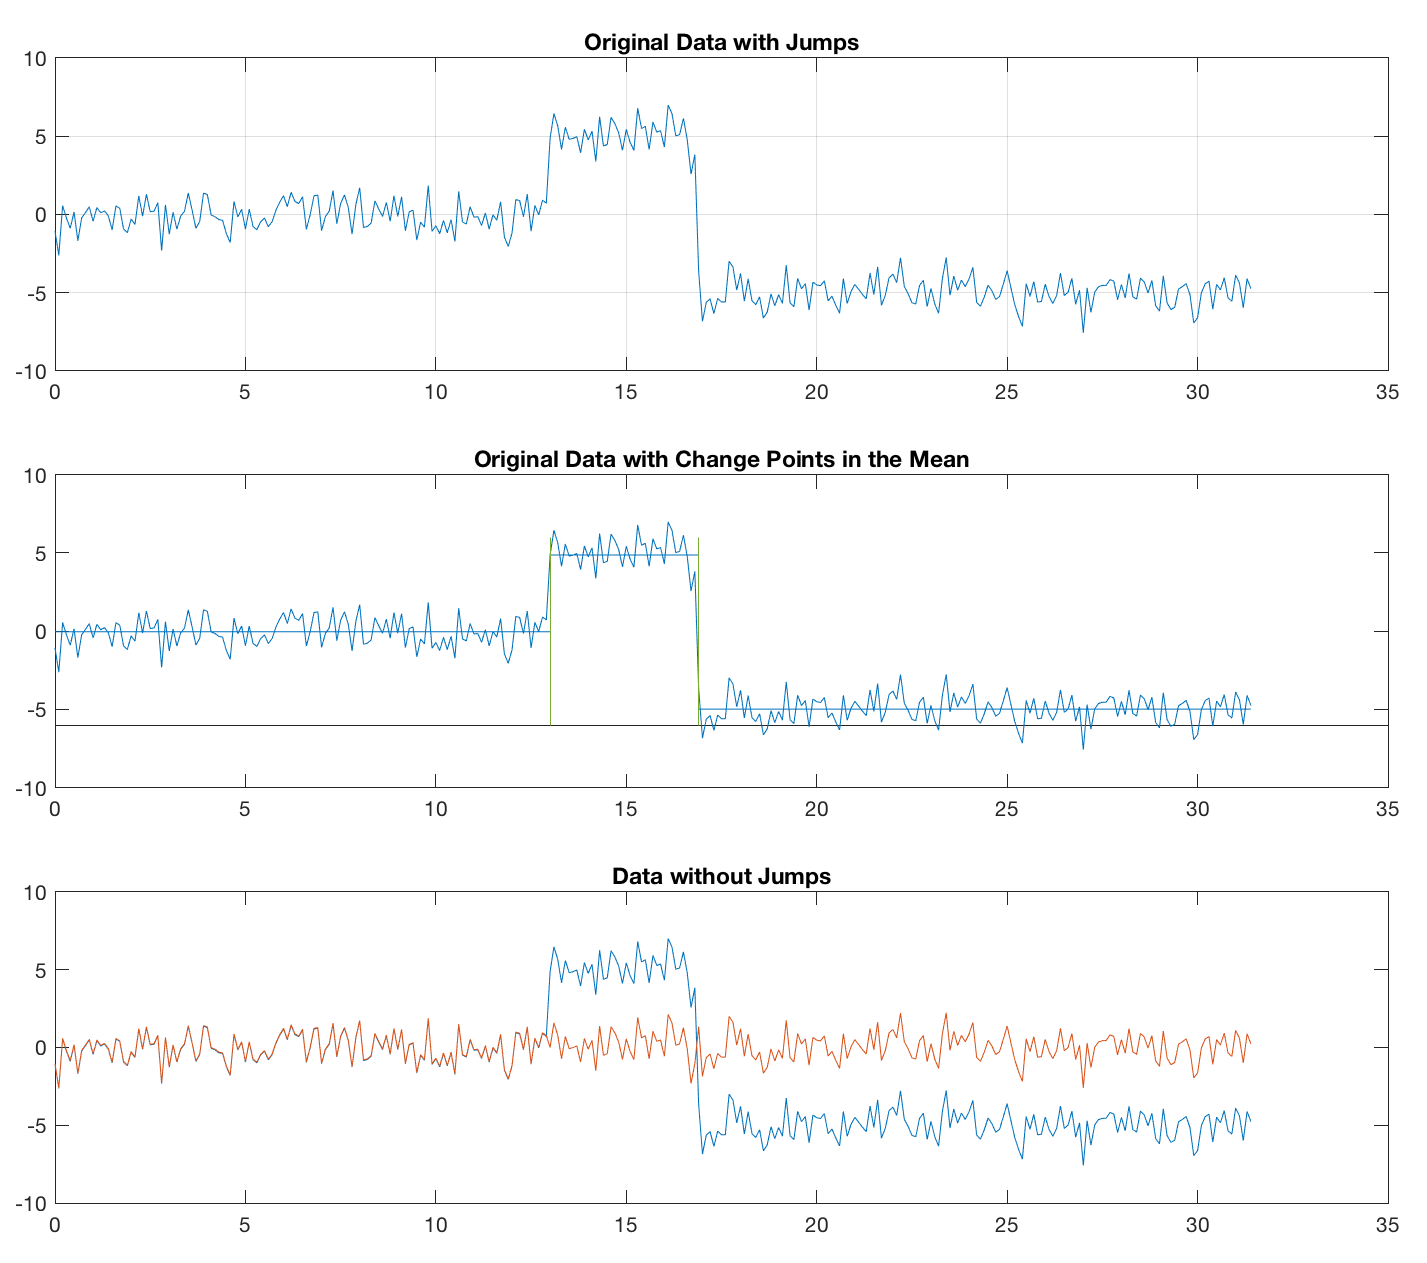
Removing Jumps in Time Series with MATLAB
The XRF data from our sediment cores from the Chew Bahir show dramatic jumps. If we analyze them statistically, the results will be affected by these changes in the mean. That’s why I was looking for ways to remove them. Here are two of these ways to remove jumps. Continue reading “Removing Jumps in Time Series with MATLAB”
MATLAB Experiment to Simulate Uncertainties of Differences
MATLAB is a great tool to simulate error propagation. As an example we will use the software to estimate the uncertainty in the difference between the measures of two quantities A and B, based on their individual uncertainties σA and σB. The experiment shows the error of differences in case the errors are either dependent or independent of each other.
Continue reading “MATLAB Experiment to Simulate Uncertainties of Differences”
Open source, open access, open everything – but there is no free lunch!
Next week, according to the information of Springer-Nature, the proofs of the second edition of “MATLAB and Design Recipes for Earth Sciences” (MDRES) will arrive on my desk, now with a new title “Collecting, Processing and Presenting Geoscientific Information” and the old title as the subtitle. According to Springer-Nature, the Hardcover book will cost € 90.94, the eBook € 71.39. This is of course a lot of money, especially for students who need not only this, but many other books to study.
Continue reading “Open source, open access, open everything – but there is no free lunch!”
MATLAB and Design Recipes for Earth Sciences, 2nd Edition
The 2nd edition of “MATLAB and Design Recipes for Earth Sciences” comes with a new title, to be published in March 2018! Continue reading “MATLAB and Design Recipes for Earth Sciences, 2nd Edition”
Thermal Imaging with the Seek CompactPro and MATLAB
This exercise will show students how to capture thermal images, export them, import them to MATLAB, and calculate temperature readings. The Seek CompactPro does not allow the export of raw data, but only the images. Nevertheless, with a linear color palette it is possible to calculate and display quite good temperature values.


