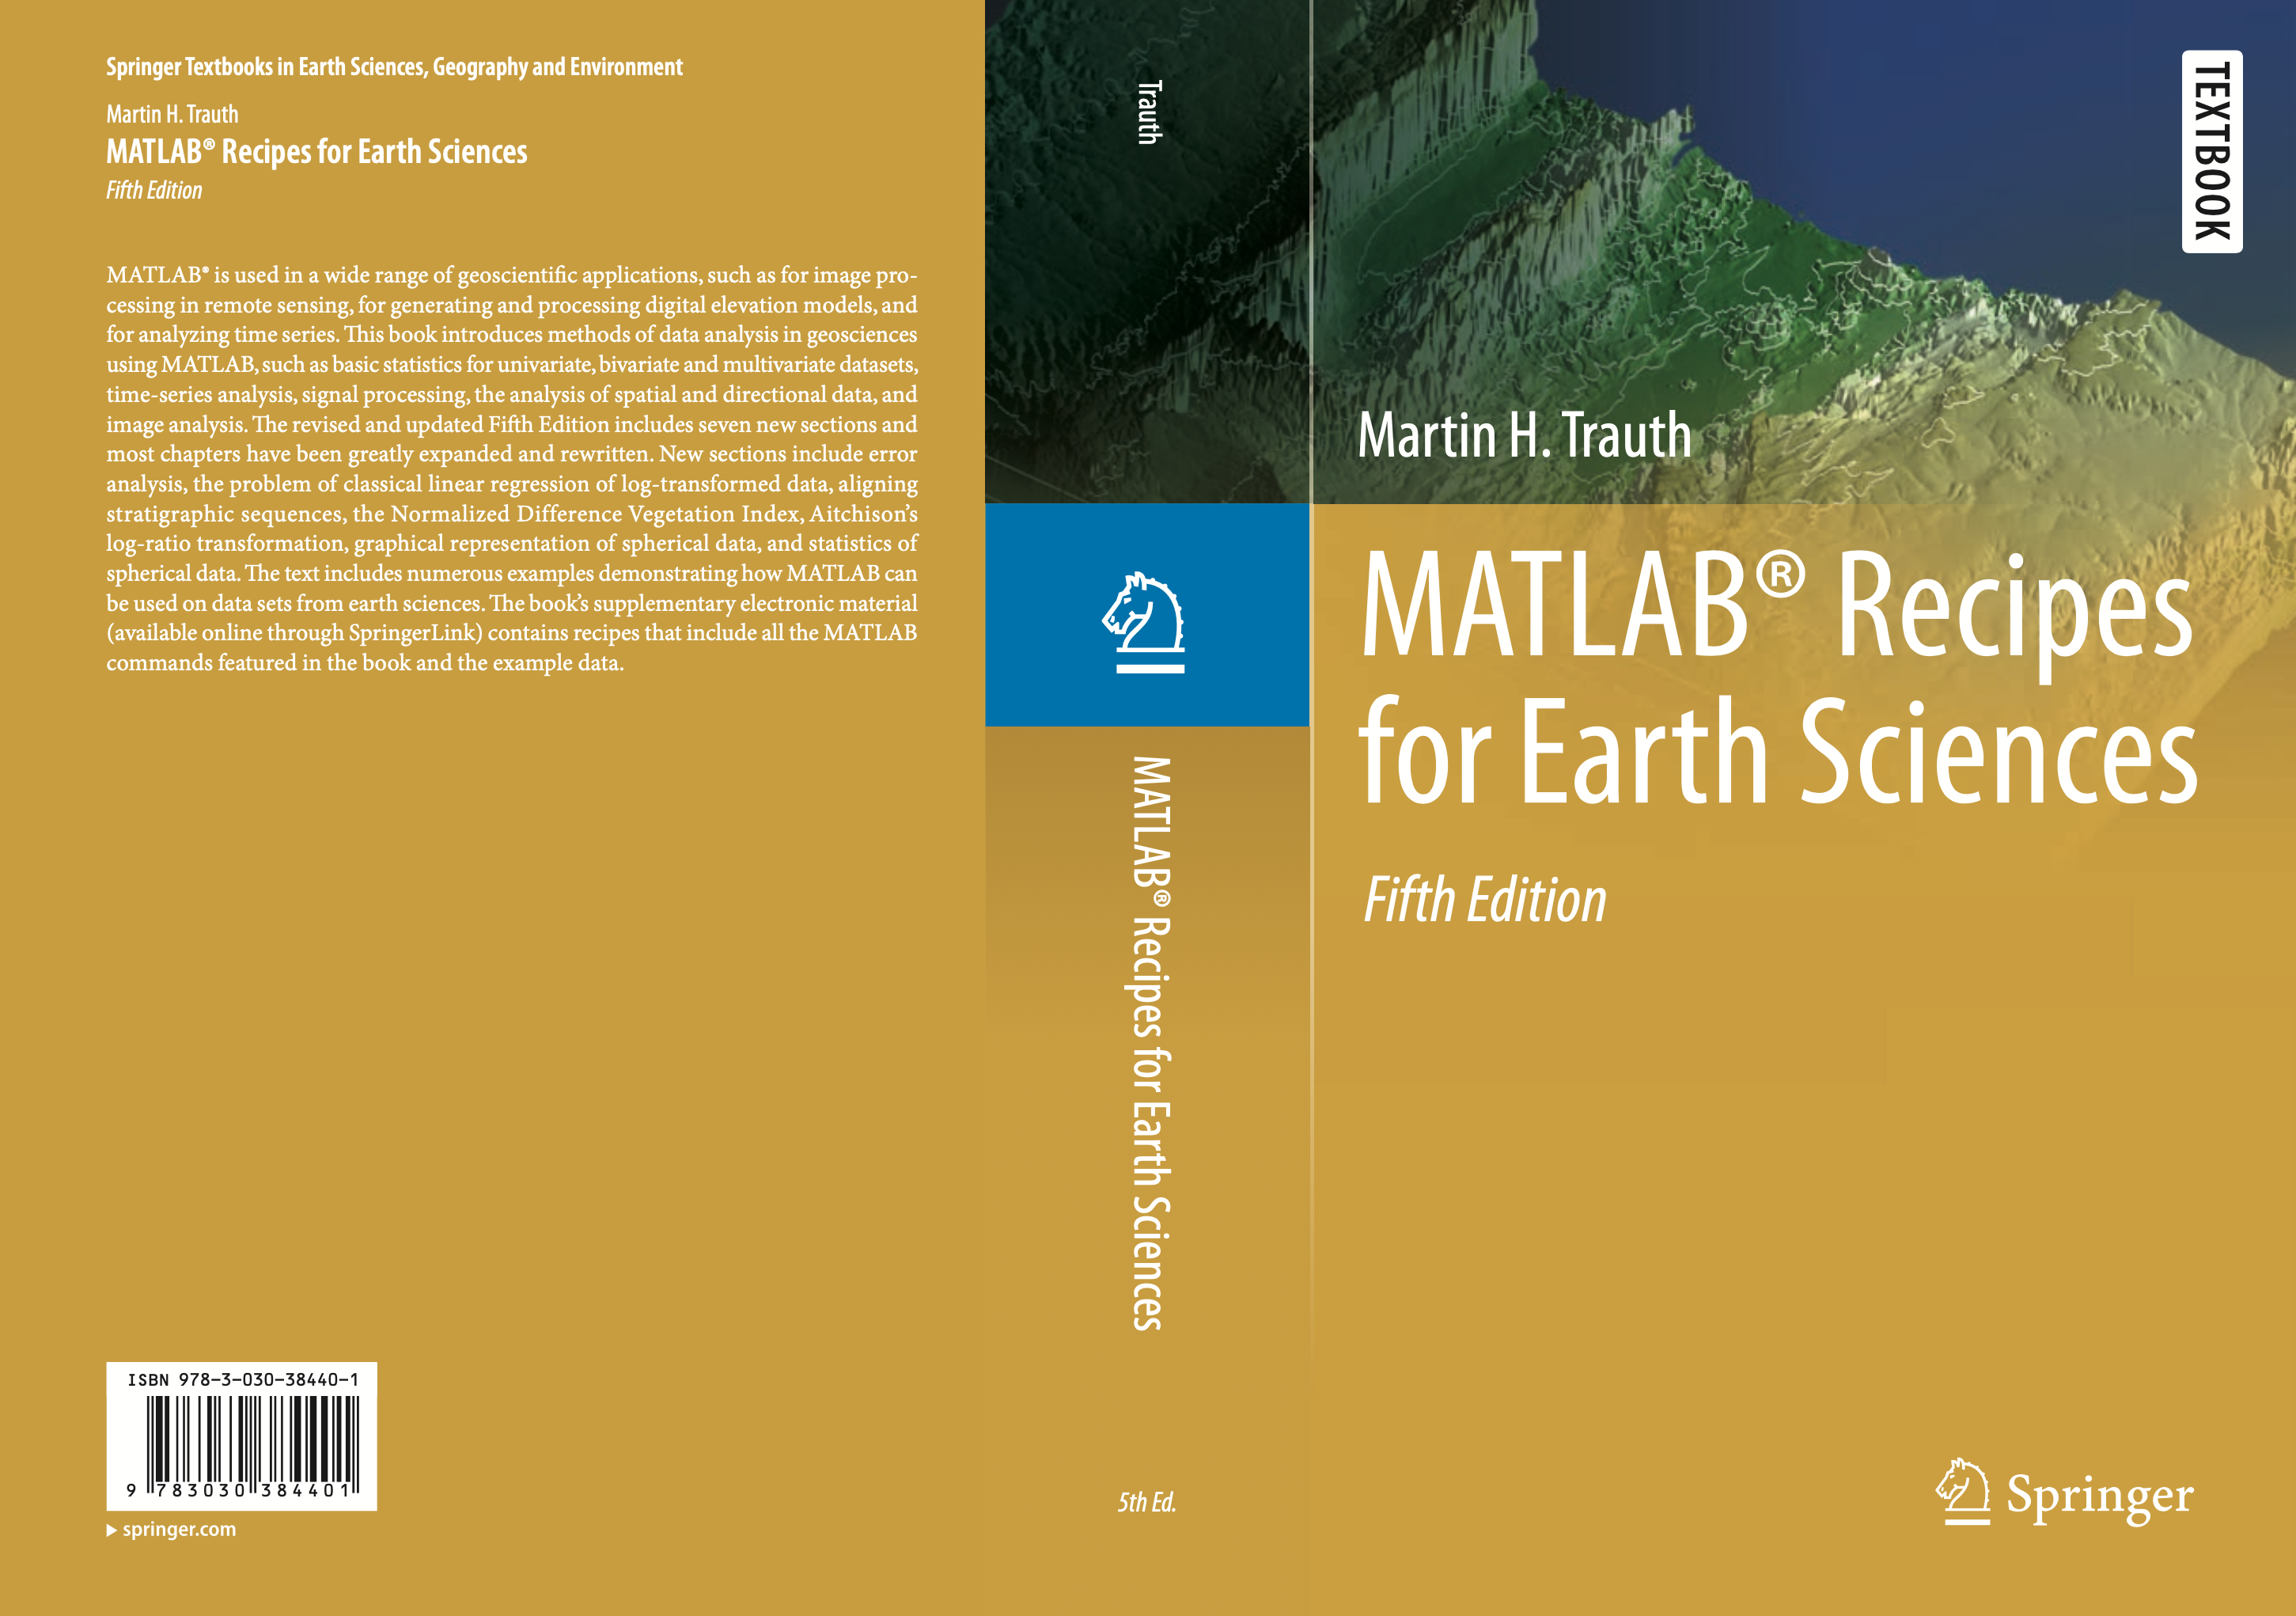
The 5th edition of MATLAB Recipes for Earth Sciences now has a book cover and can already be pre-ordered on the publisher’s webpage. The picture on the top is a 3D display of a filtered SRTM elevation data set of the Baringo area in Kenya, showing fault escarpments and lake basins. The function surfl has been used to generate a shaded-relief map with simulated lighting, contour3 to create white elevation contours and the demcmap colormap from the Mapping Toolbox.
Create Publishable Graphics with MATLAB, Part 2
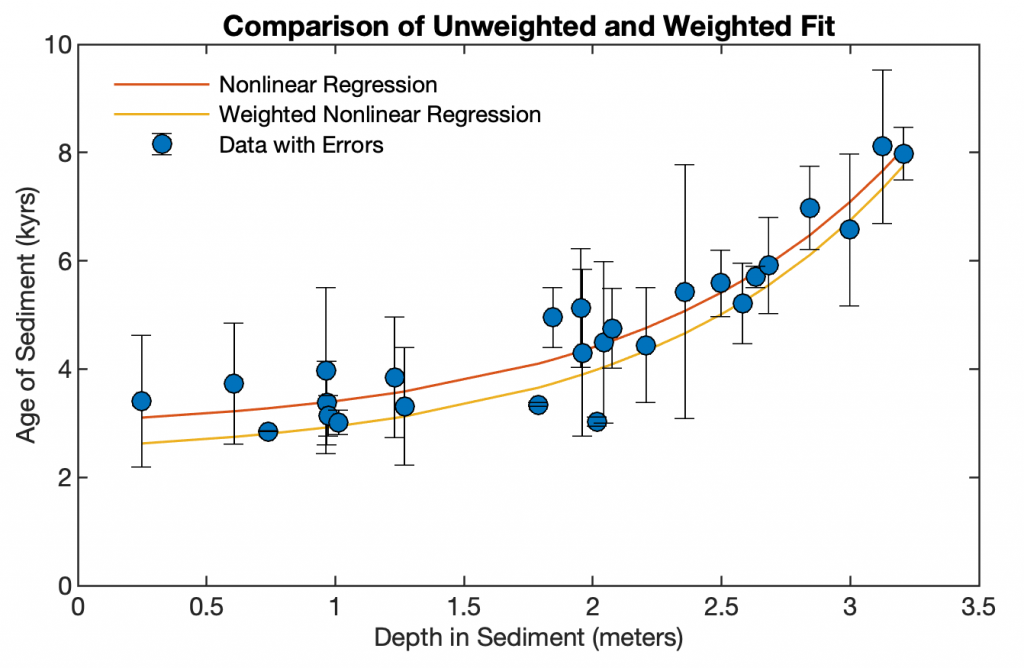
There is disagreement among scientists as to whether graphics should be presented in an attractive design or whether the standard design of the statistical software is sufficient. Here is a comparison of a graphic as generated by MATLAB with an improved design. Continue reading “Create Publishable Graphics with MATLAB, Part 2”
Dip and Dip Direction using Smartphones
The following exercise is intended to help to understand the measurement of the orientation of linear and planar structures in the field, using the magnetometer and the gyroscope of the smartphone. We will carry out a large number of repeated measurement, not possible with a traditional compass in a reasonable time. These repeated measurements will be statistically evaluated and interpreted with regard to their accuracy and precision.
48th and 49th Shortcourse on MRES in Potsdam
The spring courses on MATLAB Recipes for Earth Sciences in Potsdam will be held on 17–21 Februar 2020 (in English language) and 30 March–3 April 2020 (in German language). Continue reading “48th and 49th Shortcourse on MRES in Potsdam”
MatCal: Open Source Bayesian 14C Age Calibration in MATLAB
 In the MDRES book I promote the CALIB software for cabrating radiocarbon (14C) dates. Today I received a nice message from Bryan Lougheed at Uppsala University. He, together with coauthor Stephen Obrochta, developed a MATLAB-based Bayesian age calibration function to calibrate 14C ages. Continue reading “MatCal: Open Source Bayesian 14C Age Calibration in MATLAB”
Public Lecture during the University of Potsdam Children’s University
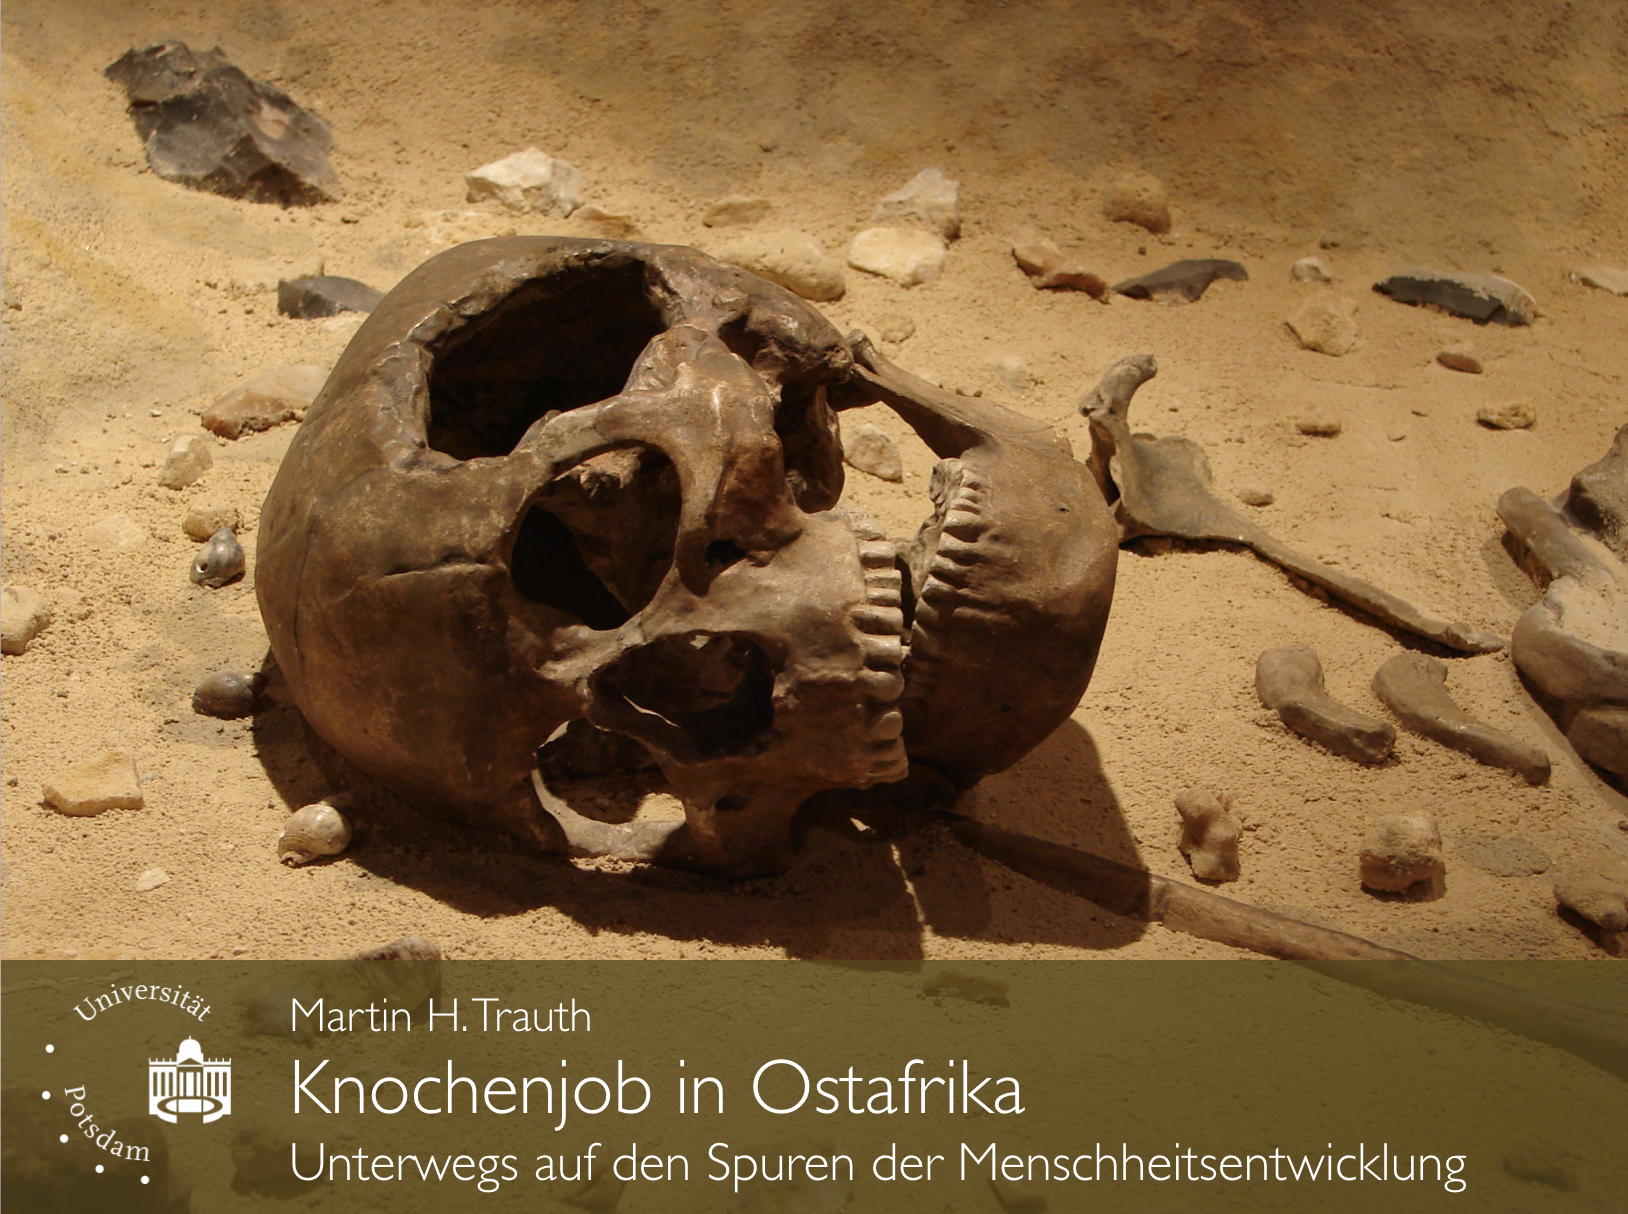
On 27 September 2019 the University of Potsdam will once again open its lecture halls for 8–11 year old children in order to inspire them for the world of science. During the event I will teach a lecture on “Knochenjob in Ostafrika – unterwegs auf den Spuren der ersten Menschen” during the Children’s University Potsdam.
Fifth Chew Bahir Drilling Project Workshop at Neanderthal Museum
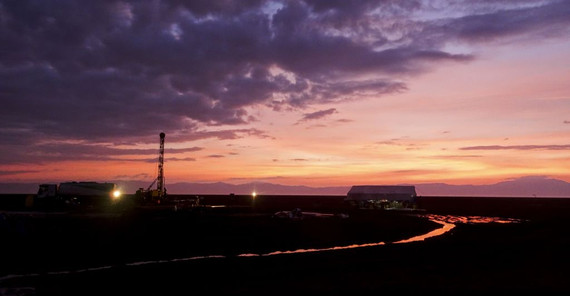
Next week scientists from the Chew Bahir project will meet at the Neanderthal Museum near Düsseldorf to discuss the latest results of the 290 m long ICDP cores from S Ethiopia. The project, as part of the international Hominin Sites and Paleolaces Drilling Projects (HSPDP), tries to fill gaps in the environmental history of eastern Africa, the habitat of early human ancestry. Within the framework of the project, two ~290 m long cores were collected in the Chew Bahir Basin in Southern Ethiopia including the last ~550,000 year history of environmental change in the southern Ethiopian rift were some of the oldest fossils of our own species were discovered. The latest results from analyzing these cores will be discussed during the workshop.

