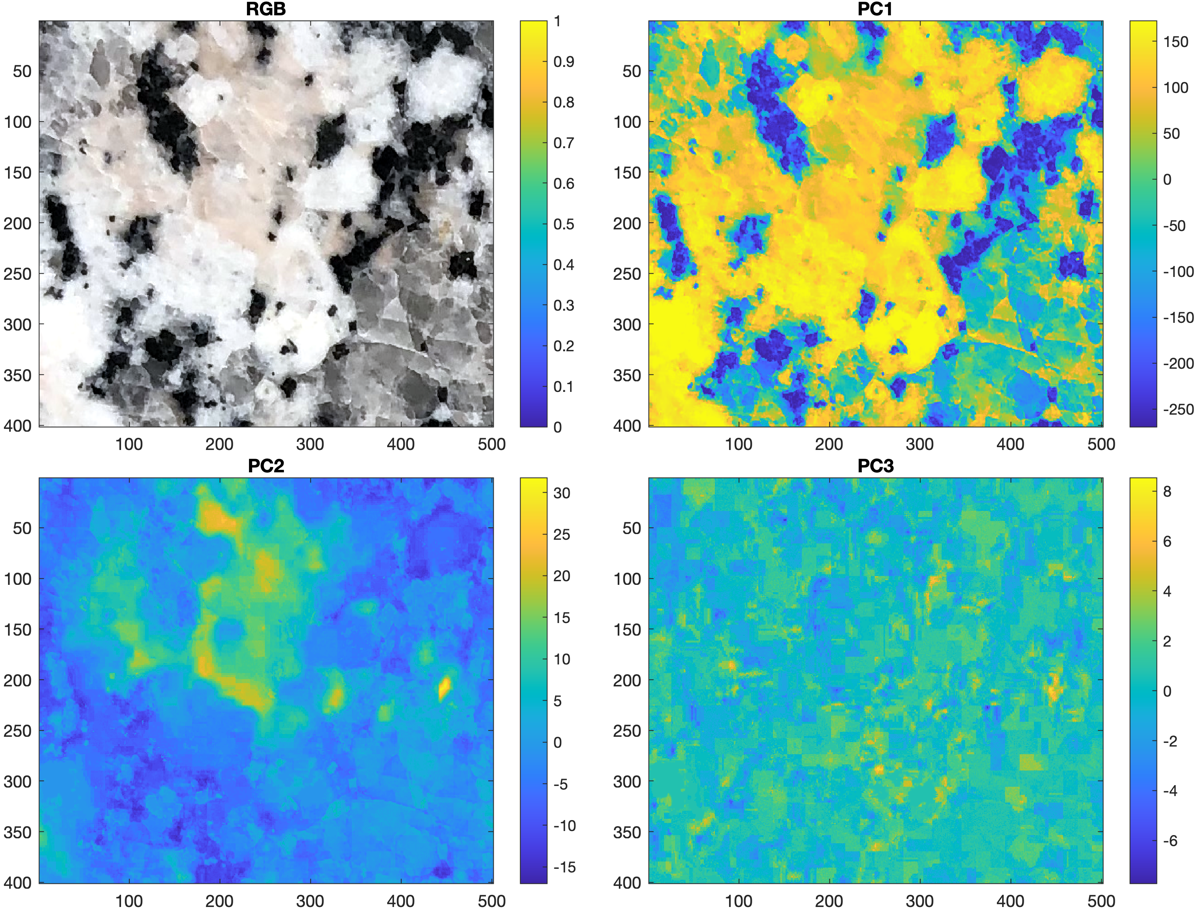
Color is an uncertain characteristic for the determination of minerals. Many minerals occur in a variety of different colors. Examples are quartz with its color variants amethyst, rose quartz or smoky quartz or feldspar with color variants like amazonite. However, if the minerals in a rock are reliably determined, their different coloring can be used to quantify them. In this example we use a simple RGB photo taken with a smartphone to determine the amounts of quartz, plagioclase, alkali feldspar and dark minerals such as biotite and hornblende in granite. To facilitate the differentiation of minerals, we use a principal component analysis (PCA), which is also used to unmix and classify spectral images such as satellite images (Trauth, 2020).
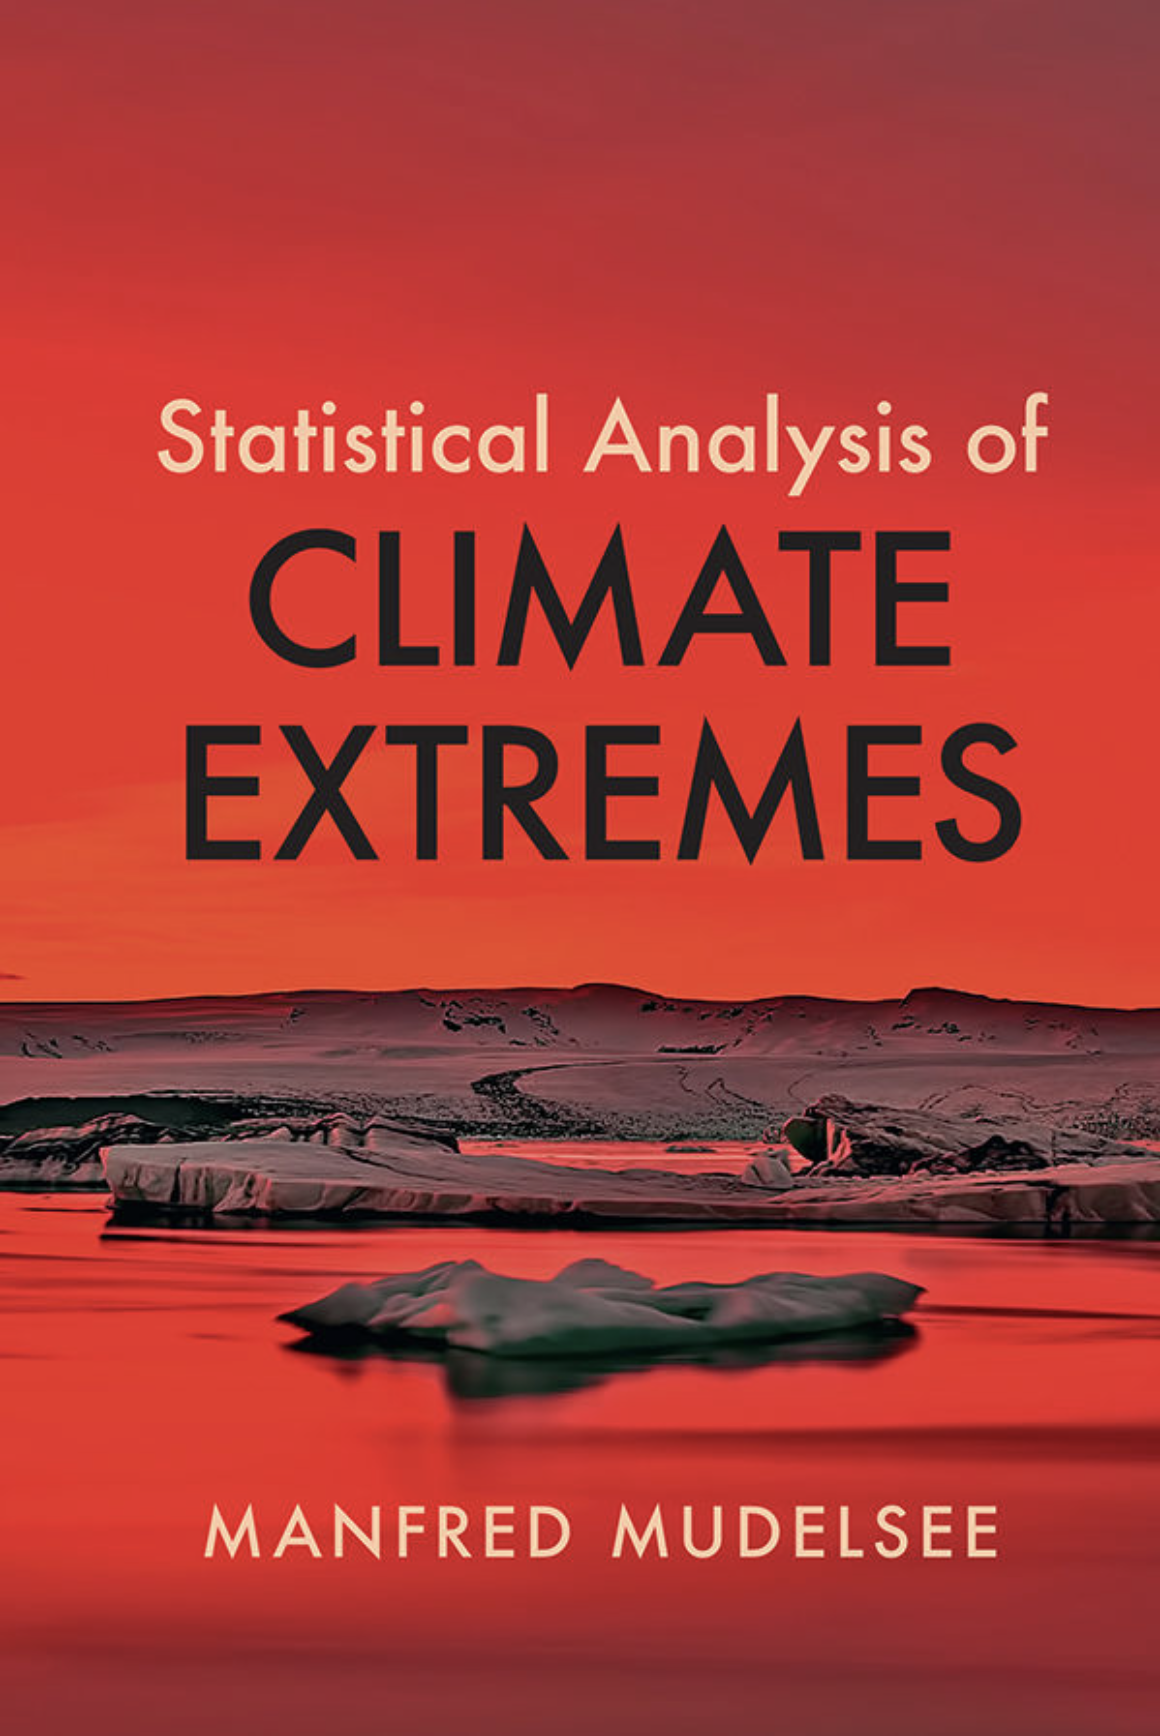
A New Book on Climate Extremes by Manfred Mudelsee
My colleague and friend Manfred Mudelsee has just published a remarkable book on the statistical analysis of climate extremes with Cambridge University Press. It is Manfred’s second book, after his very successful book on climate time series analysis (Springer, 2nd Edition, 2014). Continue reading “A New Book on Climate Extremes by Manfred Mudelsee”
50th and 51st Shortcourse on MRES – Interactive Online Seminars
During the worldwide SARS-CoV-2 pandemic, teaching at universities changed fundamentally within a few days. This also has an impact on the traditional MRES compact courses, which are now offered entirely online! The interactive online seminar on MATLAB Recipes for Earth Sciences will be held on 14–18 September 2020 (in English language) and 28 September–2 October 2020 (in German language).
Continue reading “50th and 51st Shortcourse on MRES – Interactive Online Seminars”
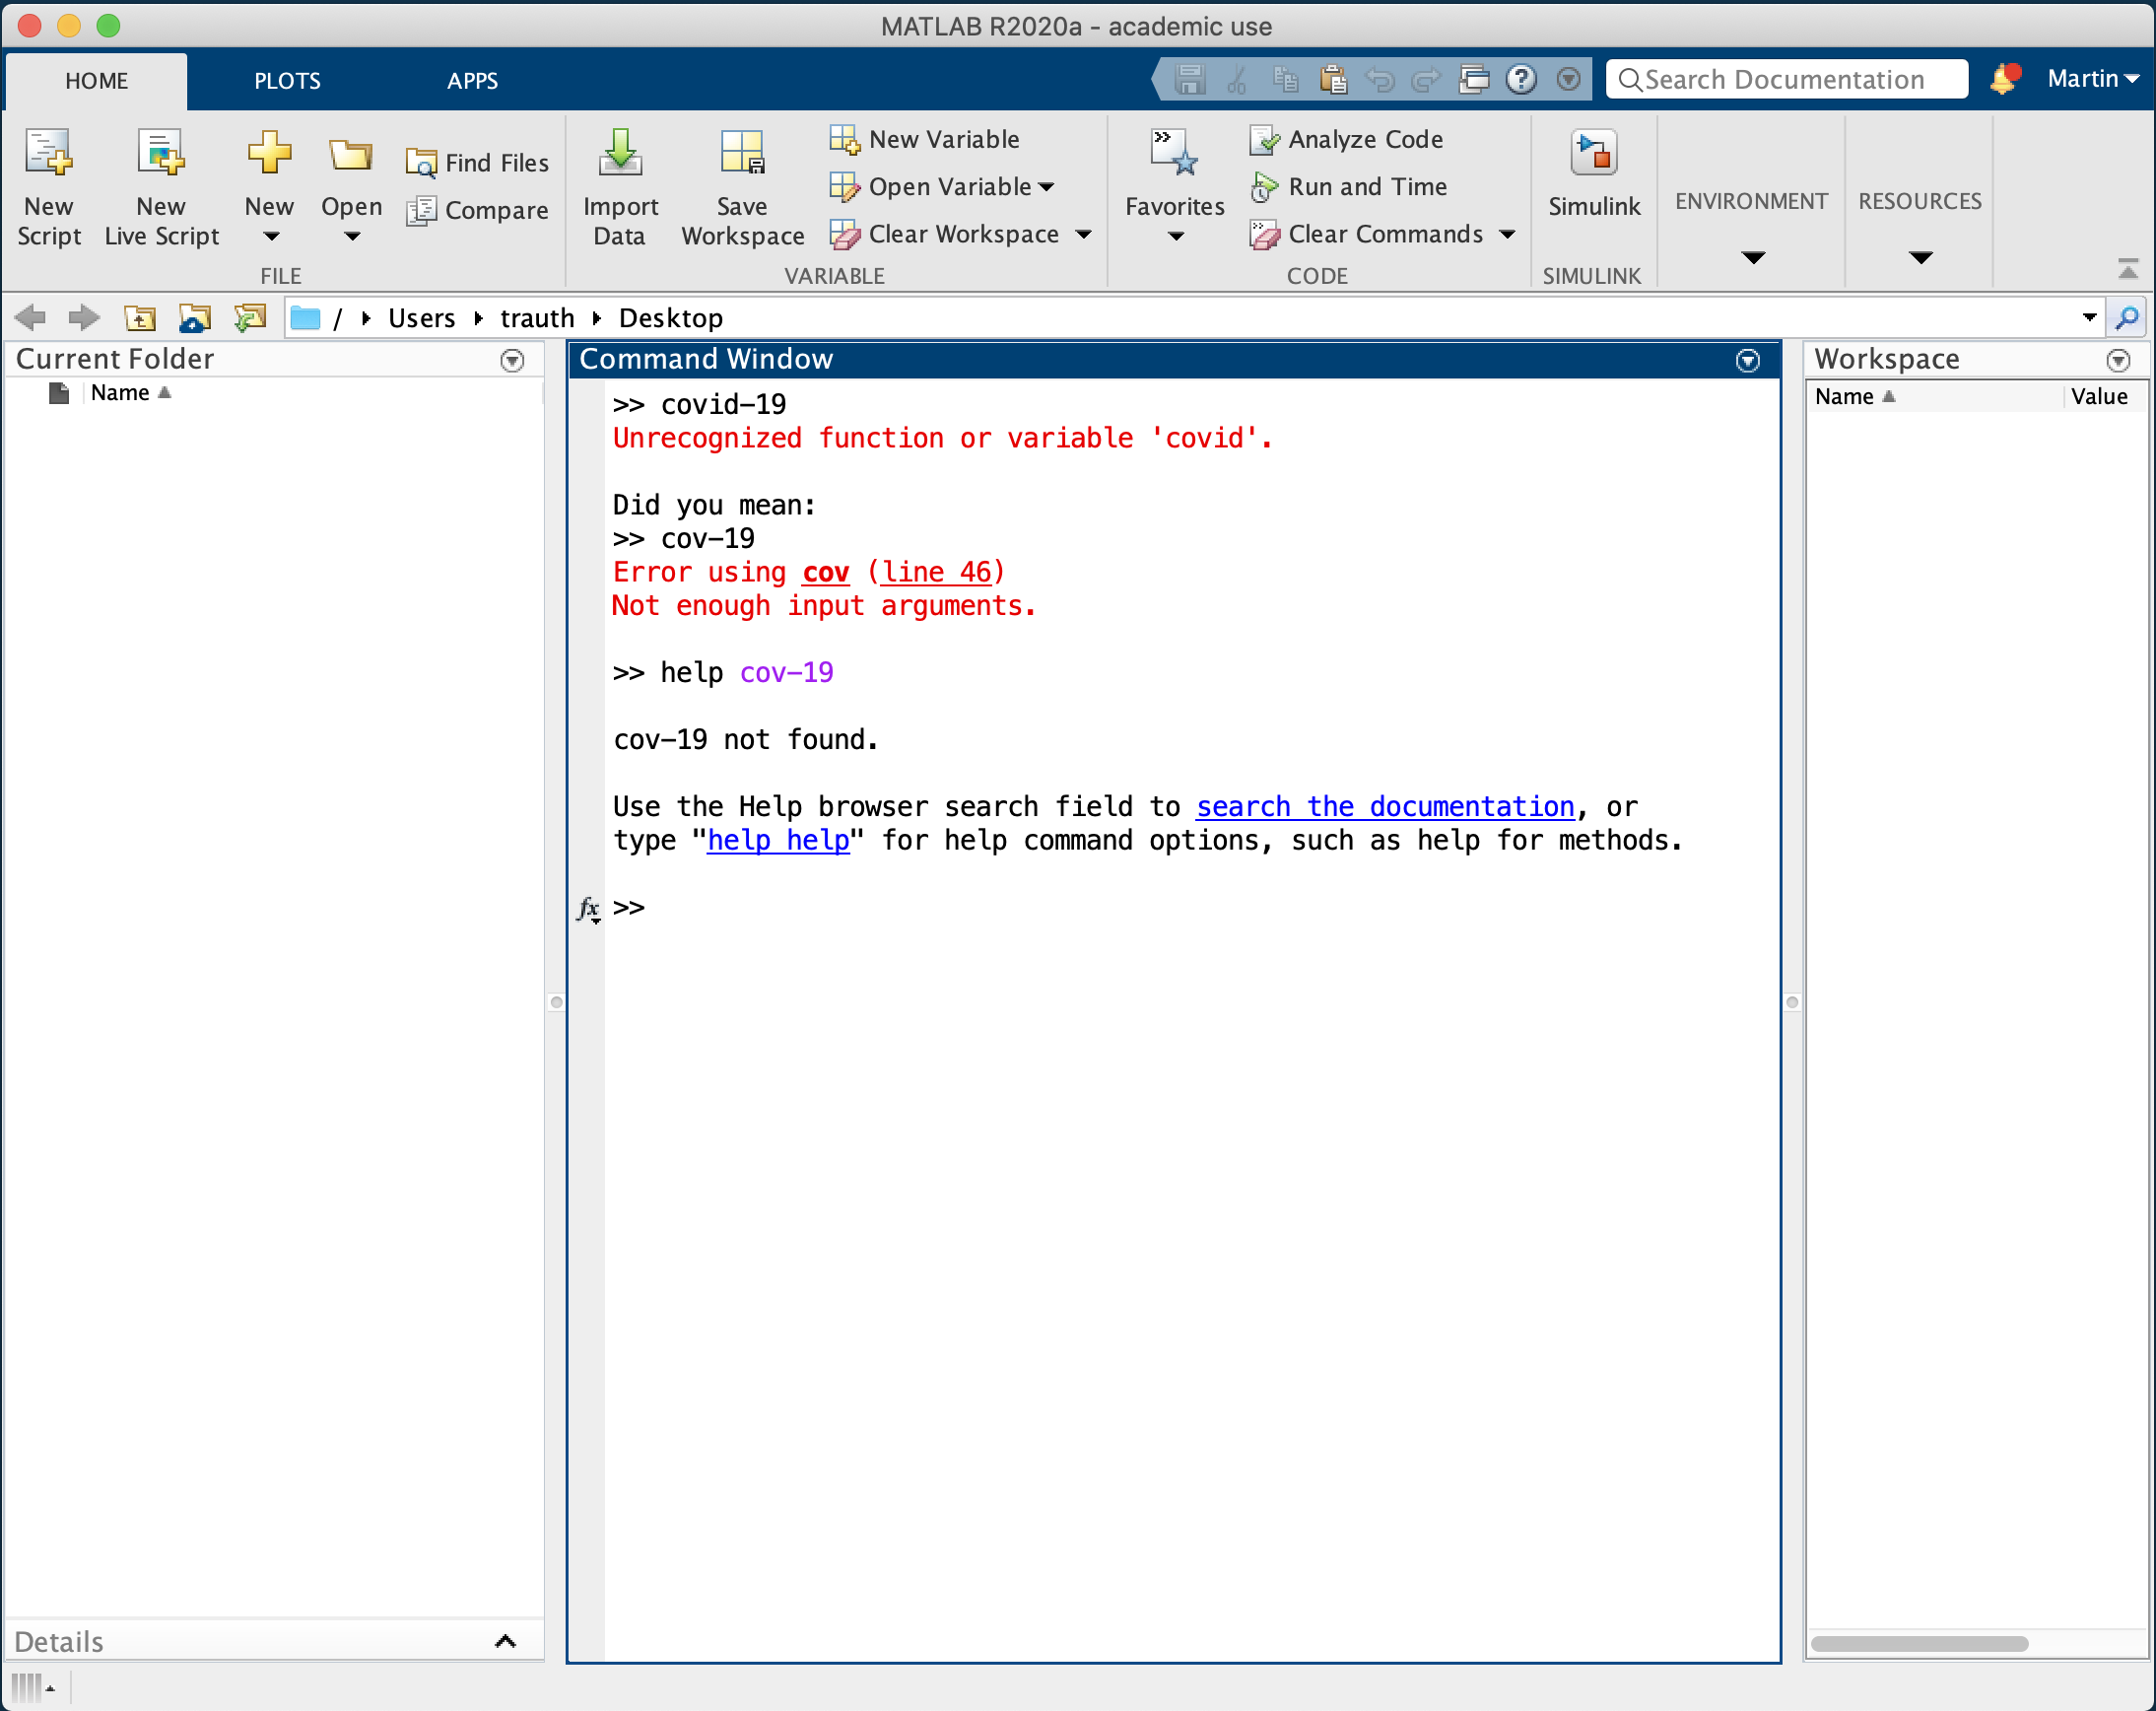
Teaching Data Analysis with MATLAB in COVID-19 Times
During the worldwide Sars-COV-2 pandemic, teaching in schools and universities changed fundamentally within a few days. Here are first experiences in teaching and learning with MATLAB. Continue reading “Teaching Data Analysis with MATLAB in COVID-19 Times”
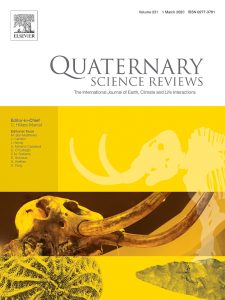
QSR Virtual Special Issue on Time Series Analysis for Earth, Climate and Life Interactions
I am pleased to announce a Quaternary Science Reviews virtual special issue on “Time Series Analysis for Earth, Climate and Life Interactions“. The VSI will contain overview articles on the currently used and new methods of time series analysis as well as application examples from the field of earth, climate and life. Interested authors of articles on the topic may contact me via email. Continue reading “QSR Virtual Special Issue on Time Series Analysis for Earth, Climate and Life Interactions”
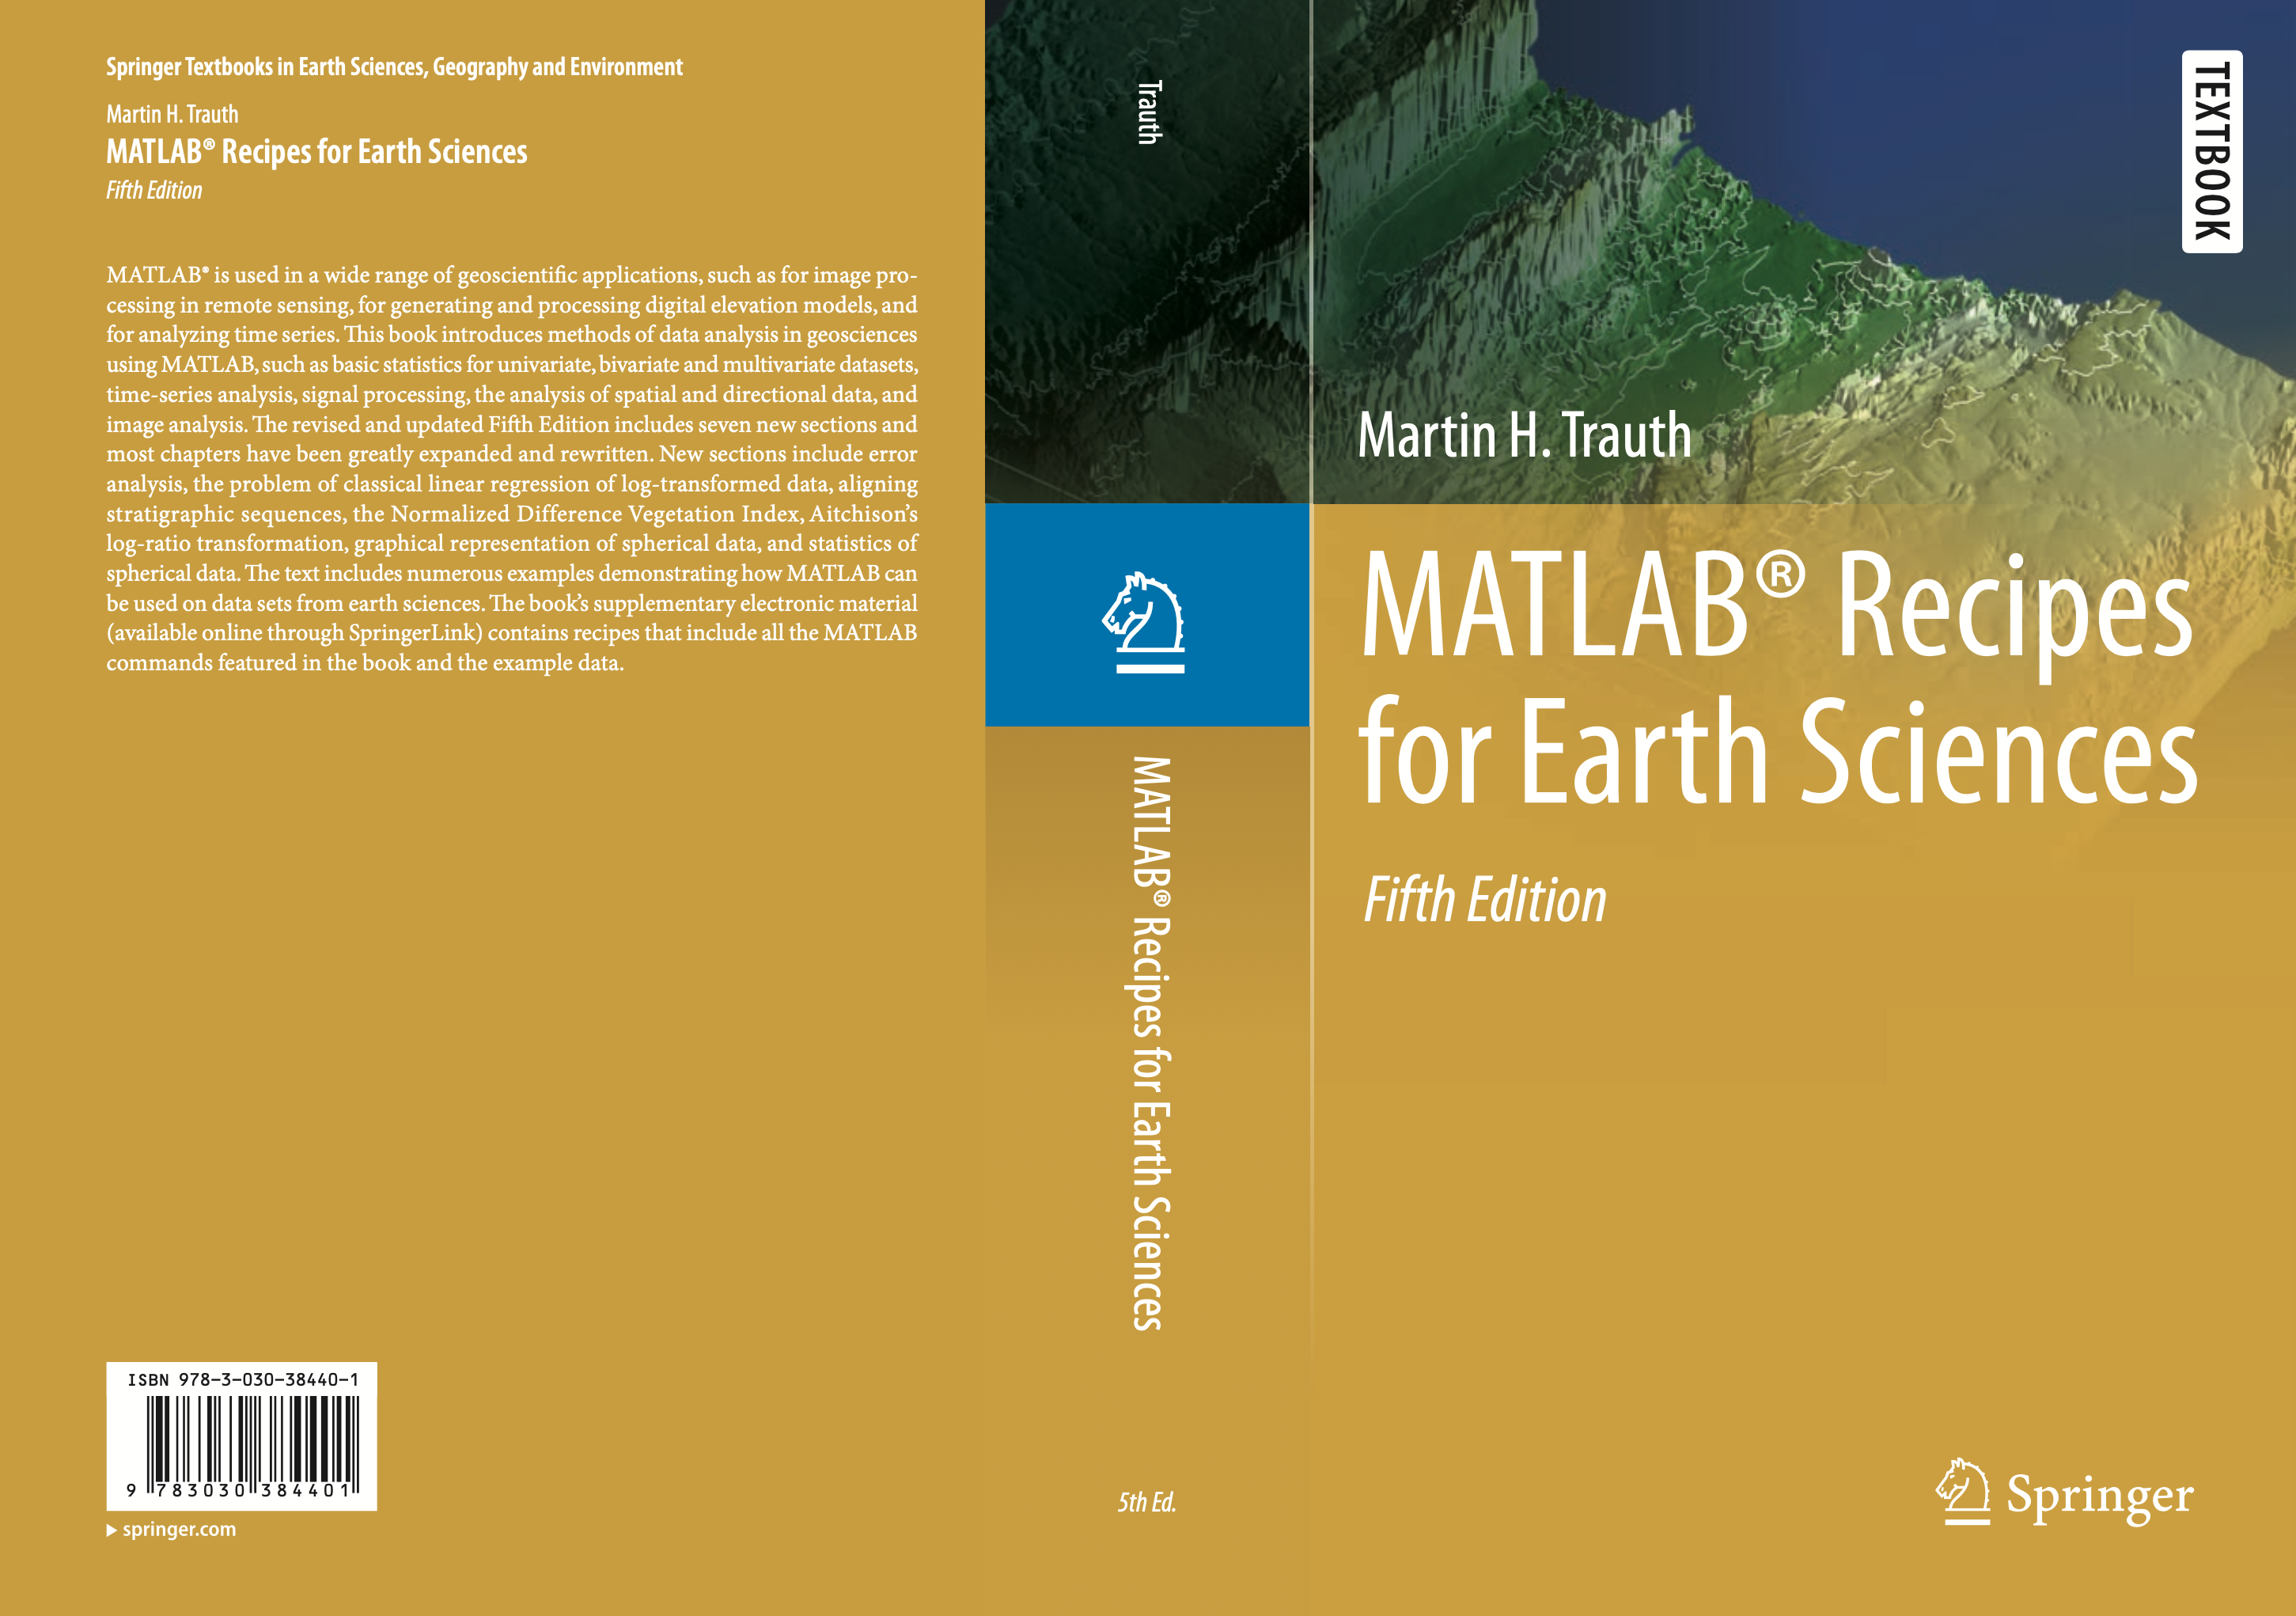
The Story of the MRES Book, Editions 1–5
Shortly after this blog went online, I wrote down a short history of the MRES book. Here is an update, just before the 5th edition is published. The book has become heavy, it has twice the number of pages as the first edition! Continue reading “The Story of the MRES Book, Editions 1–5”
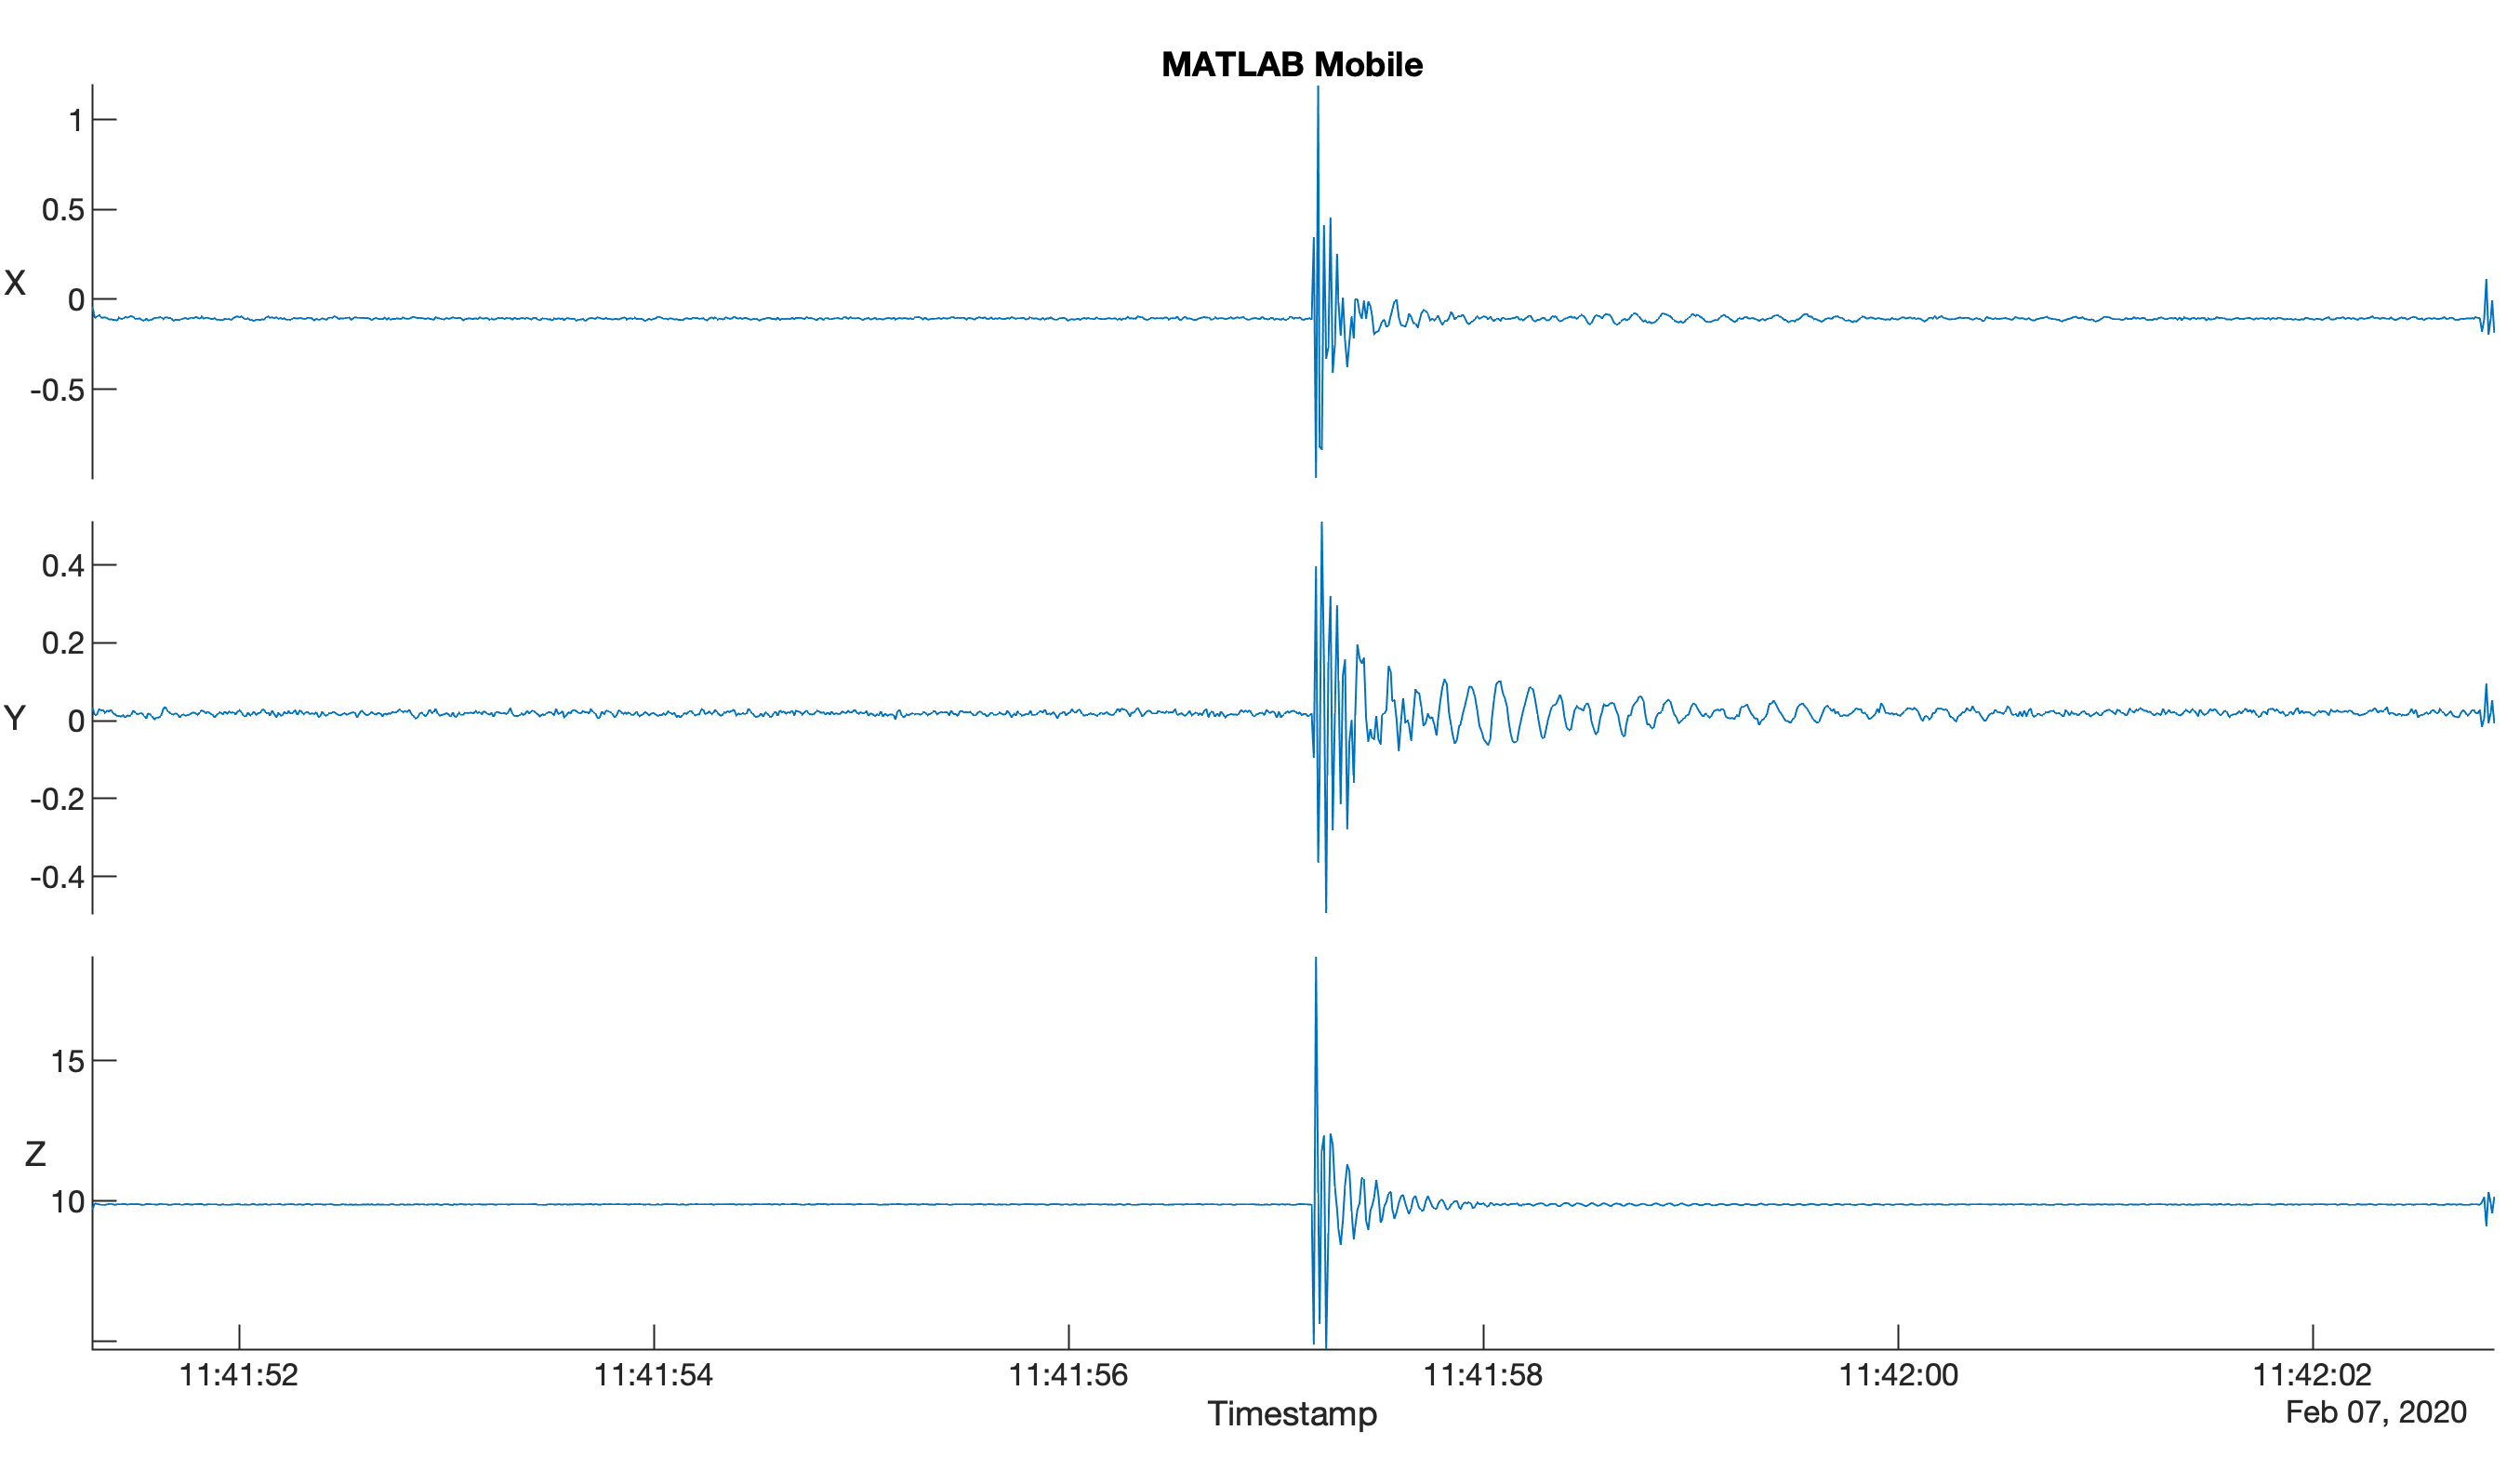
Smartphone Seismometer using MATLAB
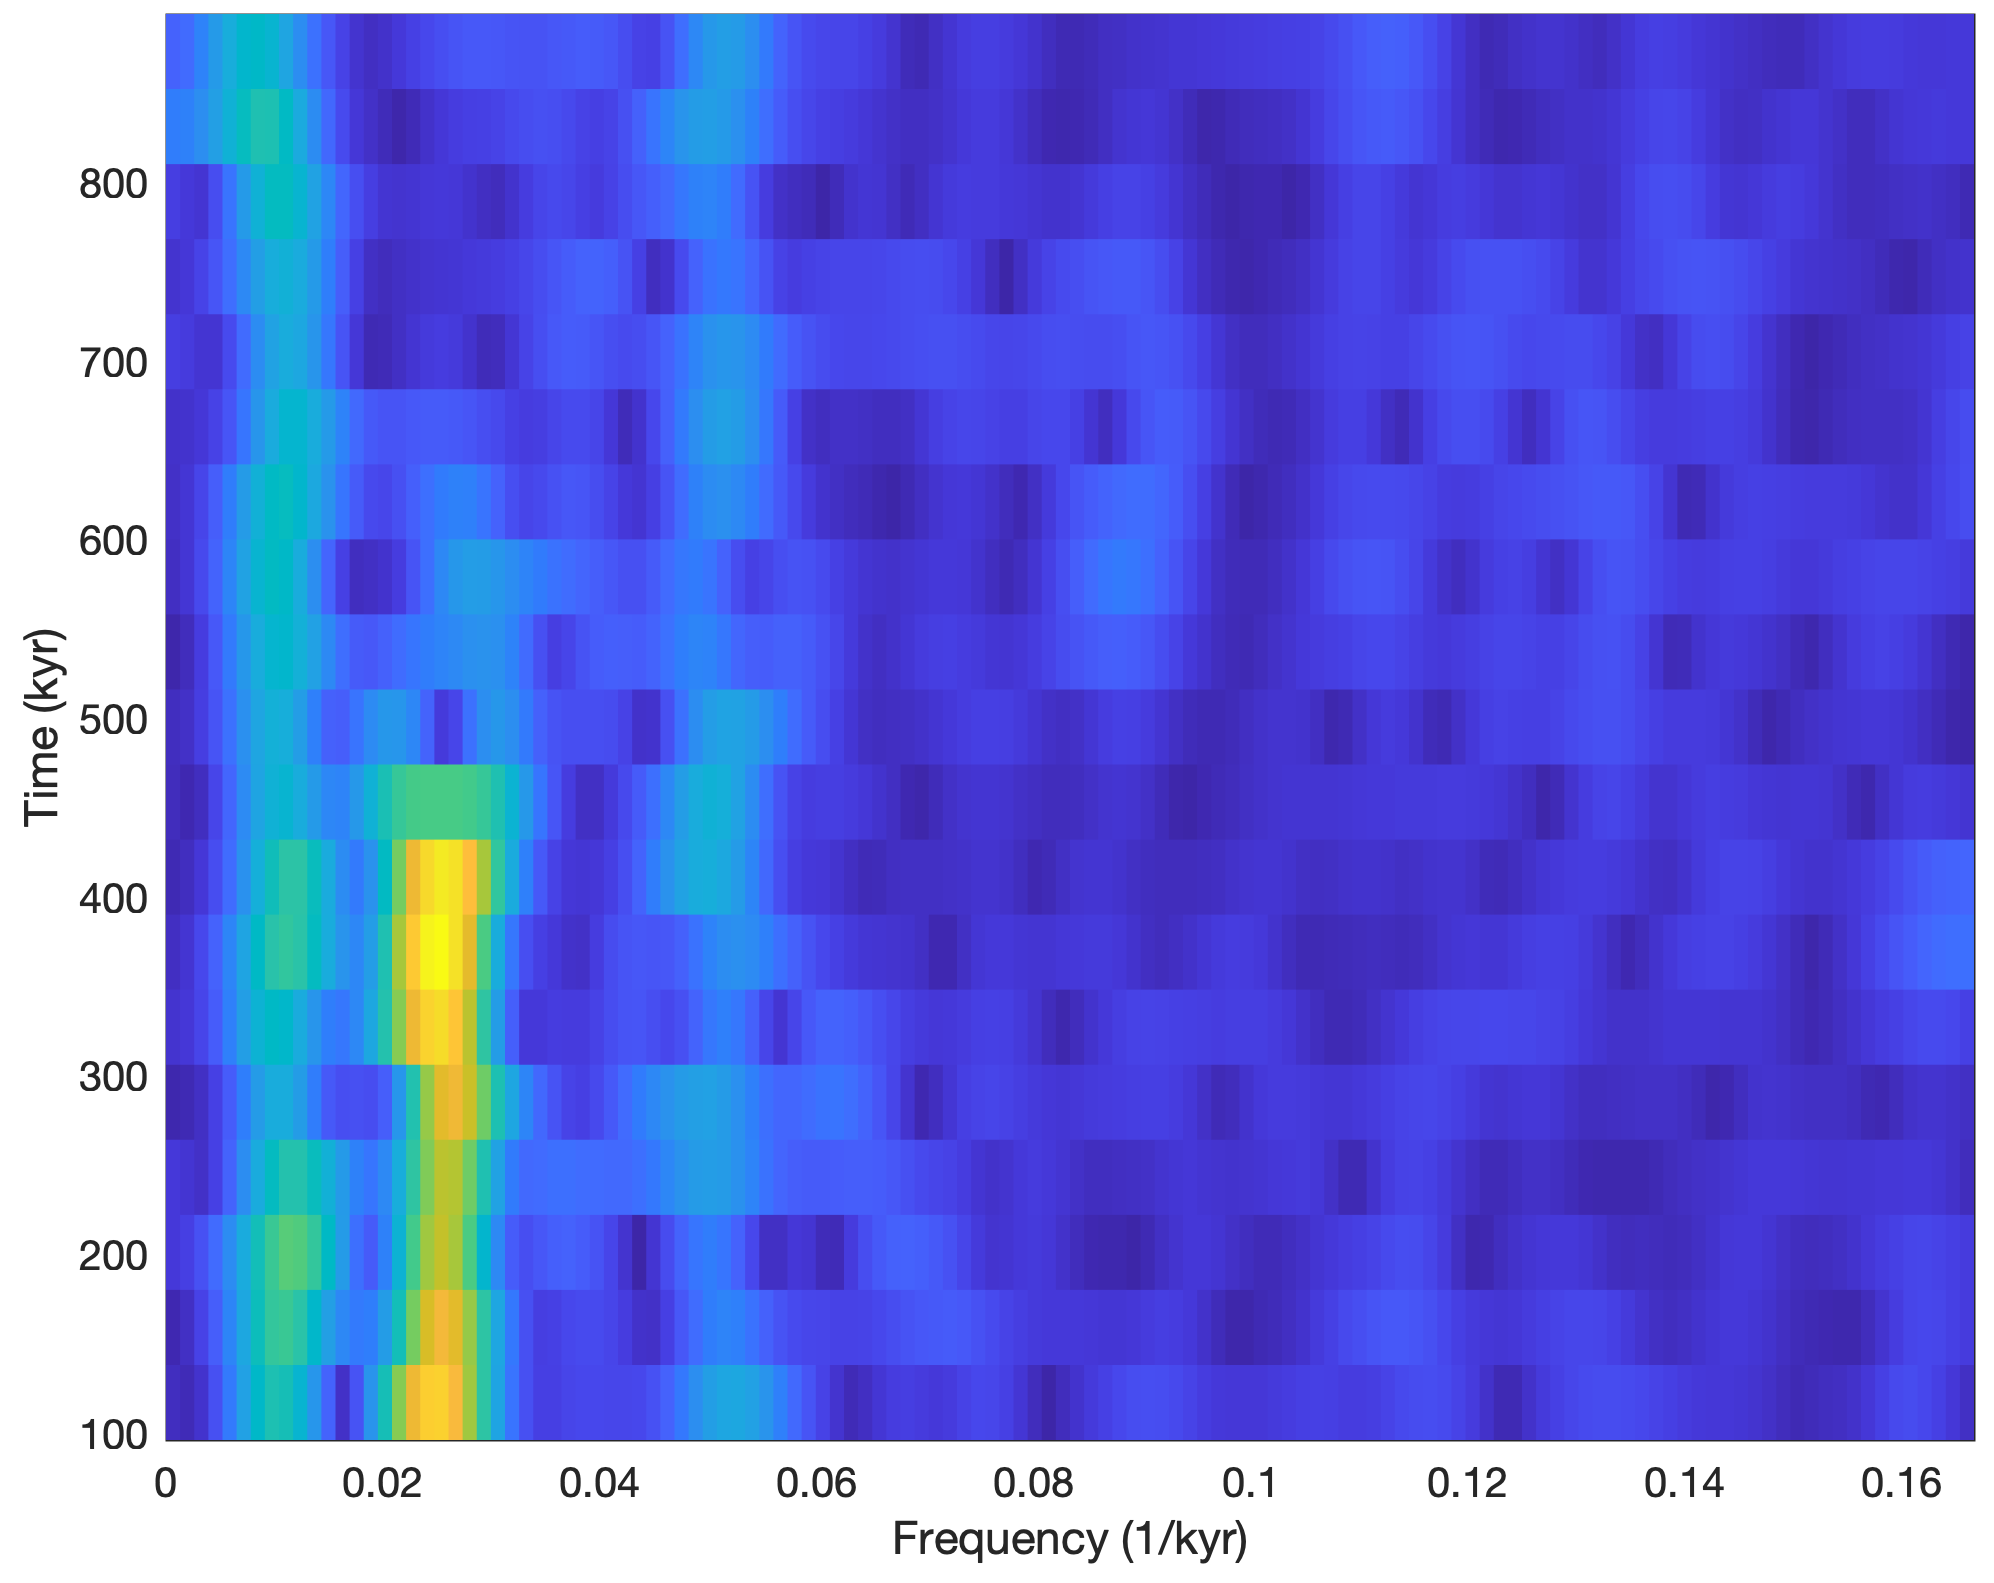
Change of Behaviour: spectrogram
Unfortunately, the graphical output of the function spectrogram has changed in a way that it can no longer be used by geoscientists. Here is a way around the problem. Continue reading “Change of Behaviour: spectrogram”

