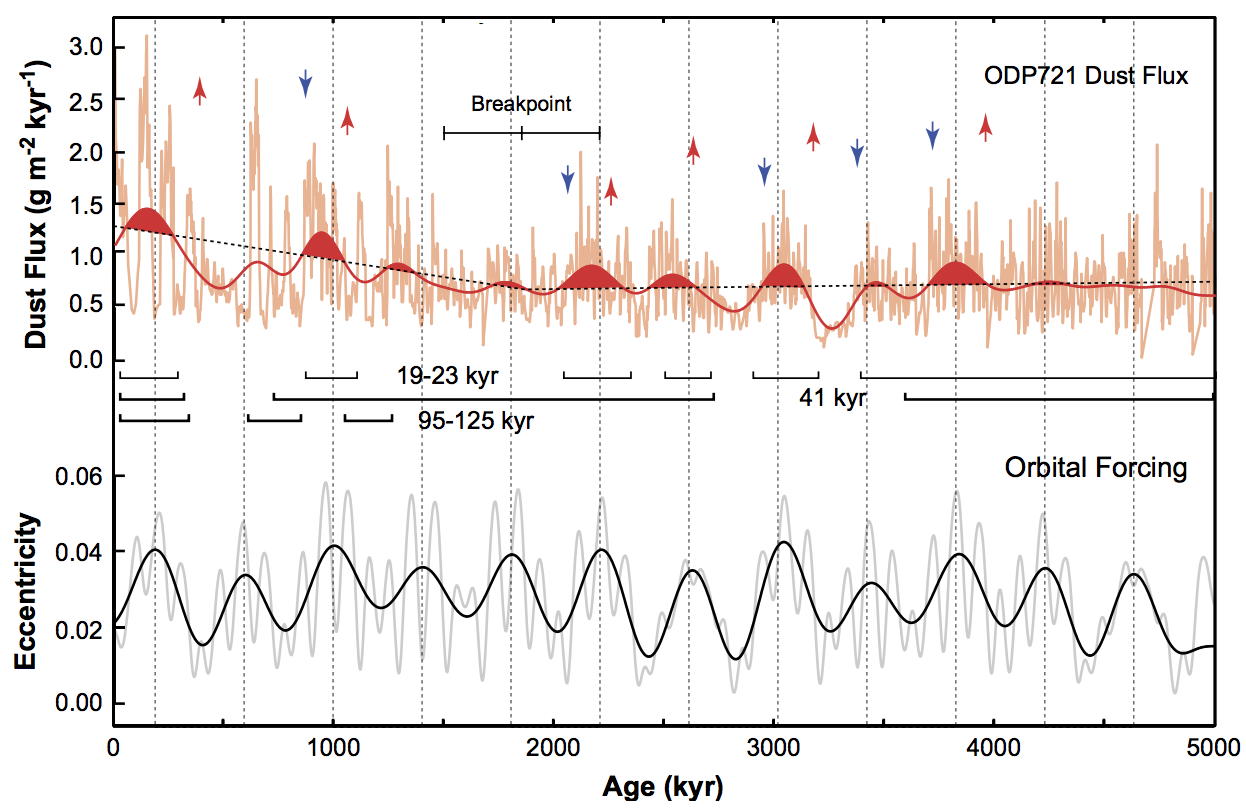
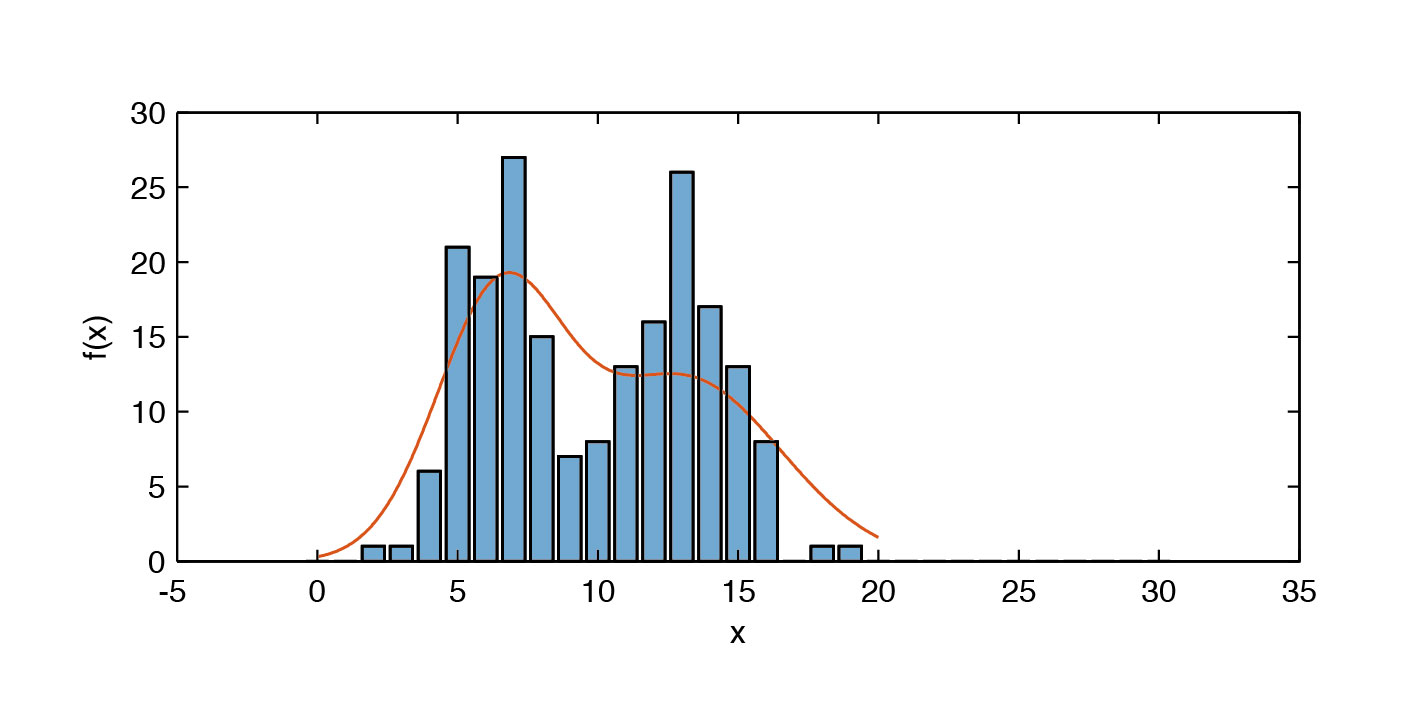
My paper about the time series analysis of published records of terrigenous dust flux from marine sediments together with Juarn C. Larrasoaña and Manfred Mudelsee was surprisingly successful. The paper was published before I started to publish my results together with data and MATLAB code. Since colleagues often asked for the data and code to carry out further analyzes or simply reproduce the figures, I put them both online today. Continue reading “MATLAB Code and Data of “Trends, rhythms and events in Plio-Pleistocene African climate” (Trauth et al., QSR 2009)”
Teaching Computational Geosciences with MATLAB, Part 6: Time-Series Analysis
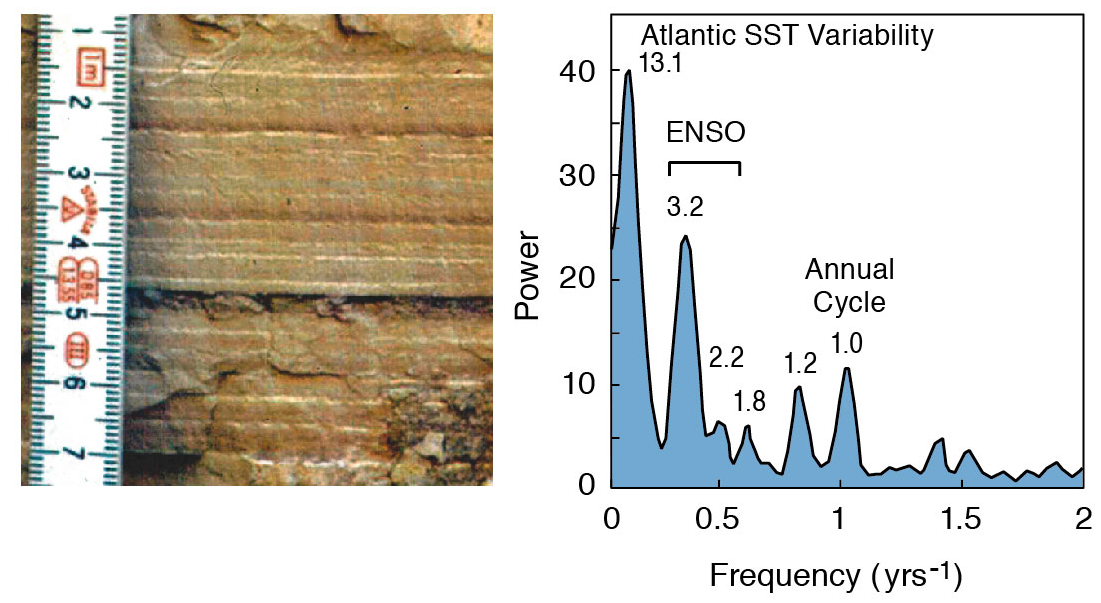
In a series of blog posts, I will tell you a little about how I teach computational geosciences with MATLAB. On the first half of day 3 of the one-week course I teach time-series analysis. Continue reading “Teaching Computational Geosciences with MATLAB, Part 6: Time-Series Analysis”
Potsdamer Neueste Nachrichten Special Issue Article on the HSPDP Project
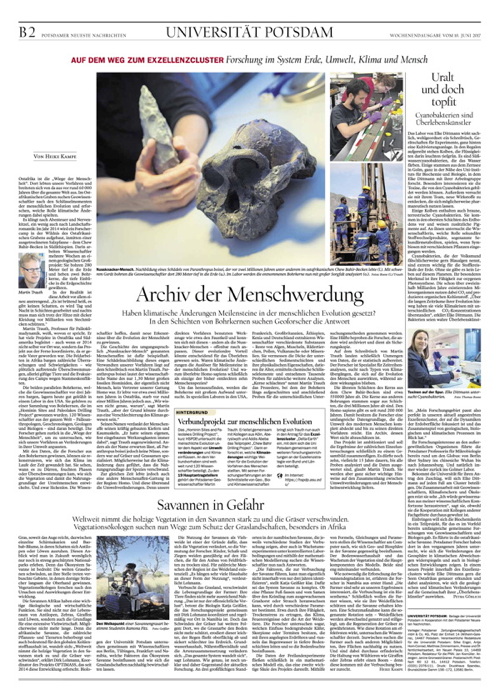
On Saturday 10 June 2017 the Potsdamer Neueste Nachrichten published an article about the Hominin Sites and Paleolakes Drilling Project (HSPDP), after a great interview with science journalist Heike Kampe. The article appeared as part of a special issue about the University of Potsdam. Also the photo on the front page, previously shown on the PORTAL cover, is the one I took in the Suguta Valley, Kenya.
Teaching Computational Geosciences with MATLAB, Part 5: Bivariate Stats
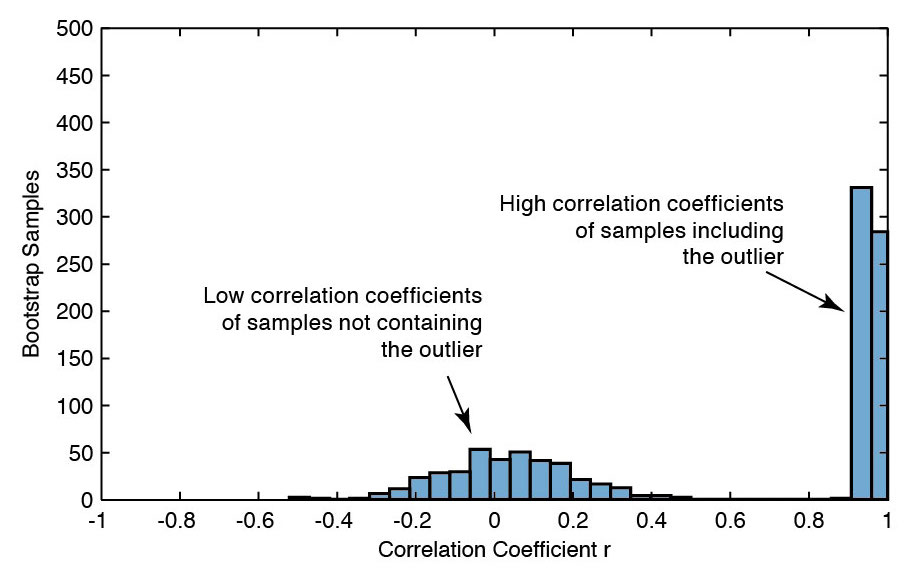
In a series of blog posts, I will tell you a little about how I teach computational geosciences with MATLAB. On the second half of day 2 of the one-week course I teach bivariate statistics. Continue reading “Teaching Computational Geosciences with MATLAB, Part 5: Bivariate Stats”
The Use of SRTM Data to Visualize my Holiday Resort in the Rhine Rift
During our early summer vacation my family and I will spend a few days near Landau in der Pfalz, where I grew up many years ago. The place is a beautiful town located in the Rhine Rift, east of the Pfälzerwald (Palatinate Forest). Here is a MATLAB script to visualize part of the Rhine Rift, similar to the one used to display the digital elevation model of the Kenya Rift, whose exploration I have devoted most of my career to.
Continue reading “The Use of SRTM Data to Visualize my Holiday Resort in the Rhine Rift”
Teaching Computational Geosciences with MATLAB, Part 4: Univariate Stats
In a series of blog posts, I will tell you a little about how I teach computational geosciences with MATLAB. After the introduction to MATLAB on the first day, I teach univariate statistics in the morning of the second day of the five-day course. Continue reading “Teaching Computational Geosciences with MATLAB, Part 4: Univariate Stats”
Shortcourses on Geoscience Investigations of Point Clouds and Topographic Analysis at U Potsdam
Two shortcourses, partly MATLAB-based, are taught by colleagues of mine within the DFG-funded StRATEGy Research Training Group at the University of Potsdam, together with GFZ, CONICET, U Buenos Aires and U Salta–Jujuy–Tucumán. The first course on “Advancing understanding of geomorphology with topographic analysis emphasizing high resolution topography” is taught by Ramón Arrowsmith, Bodo Bookhagen, Wolfgang Schwanghart and Christopher Crosby between 12–15 June 2017. The second course on “Geoscience Investigations of Point Clouds” is taught by Bodo Bookhagen, Ramón Arrowsmith, Martin Isenburg and Christopher Crosby between 7–9 June 2017.
Teaching Computational Geosciences with MATLAB, Part 3: Intro to MATLAB
In a series of blog posts, I will tell you a little about how I teach computational geosciences with MATLAB. After the work environment is set up and resources are presented with information about MATLAB, I show a very simple example of the typical workflow with MATLAB. The main goal of this is to show beginners how easy it is to get into this huge software.
Continue reading “Teaching Computational Geosciences with MATLAB, Part 3: Intro to MATLAB”

