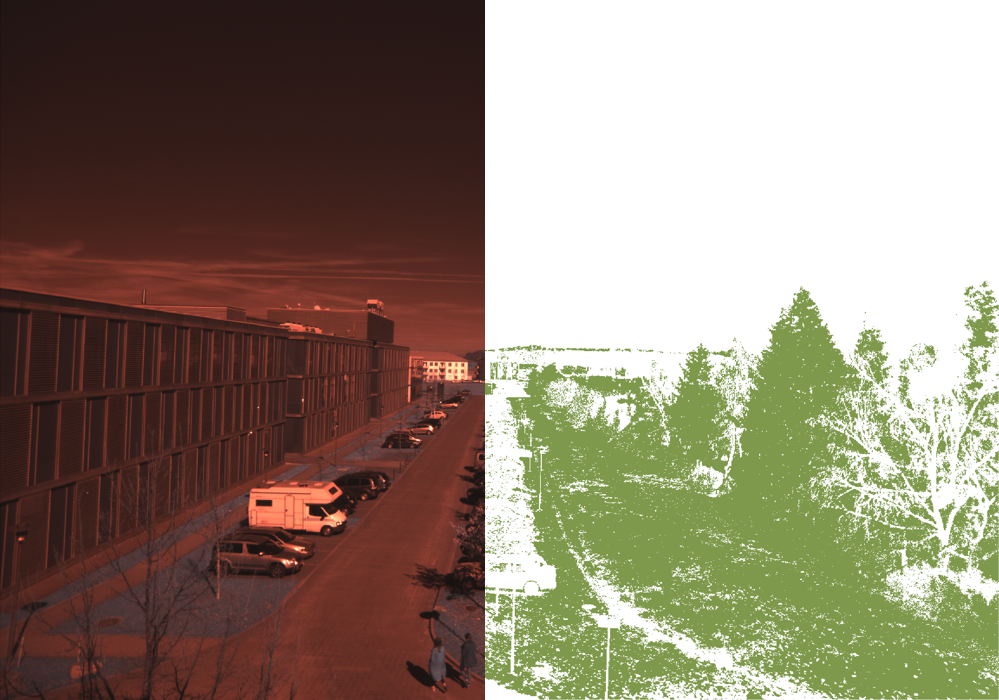
This exercise is intended to help students to understand how to capture NDVI Red+NIR images using a MAPIR Survey2 NDVI Red+NIR, to import the images into MATLAB and to calculate the Normalized Difference Vegetation Index.
The NDVI is an index to map live green vegetation. The index is based on the ratio of the difference of the red and infrared radiances. The pigments of plants strongly absorb visible light (400–700 nm) for the use in photosynthesis, whereas it reflects near-infrared light (700–1100 nm). The MAPIR Survey2 NDVI Camera measures Red (660 nm) and Infrared (850 nm) to calculate the NDVI.
- Build a vehicle on rails, with a NDVI-Red/NIR camera on the side.
- Program the vehicle in such a way that it moves in 20 cm steps along the rails, stops for a second or two, and takes a red, green, blue image of a nearby plant. Put a scale next to the object.
- Rectify, mosaic and register/reference the images and determine the NDVI index of the plant object.
Solution
This preliminary solution describes the acquisition, importing and processing of MAPIR Survey2 NDVI Camera raw images. This was a major challenge, especially because of the rather poor support and documentation from the company Peau Productions. The following script uses the information about the sensor and the camera provided on the webpage of the manufacturer MAPIR, in particular the information provided on the pages about the QGIS plugin. Furthermore the script is inspired by the example “Finding Vegetation in a Multispectral Image” from the documentation of the Image Processing Toolbox of MATLAB. The example does not provide any calibration of the camera and uses a auto white balance instead of a true white balance using a white reference.
clear, clc, close all
According to the webpage of MAPIR about “Calibrating Images in QGIS with MAPIR Plugin” the Survey 2The Survey2 cameras capture 16 bit RAW photos, which means there are 16 bits (65,536) pixels and a pixel value range from 0 to 65,535. When the camera saves a JPG it compresses (removes) the pixels leaving a range of only 0 to 255. Since we are capturing a reflectance of light and not trying to make a “pretty picture” we want to always use the RAW format. Define file name and size of the image.
filename = '2017_0328_110031_007.RAW';
row = 3456;
col = 4608;
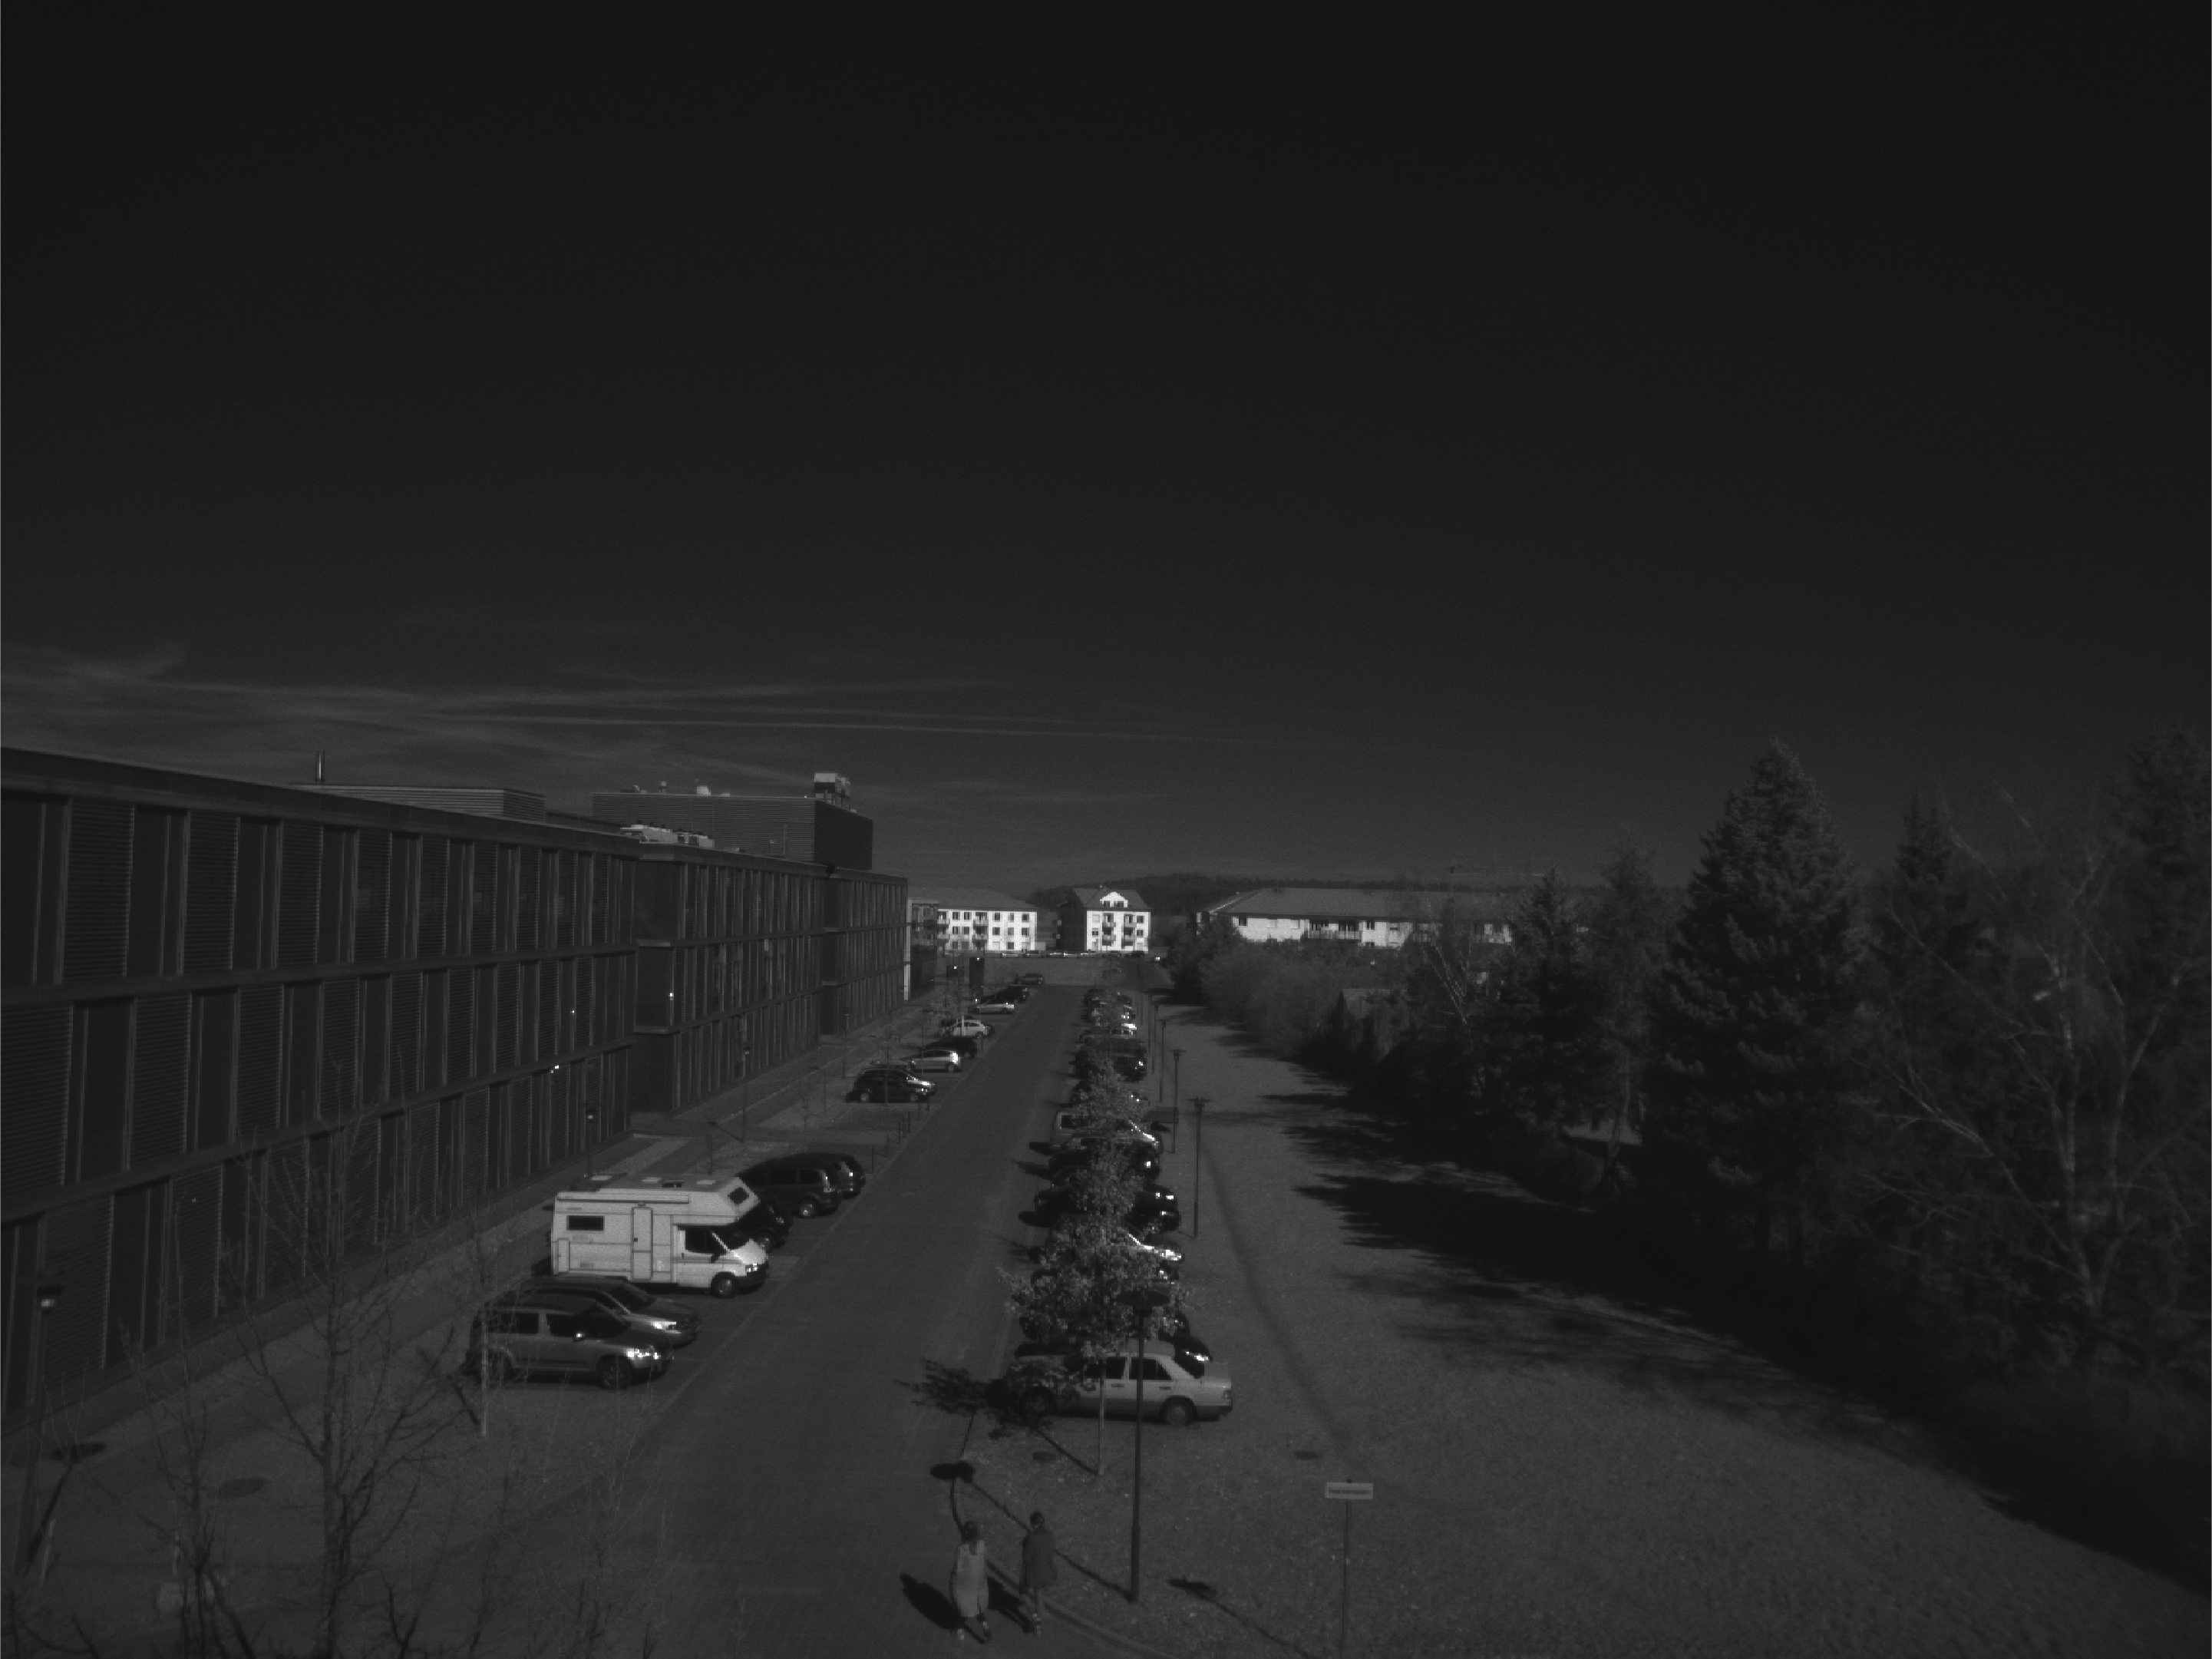
Read 16 bit raw image from the NDVI camera.
id = fopen(filename);
I1 = fread(id, [col, row],'*uint16','ieee-le');
I1 = I1';
figure('Position',[100 700 800 600])
imshow(I1,'InitialMagnification',30)
print -dpng -r300 Exercises_NDVI_Image_1_vs1.png
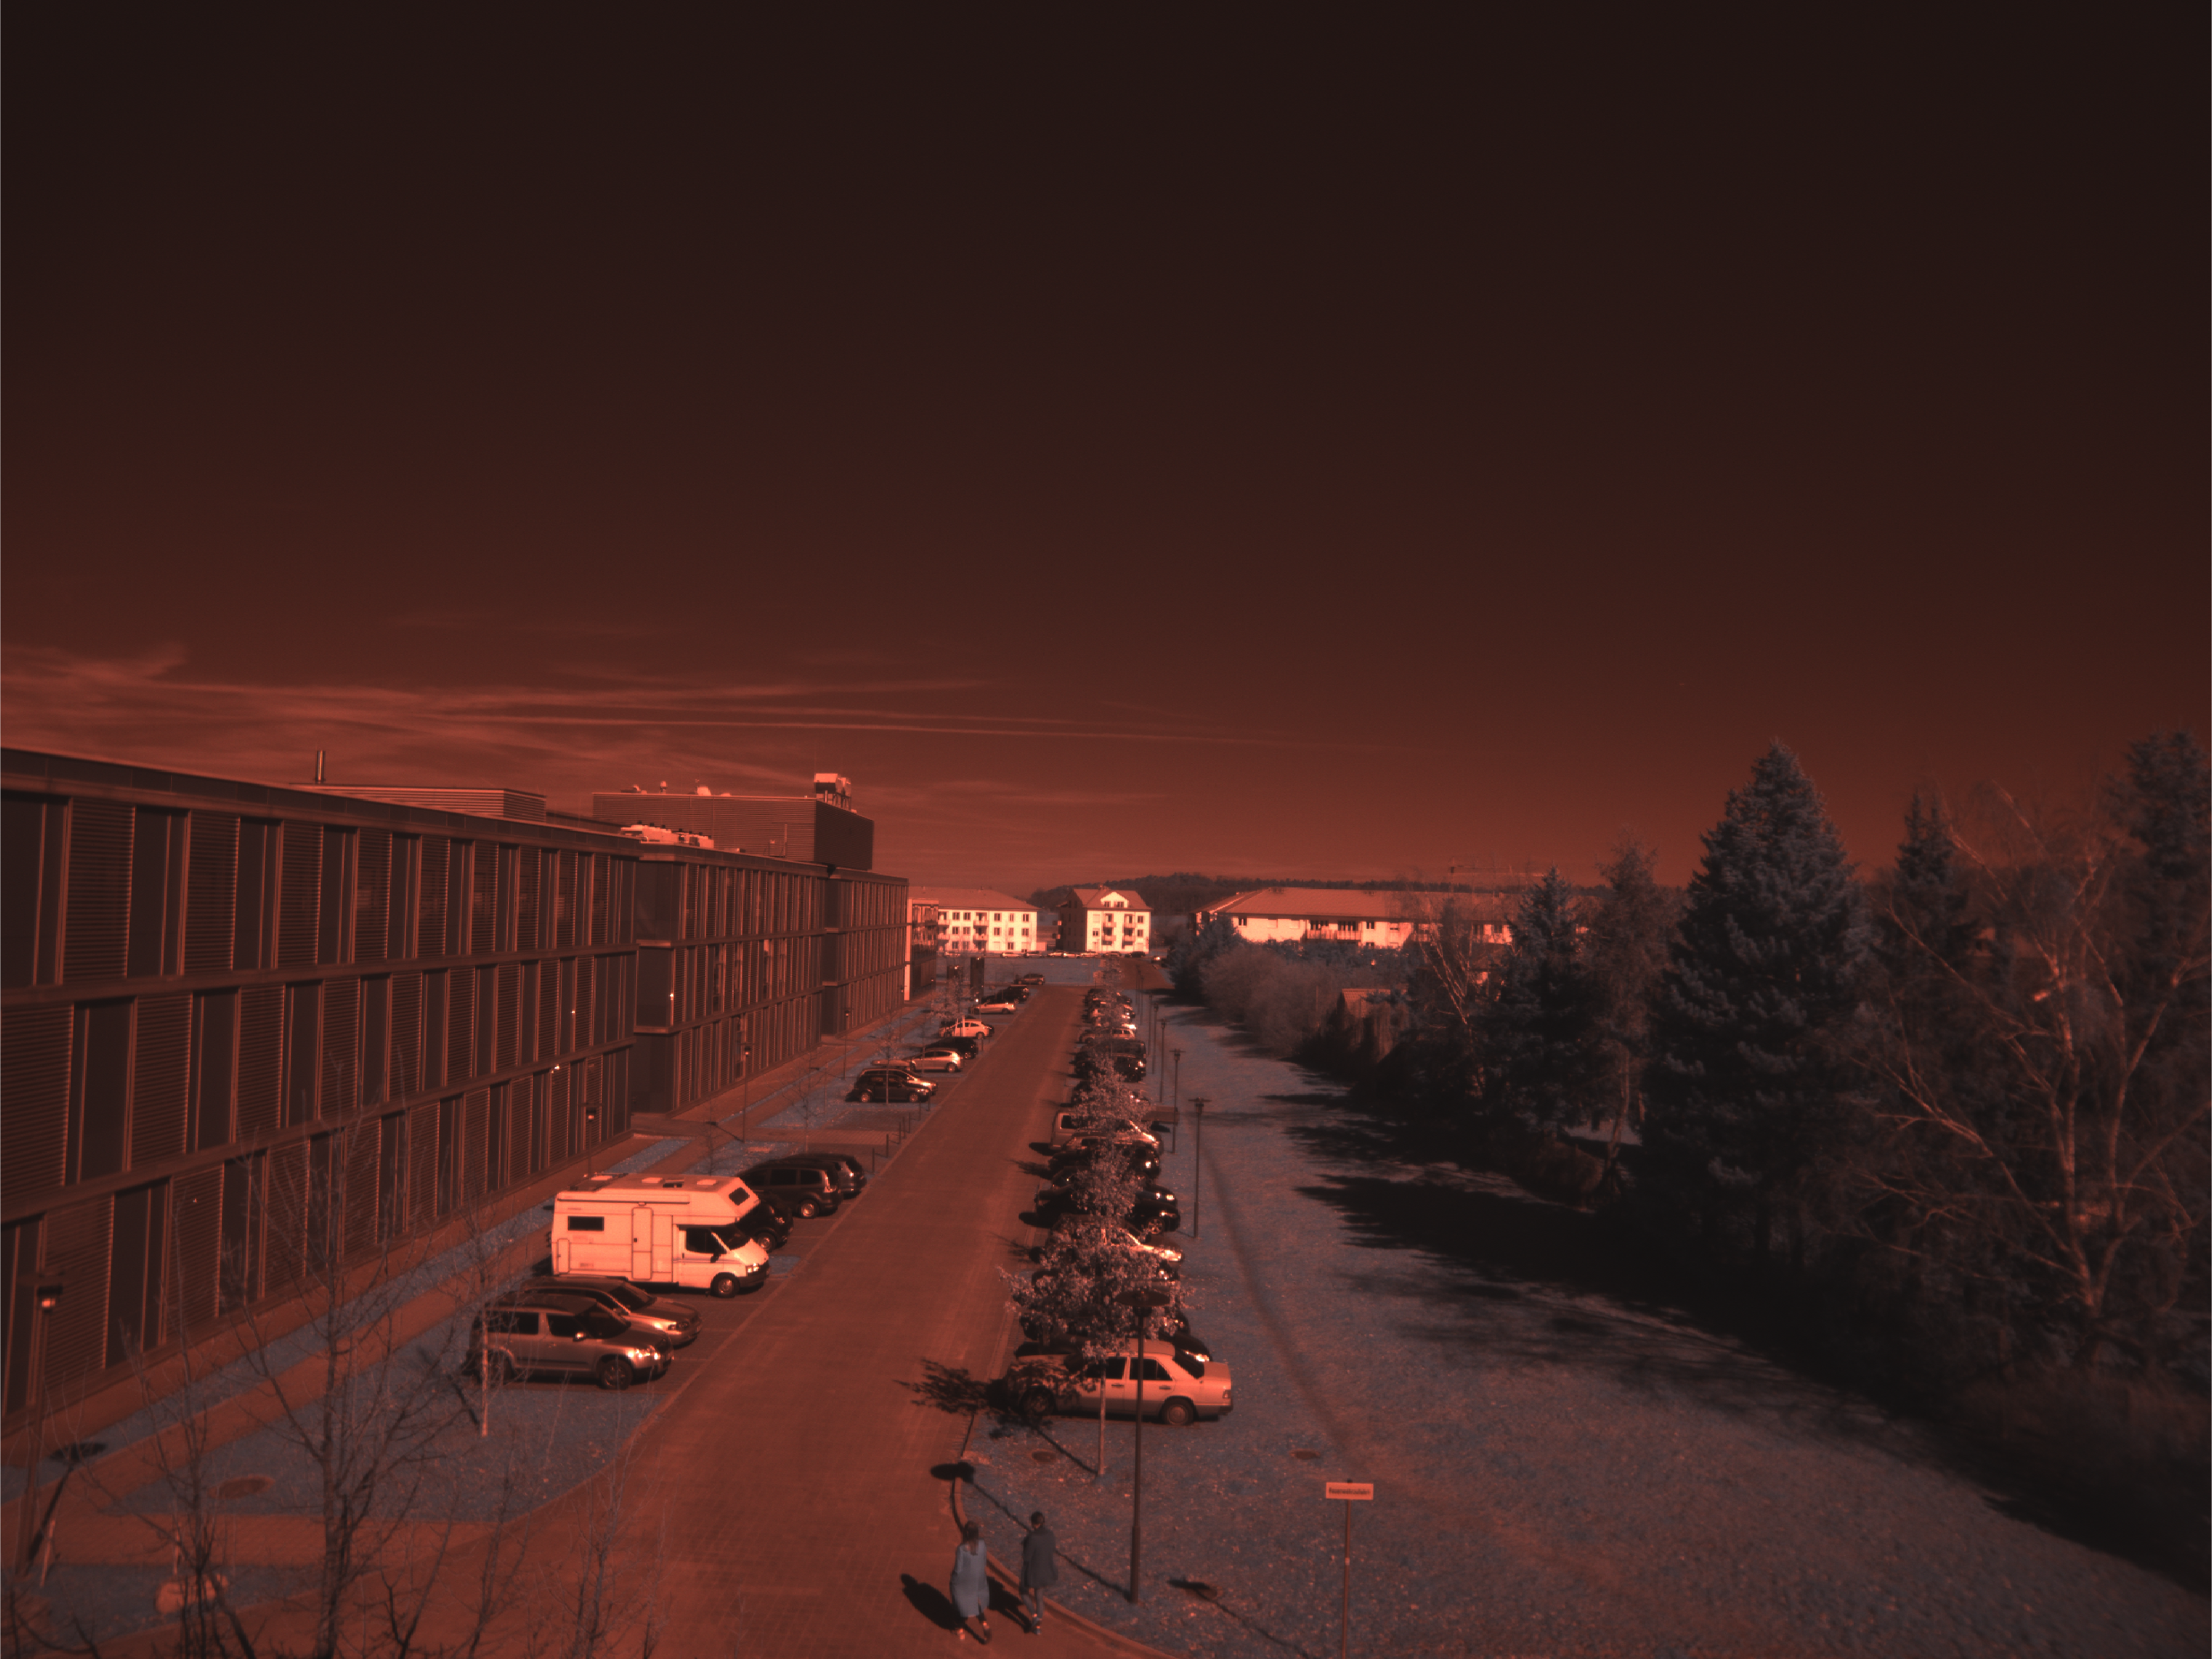
Convert RGGB Bayer pattern encoded image to a truecolor image.
figure('Position',[100 300 800 600])
I2 = demosaic(I1,'rggb');
imshow(I2,'InitialMagnification',30)
print -dpng -r300 Exercises_NDVI_Image_2_vs1.png
Apply decorrelation stretch to multichannel image.
I3 = decorrstretch(I2, 'Tol', 0.01);
imshow(I3,'InitialMagnification',30)
print -dpng -r300 Exercises_NDVI_Image_3_vs1.png
Display the Red and NIR channels.
figure('Position',[100 100 800 300])
subplot(1,2,1), imshow(I3(:,:,1)), title('Red')
subplot(1,2,2), imshow(I3(:,:,3)), title('NIR')
print -dpng -r300 Exercises_NDVI_Image_4_vs1.png
Auto white balance.
I3G = rgb2gray(I3);
meanR = mean2(I3(:,:,1));
meanG = mean2(I3(:,:,2));
meanB = mean2(I3(:,:,3));
meanGray = mean2(I3G);
I3W(:,:,1) = uint16(single(I3(:,:,1))* ...
    meanGray / meanR);
I3W(:,:,2) = uint16(single(I3(:,:,2))* ...
    meanGray / meanG);
I3W(:,:,3) = uint16(single(I3(:,:,3))* ...
    meanGray / meanB);
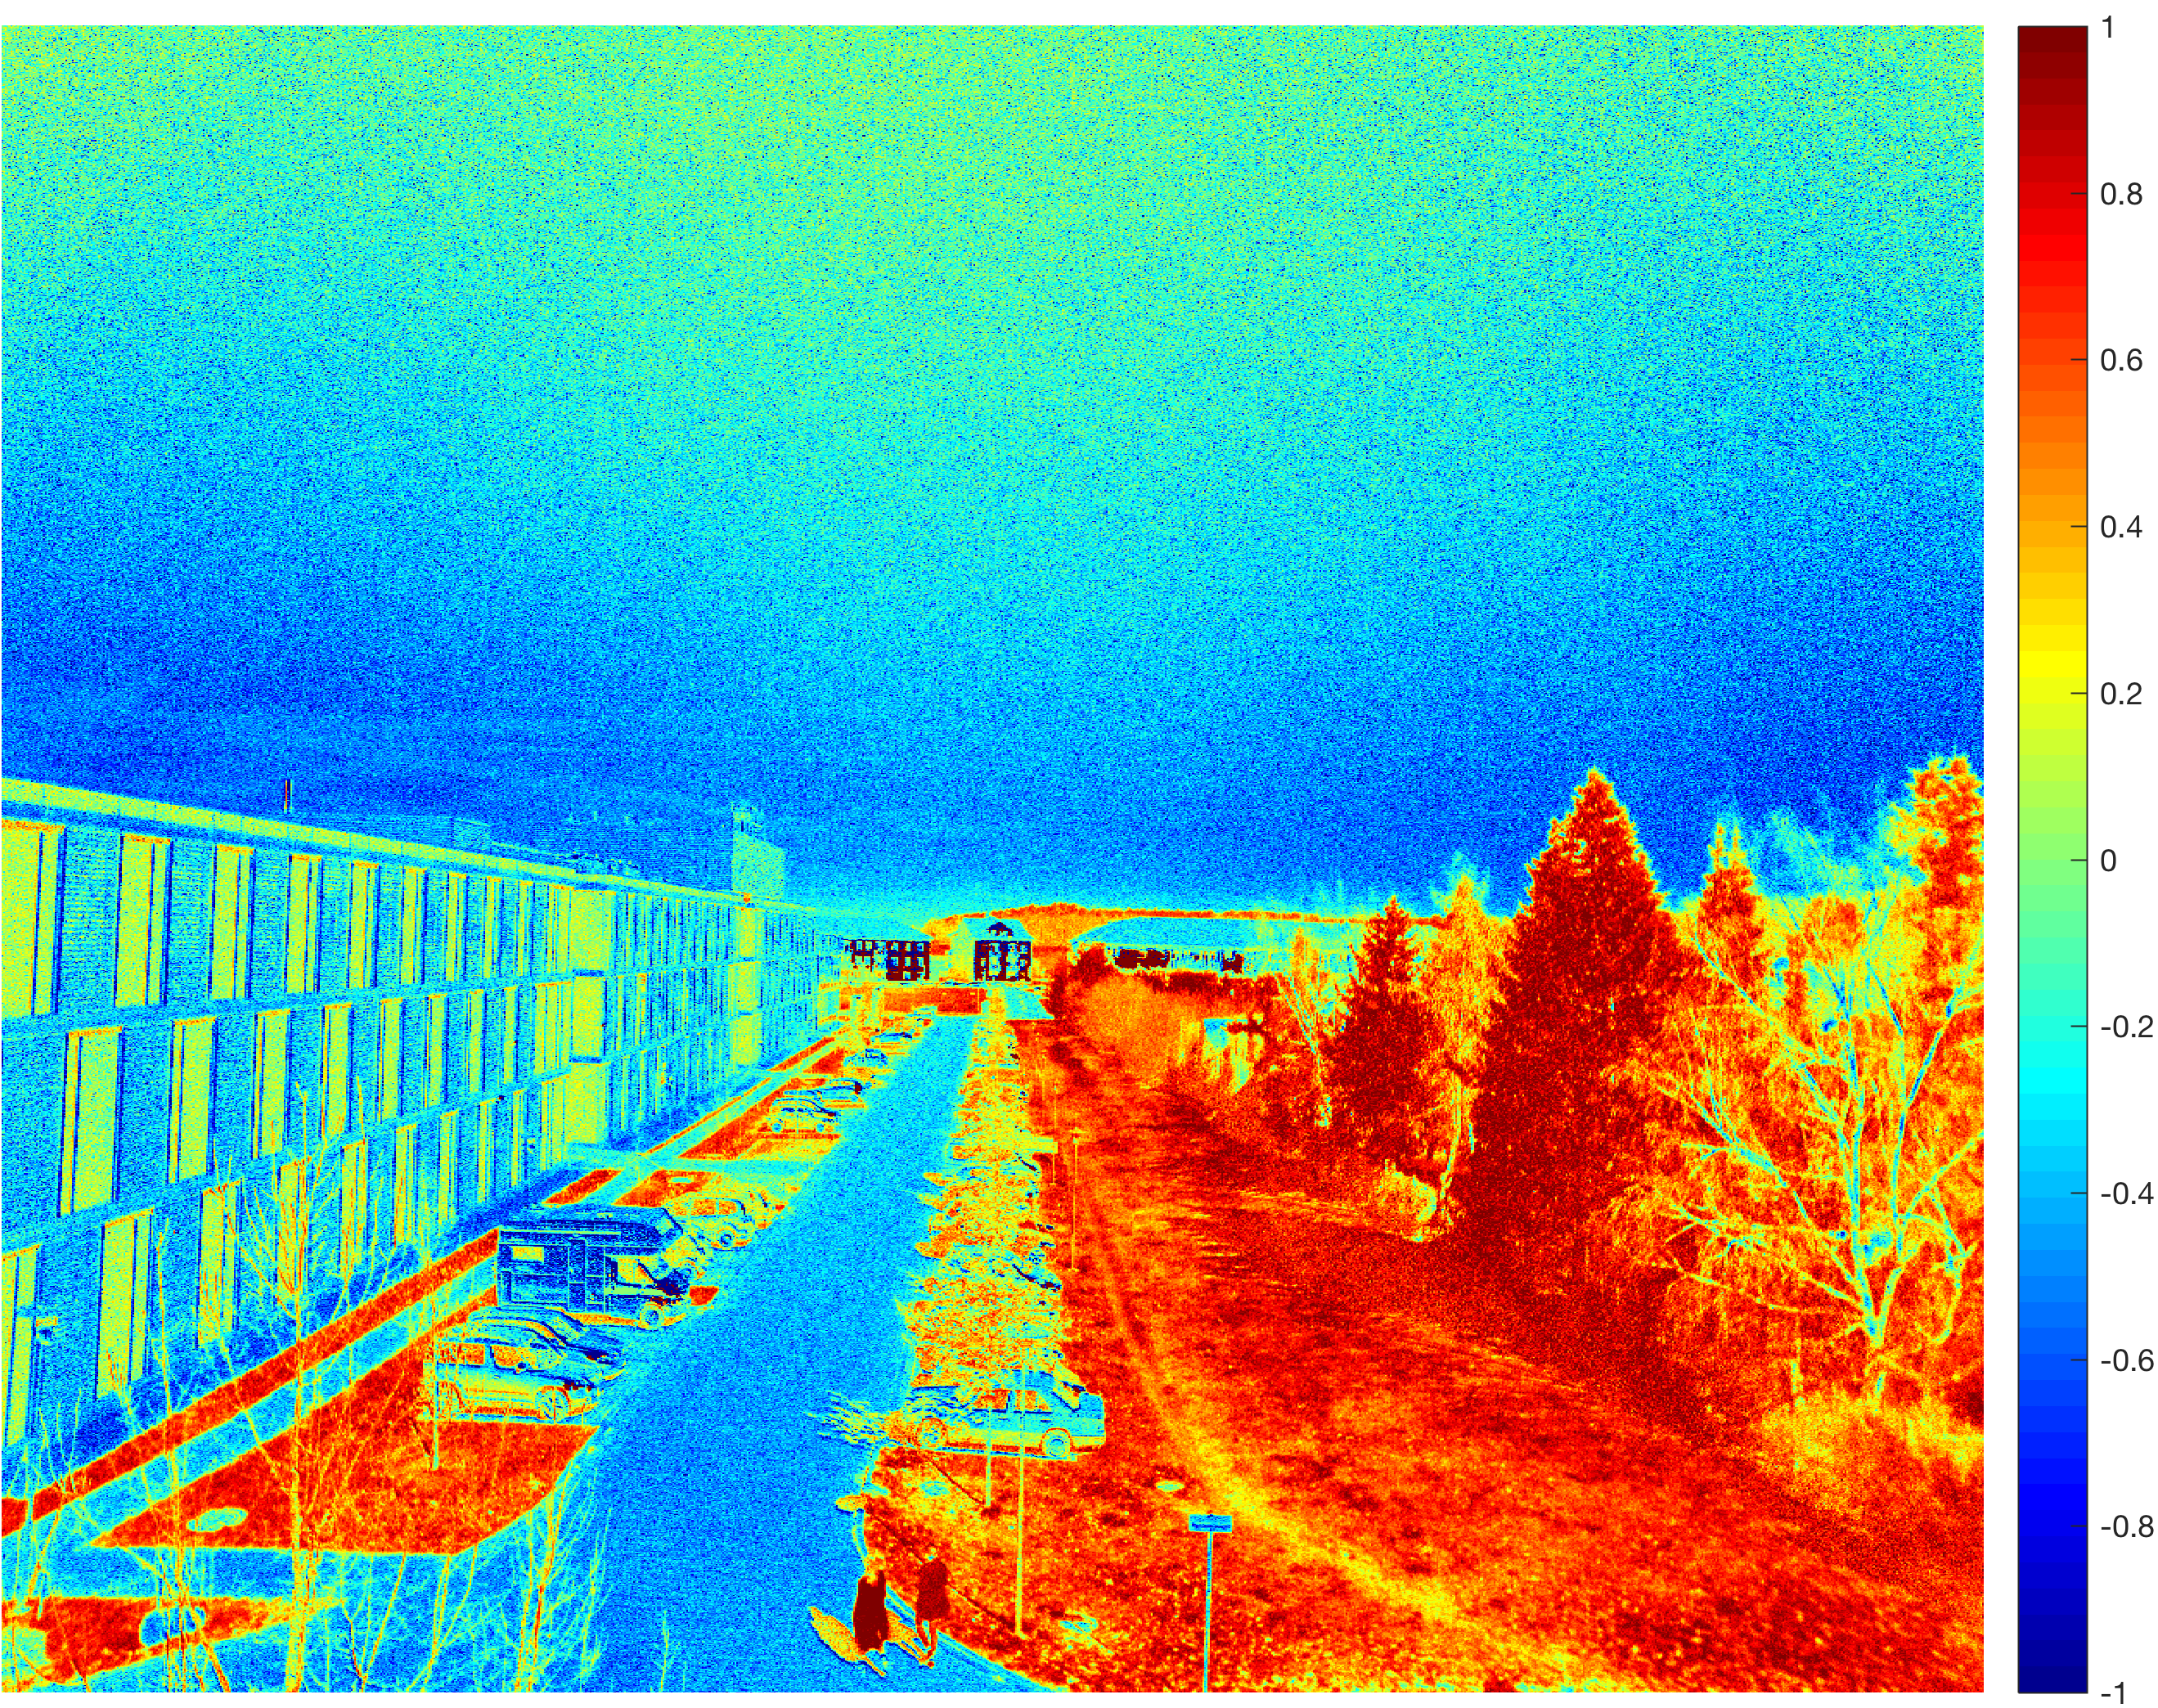
Convert to single precision and calculate NDVI.
I4 = single(I3W)/65536;
ndvi = (I4(:,:,3) - I4(:,:,1)) ./ (I4(:,:,3) + I4(:,:,1));
figure('Position',[100 700 800 600])
imshow(ndvi,...
    'DisplayRange',[-1 1],...
    'InitialMagnification',30)
print -dpng -r300 Exercises_NDVI_Image_5_vs1.png
Pseudocolor plot of the NDVI using the colormap jet.
figure('Position',[100 700 800 600])
imagesc(ndvi), axis off, colormap(jet), colorbar
print -dpng -r300 Exercises_NDVI_Image_5A_vs1.png
Use threshold to locate vegetation.
threshold = 0.4;
ndvit = (ndvi > threshold);
figure('Position',[100 700 800 600])
imshow(ndvit,...
    'DisplayRange',[-1 1],...
    'InitialMagnification',30)
print -dpng -r300 Exercises_NDVI_Image_6_vs1.png
Display threshold image in Green (vegetation) and White (other).
figure('Position',[100 700 800 600])
imshow(ndvit,'InitialMagnification',30)
colormap(gca,[1 1 1;0.5 0.6 0.3])
print -dpng -r300 Exercises_NDVI_Image_7_vs1.png
Download the MATLAB script and example image.


