Here you find the MATLAB code of our paper “Classifying past climate change in the Chew Bahir basin, southern Ethiopia, using recurrence quantification analysis” accepted for publication by Springer journal Climate Dynamics. Continue reading “MATLAB Code of “Classifying past climate change in the Chew Bahir basin …” (Trauth et al., Clim Dyn 2019)”
Shading Areas Between Two Curves With MATLAB
Our paleoclimate time series often contain too much detail, i.e. they have a high variance in the high frequency range. Of course, this can be true climate variability, but it usually contains a lot of noise. Therefore we like to plot a filtered variant of the curve together with the original curve and fill the area between the two. Here I show you how it works with MATLAB. Continue reading “Shading Areas Between Two Curves With MATLAB”
Classifying past climate change in the Chew Bahir basin, southern Ethiopia, using recurrence quantification analysis
Article accepted on 45 kyr climate change classification in the ChewBahir, S Ethiopia, using recurrence plots. Springer journal Climate Dynamics is my favorite journal for papers on paleoclimate, lakes, archaeology … and lots of maths and ~1,000 lines of MATLAB code! This work is part of the Hominin Sites and Paleolakes Drilling Project.
Playing Around with Floating Point Numbers with MATLAB
Computers do not work with real numbers, of which there are infinitely many, but with a finite number of floating point numbers. Most real numbers do not exist in computers because they fall between two floating point numbers. Everything we calculate with a computer may therefore have a finite accuracy. Here are some MATLAB examples. Continue reading “Playing Around with Floating Point Numbers with MATLAB”
MATLAB/Simulink Total Academic Headcount License at U Potsdam
Since November 1, 2018, the University of Potsdam offers a university-wide license for MATLAB, Simulink and 50 Toolboxes for all students and employees. This MATLAB Total Academic Headcount License allows all students, faculty and researchers to use the software at their workspace, in the computer pools, in the university’s WiFi network, at home and while traveling.
Continue reading “MATLAB/Simulink Total Academic Headcount License at U Potsdam”
MATLAB Example to Illustrate John Aitchison’s Log-Ratio Transformation, Part 1
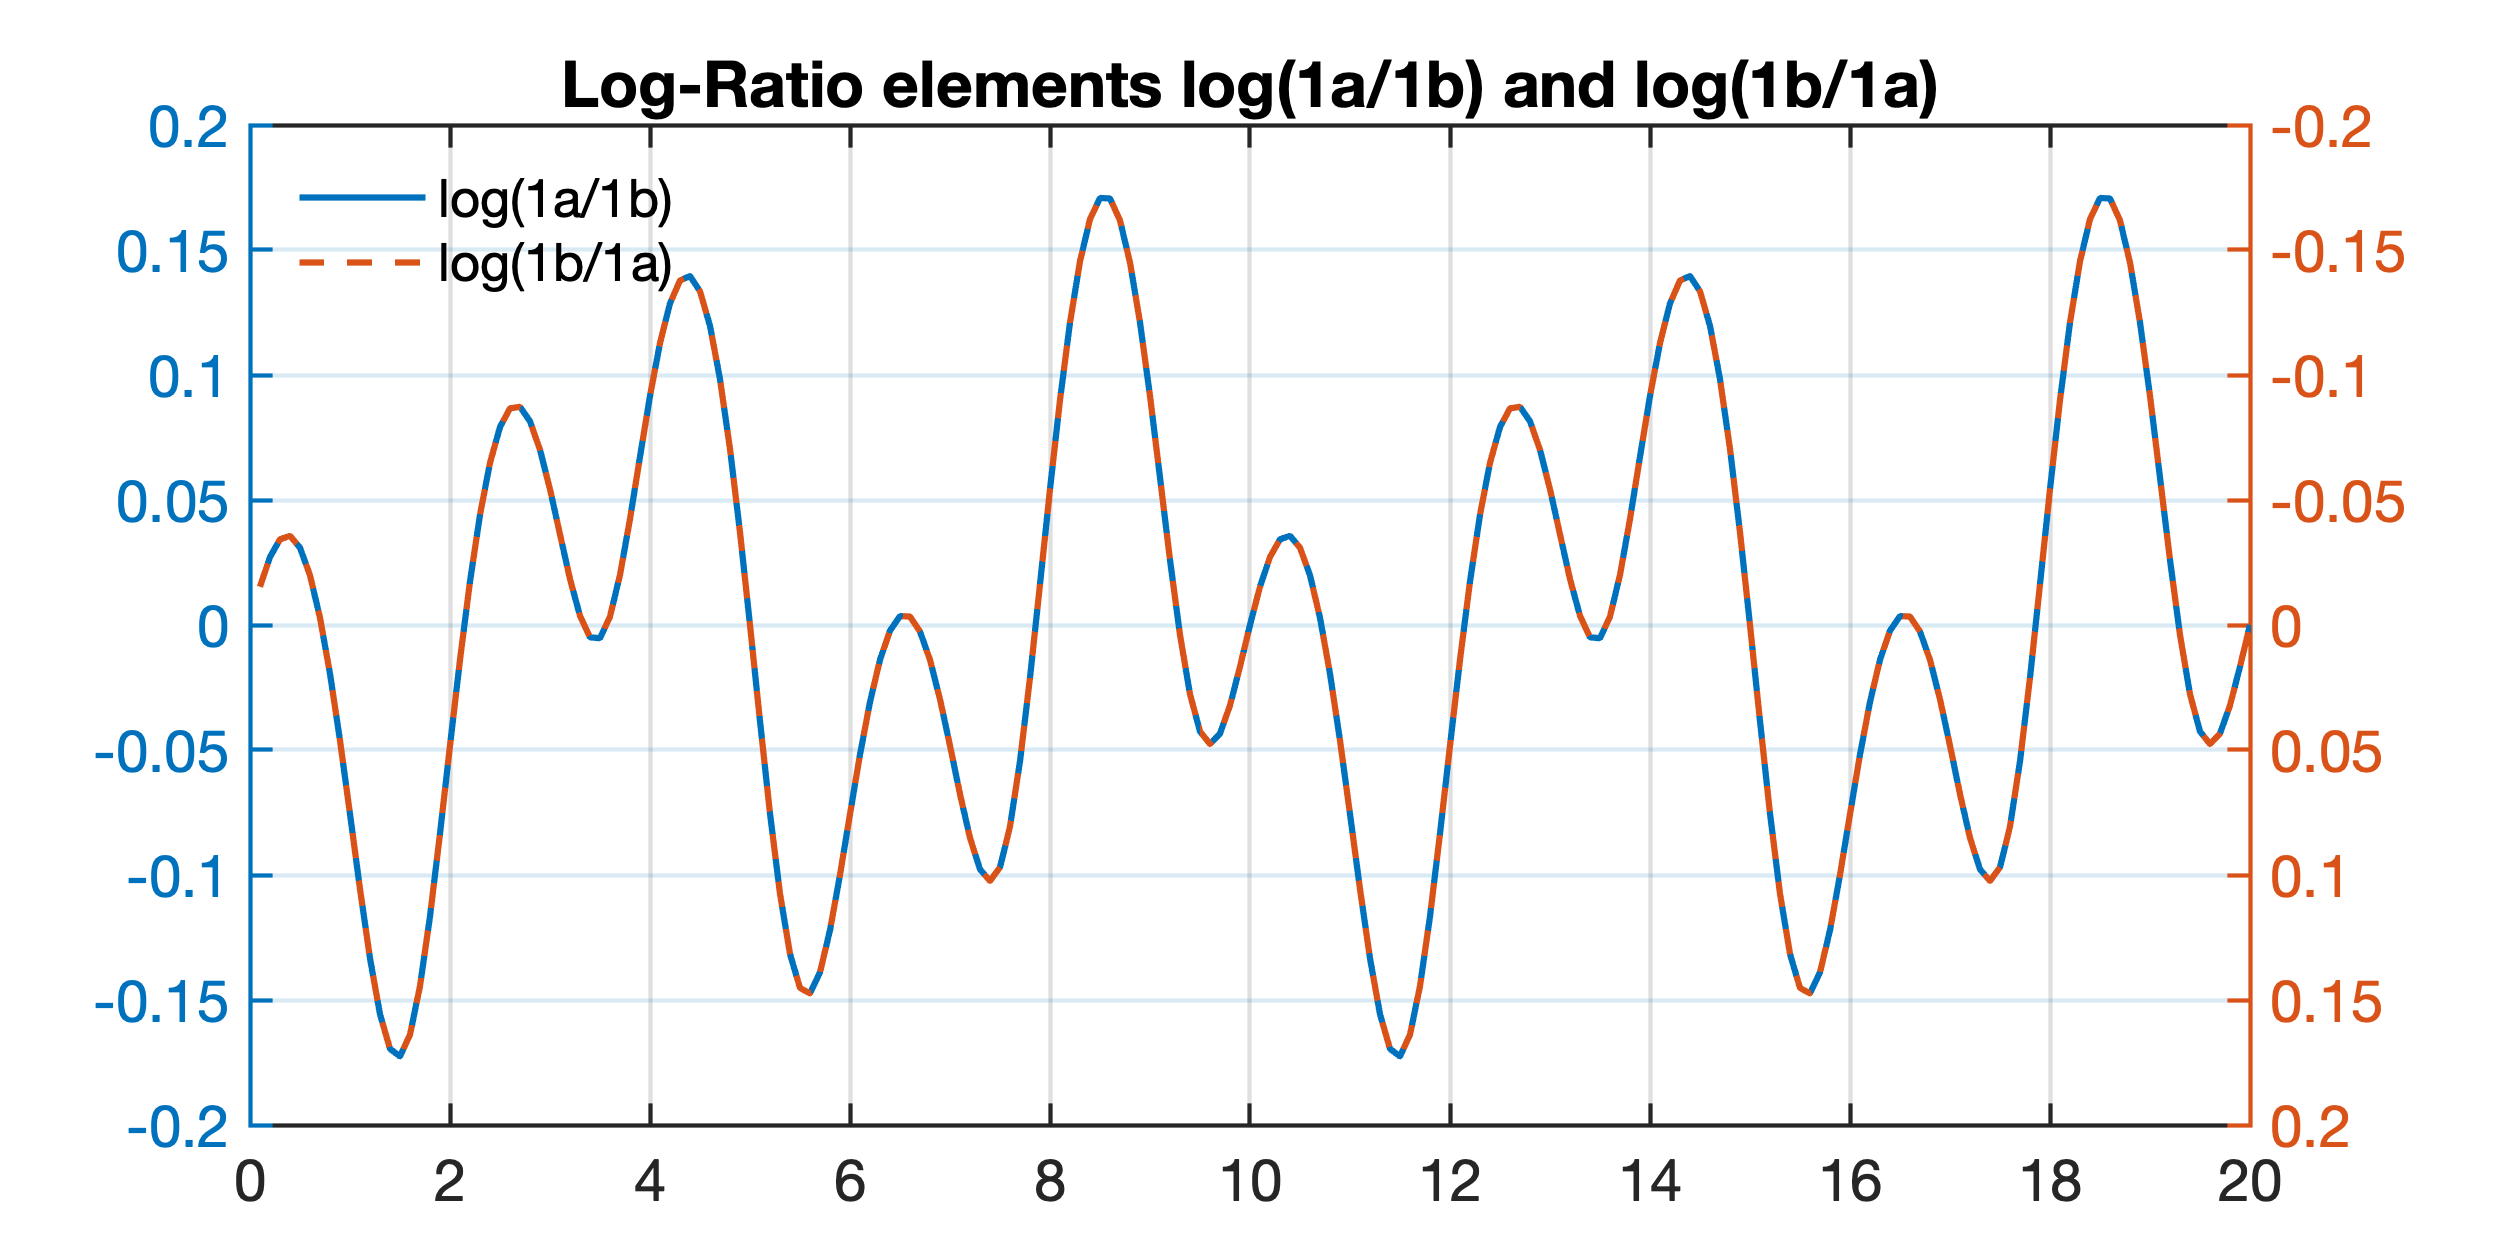
Anyone who has ever dealt with the statistical analysis of compositional data must have stumbled across John Aitchison’s (1926-2016) log-ratio transformation. The Scottish statistician spent much of his career on the statistics of such data, wrote the famous book “The Statistical Analysis of Compositional Data” (Aitchison, 1986, 2003) and multiple papers on the same topic, with associated MATLAB 5 software package CODA available from the author at the time of publication, updated versions now available for download at CoDAWeb. Aitchison’s log-ratio transformation overcomes the close-sum problem of closed data, i.e. data expressed as proportions and adding up to a fixed total such as 100 percent. The close-sum problem causes spurious negative correlations between pairs of variables that are avoided by logarithmizing ratios of the variables. Here is a simple MATLAB example illustrating the effect of Aitchison’s log-ratio transformation on compositional data. Continue reading “MATLAB Example to Illustrate John Aitchison’s Log-Ratio Transformation, Part 1”
46th and 47th Shortcourse on MRES in Potsdam
The spring courses on MATLAB Recipes for Earth Sciences in Potsdam will be held on 18–22 Februar 2019 (in English language) and 4–8 March 2019 (in German language). Continue reading “46th and 47th Shortcourse on MRES in Potsdam”
Public Lecture during the University of Potsdam Children’s University
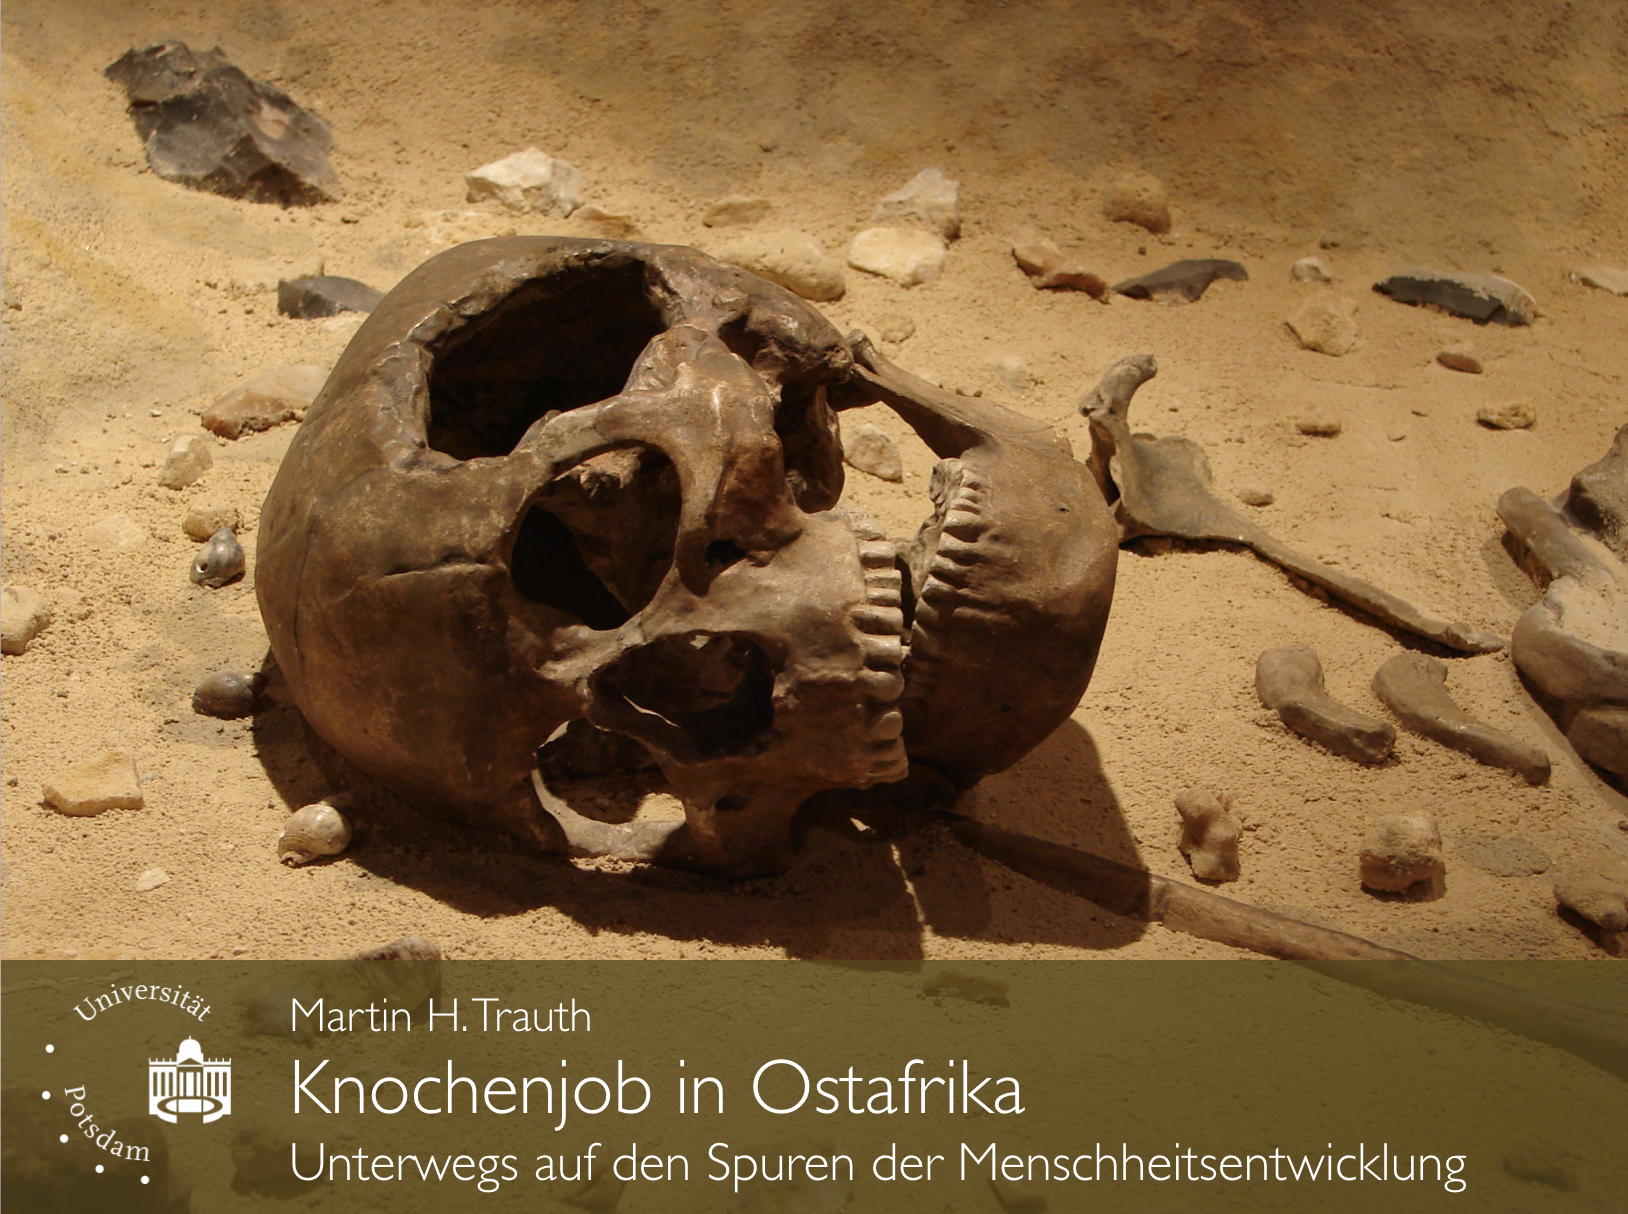
On September 28, 2018, the University of Potsdam will once again open its lecture halls for 8–10 year old children in order to inspire them for the world of science. During the event I will teach a lecture on “Knochenjob in Ostafrika – Unterwegs auf den Spuren der Menschheitsentwicklung” during the Children’s University Potsdam.


