
The new GMT/MATLAB Toolbox by Paul Wessel and Joaquim F. Luis is a great interface between both very popular tools. Continue reading “GMT/MATLAB Toolbox”

MATLAB and Python Recipes for Earth Sciences
Martin H. Trauth, University of Potsdam, Germany
The new GMT/MATLAB Toolbox by Paul Wessel and Joaquim F. Luis is a great interface between both very popular tools. Continue reading “GMT/MATLAB Toolbox”
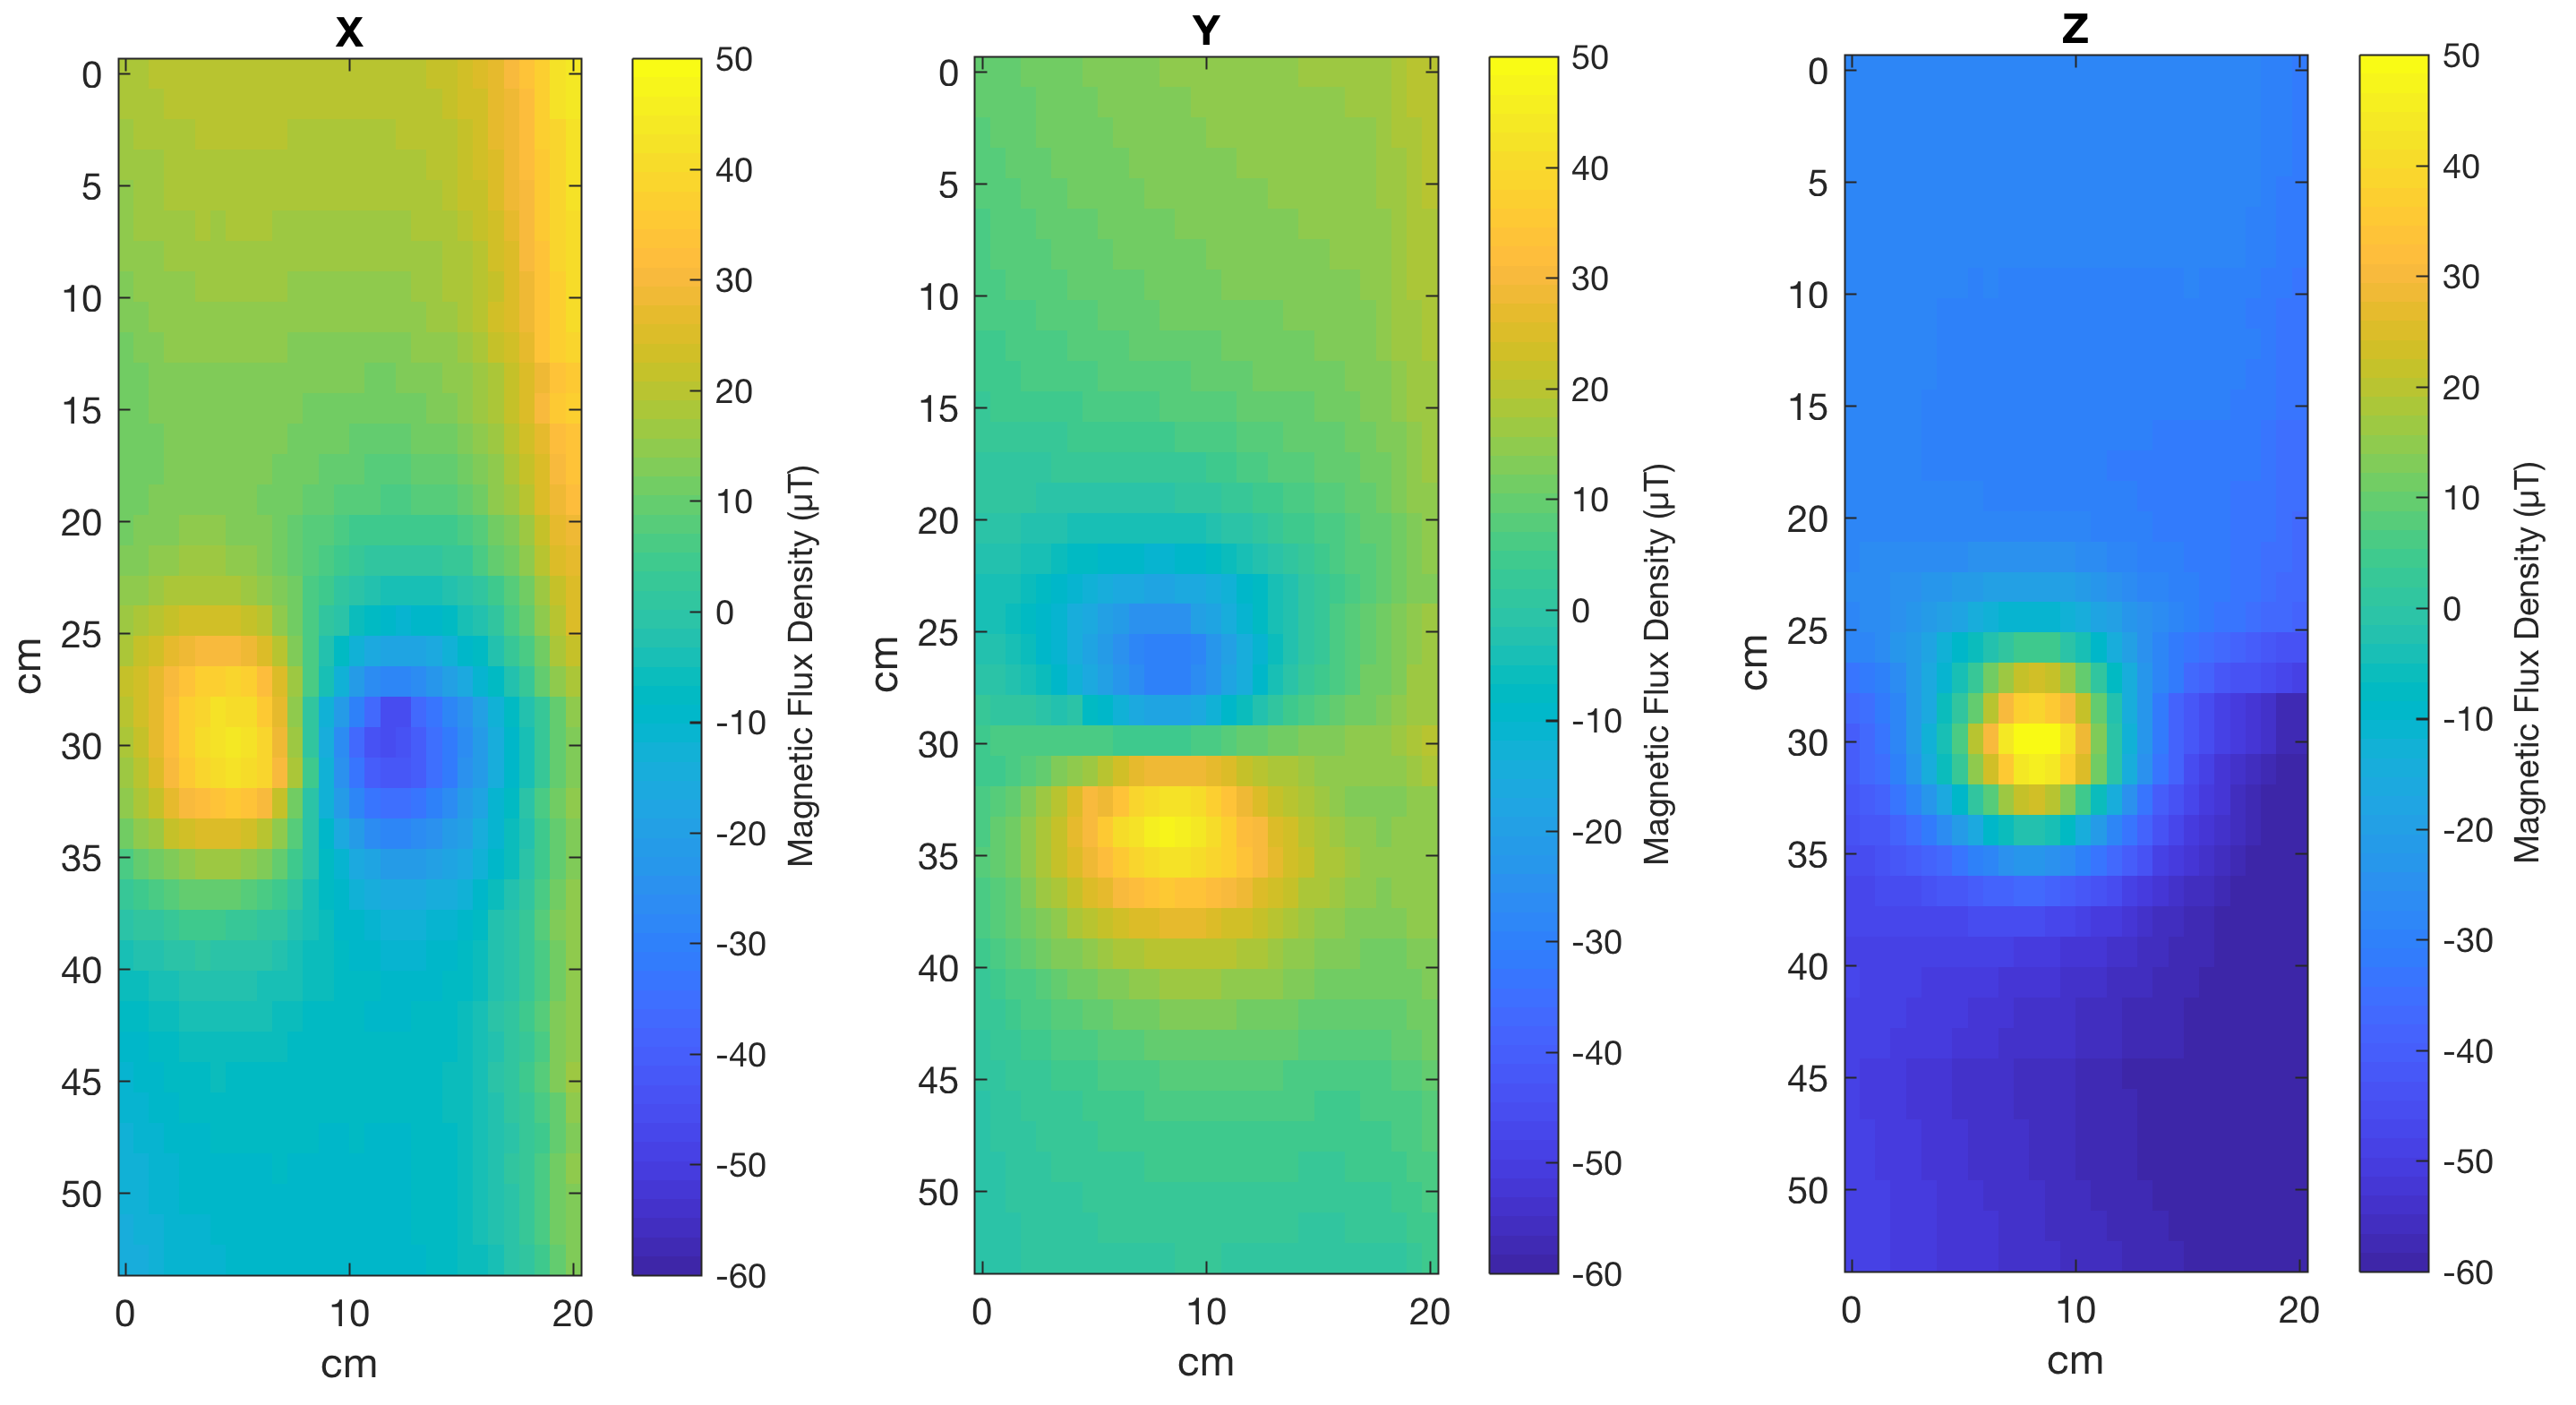
This exercise is intended to help students to understand how to scan the magnetic anomaly of three disk-shaped Y10 magnets underneath a table. The experiment simulates a magnetic survey for subsurface structures. Continue reading “The Apple iPhone/MATLAB Mobile/LEGO MINDSTORMS Scanner, Part 2”
This exercise is intended to help students to understand how to scan the magnetic anomaly from three magnetic disks using a MATLAB/LEGO MINDSTORMS 2D scanner. Continue reading “MATLAB/LEGO MINDSTORMS Exercise #9 2D Scanning of a Magnetic Anomaly”
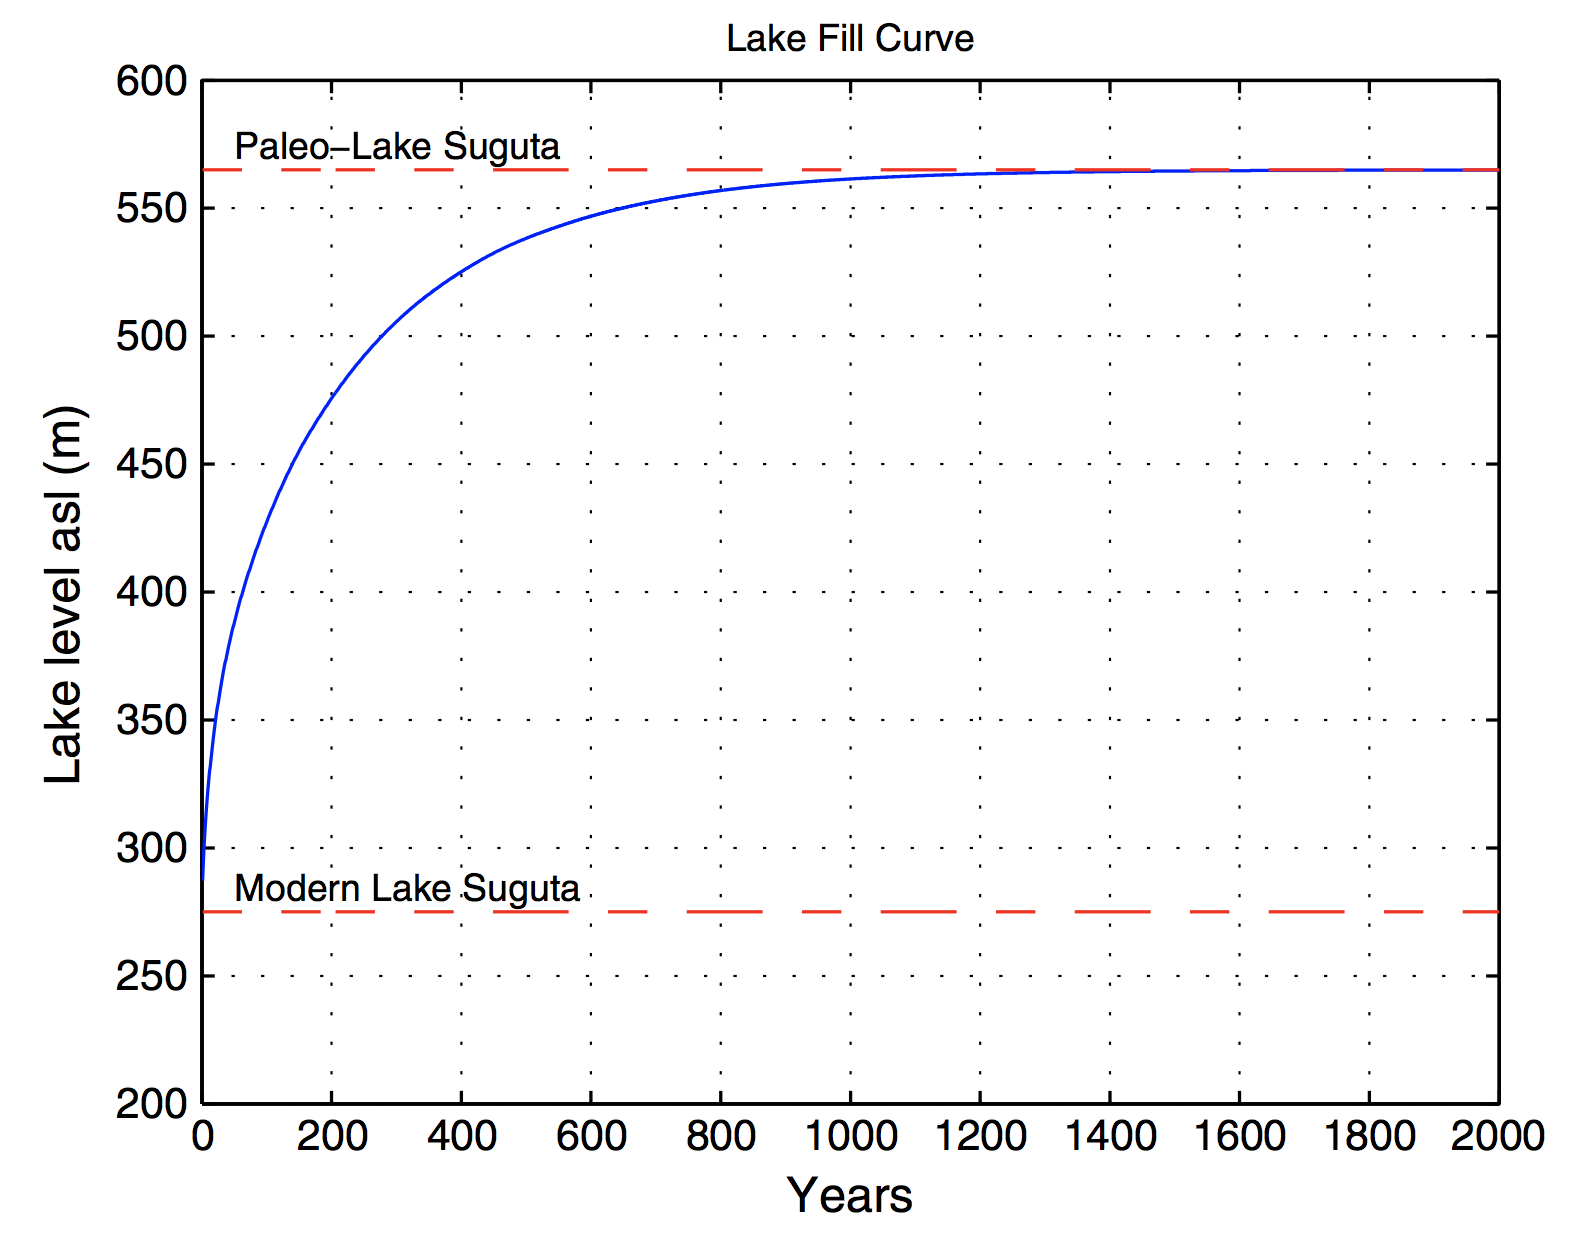
In a number of publications, we used a simple energy-based lake balance model to estimate precipitation and evaporation during highstands of paleolakes in Argentina and Kenya. The highstands were reconstructed from radiocarbon-dated paleoshorelines of landslide-dammed lakes and closed-basin rift lakes. Here we publish the MATLAB code to estimate the evaporation over land surface and water surface, which is the core of the lake-balance model used in our research. Continue reading “Lake-Balance Modeling Using MATLAB”
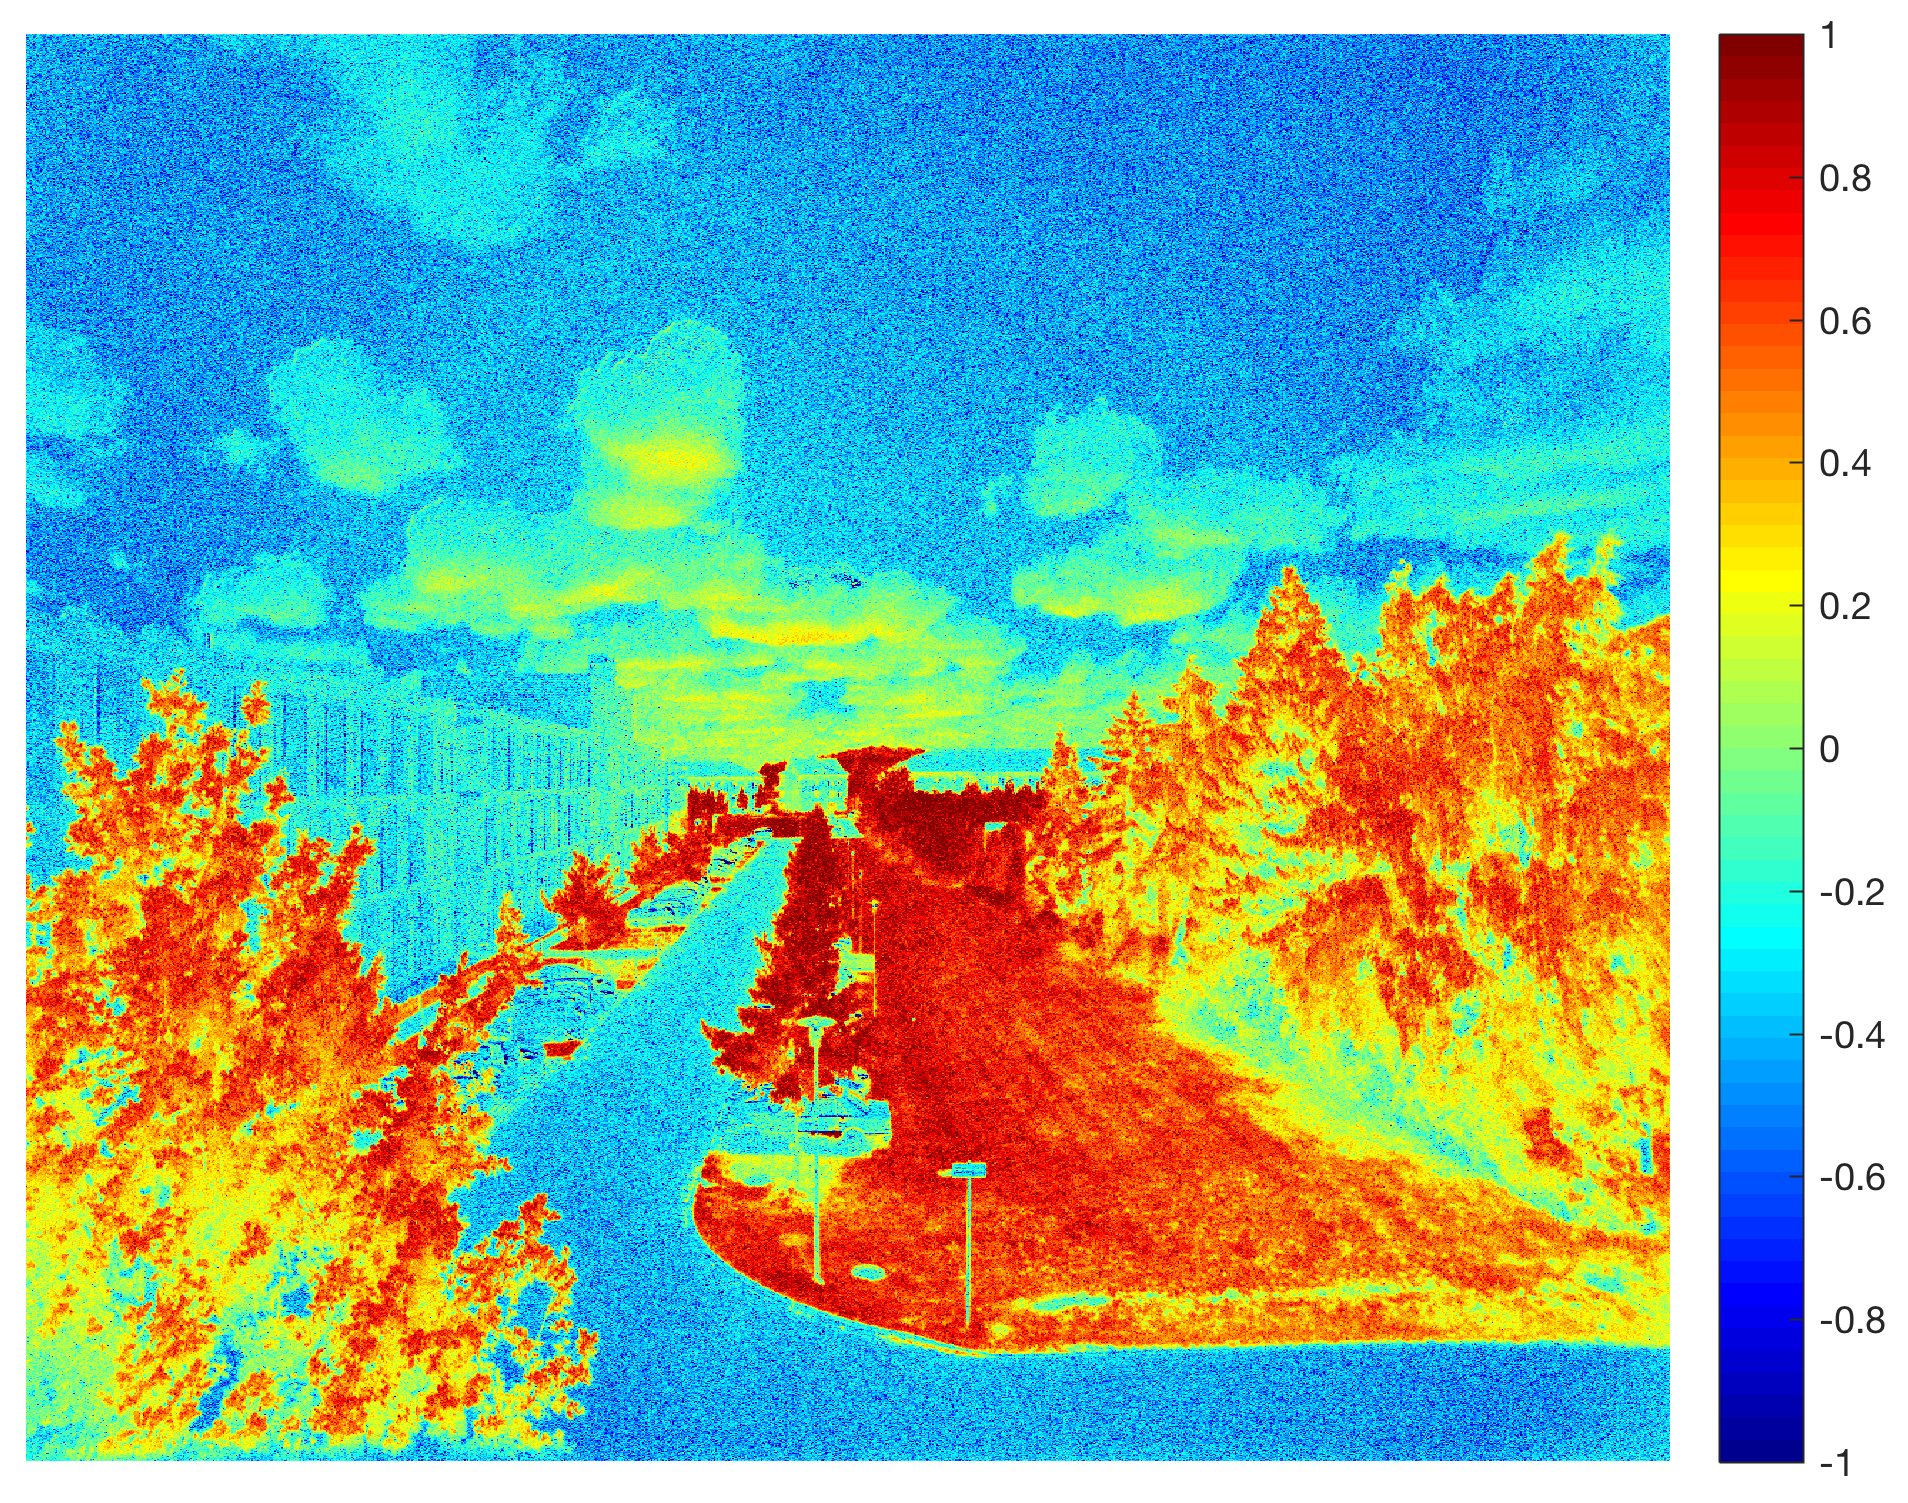
In an earlier post in March 2017 I explained how to capture NDVI Red+NIR images using a MAPIR Survey2 NDVI, to import the images into MATLAB and to calculate the Normalized Difference Vegetation Index. Here is the result of the experiment repeated in June 2017 during the growing season. Continue reading “Calculating the NDVI From Multispectral Camera Images Using MATLAB, Part 2”
In a series of blog posts, I will tell you a little about how I teach computational geosciences with MATLAB. On the second half of day 4 of the one-week course I teach to import, process, analyze and visualize spatial data. Continue reading “Teaching Computational Geosciences with MATLAB, Part 9: Spatial Data”
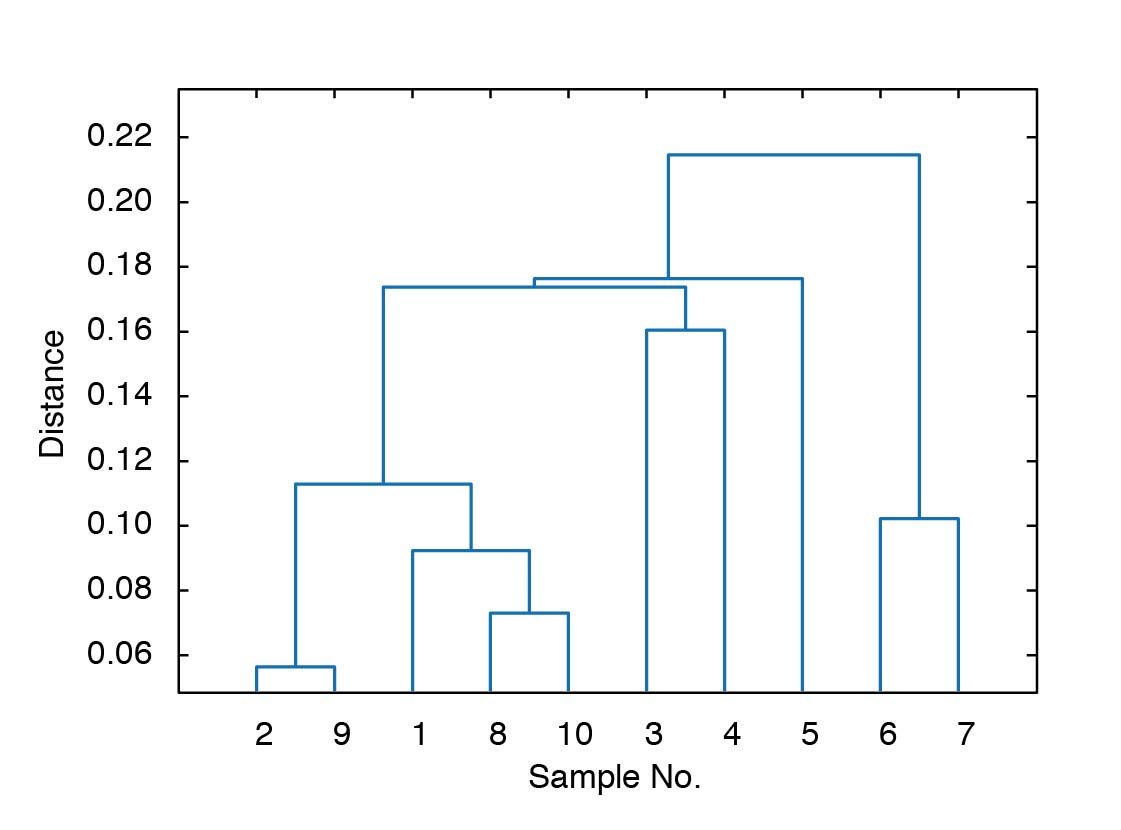
In a series of blog posts, I will tell you a little about how I teach computational geosciences with MATLAB. On the first half of day 4 of the one-week course I teach multivariate statistics. Continue reading “Teaching Computational Geosciences with MATLAB, Part 8: Multivariate Statistics”
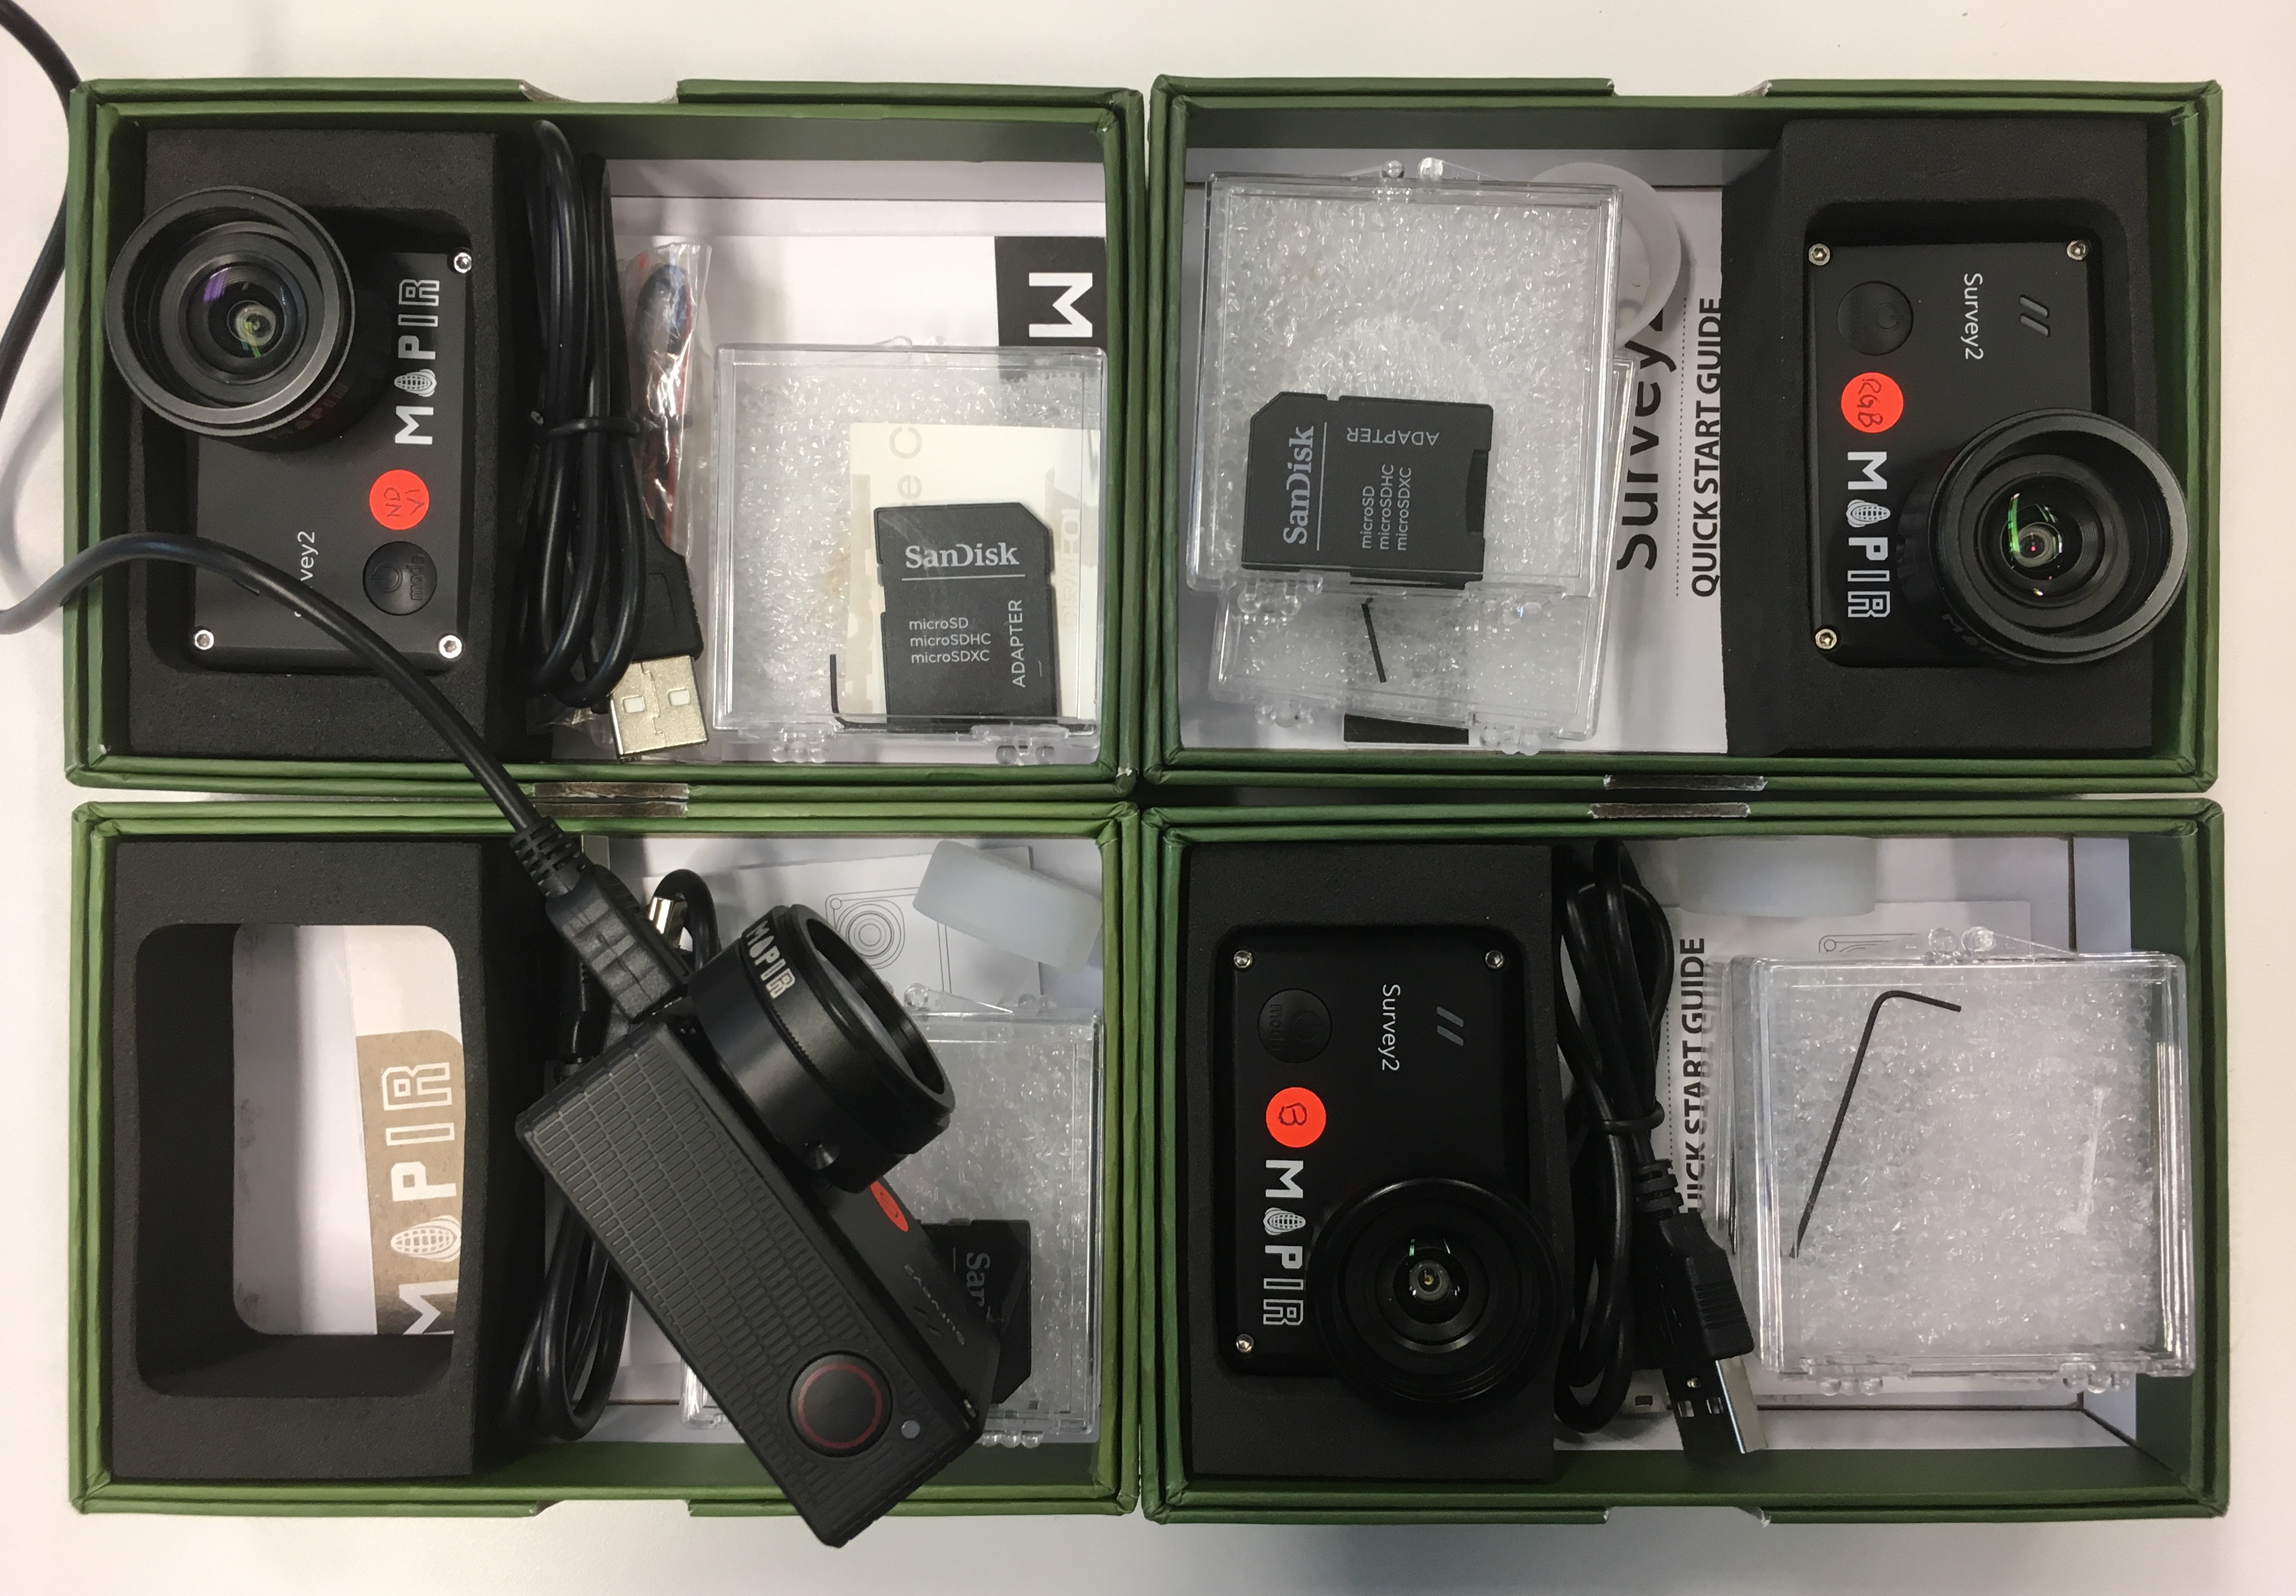
Today I received three more MAPIR Survey2 cameras to built a multispectral array. In addition to the MAPIR Survey2 NDVI Red+NIR (650 and 850 nm) camera using to calculate the the Normalized Difference Vegetation Index (as described in an earlier post) purchased in March I now have the Blue (450 nm), Green (550 nm) and Visible Light RGB (~370–650 nm). We use the four cameras to build a multispectral array, possibly mounted on drones, to determine various types of rocks and minerals on the ground. First experiments and results will be presented here shortly.