In 1994, as part of my doctorate, I programmed a graphical user interface for an adaptive filter using MATLAB. I have continued to develop the code over the past 30+ years. Here is the story of sustainable MATLAB code in four chapters.
Continue reading “Sustainable Code for GUI Tools / Apps with MATLAB”
Importing, Processing and Displaying EnMAP Hyperspectral Images with MATLAB
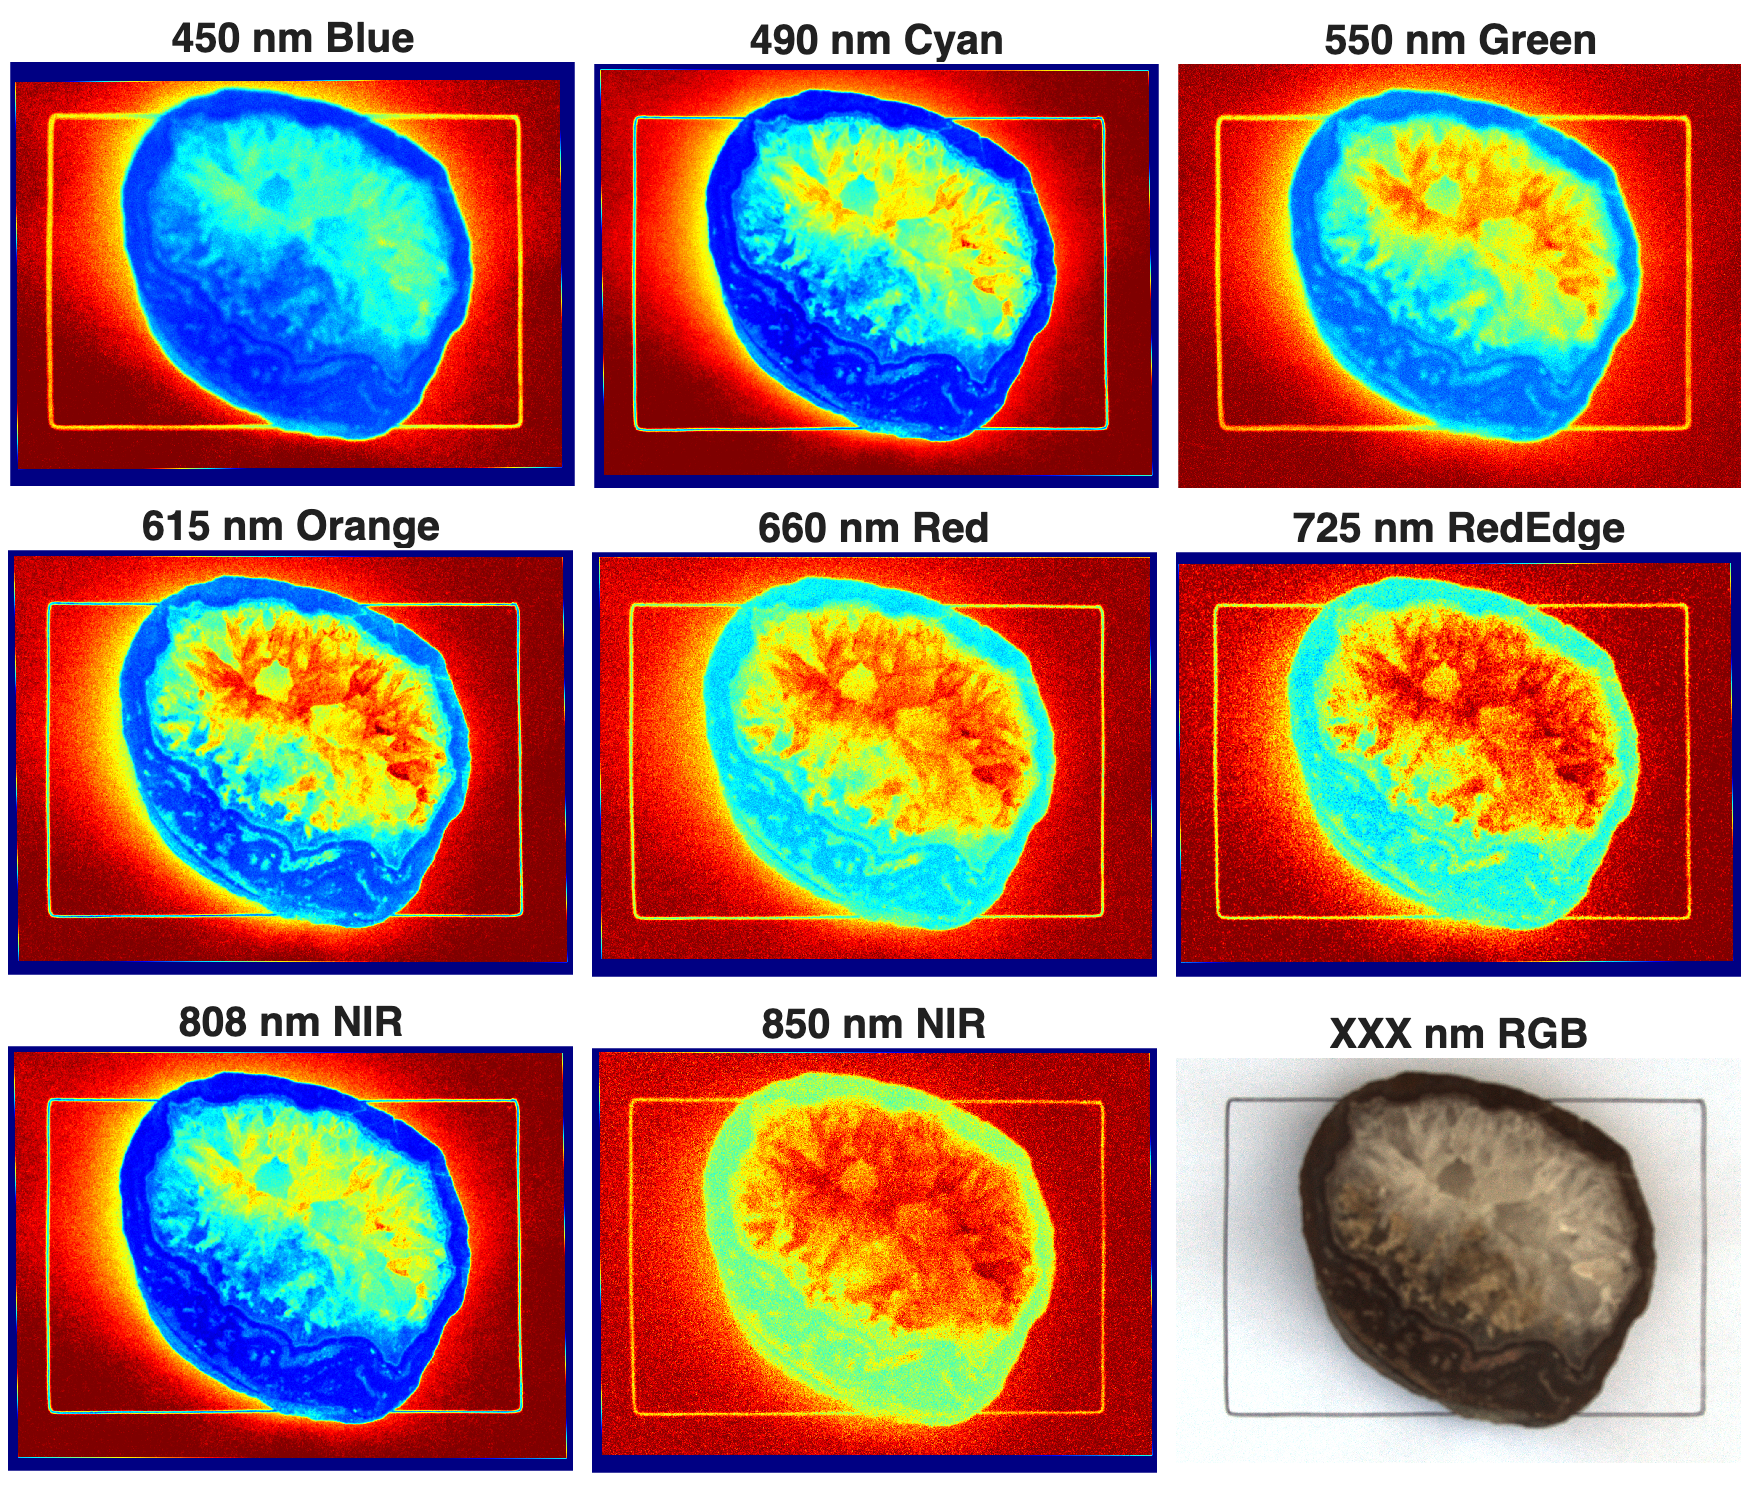
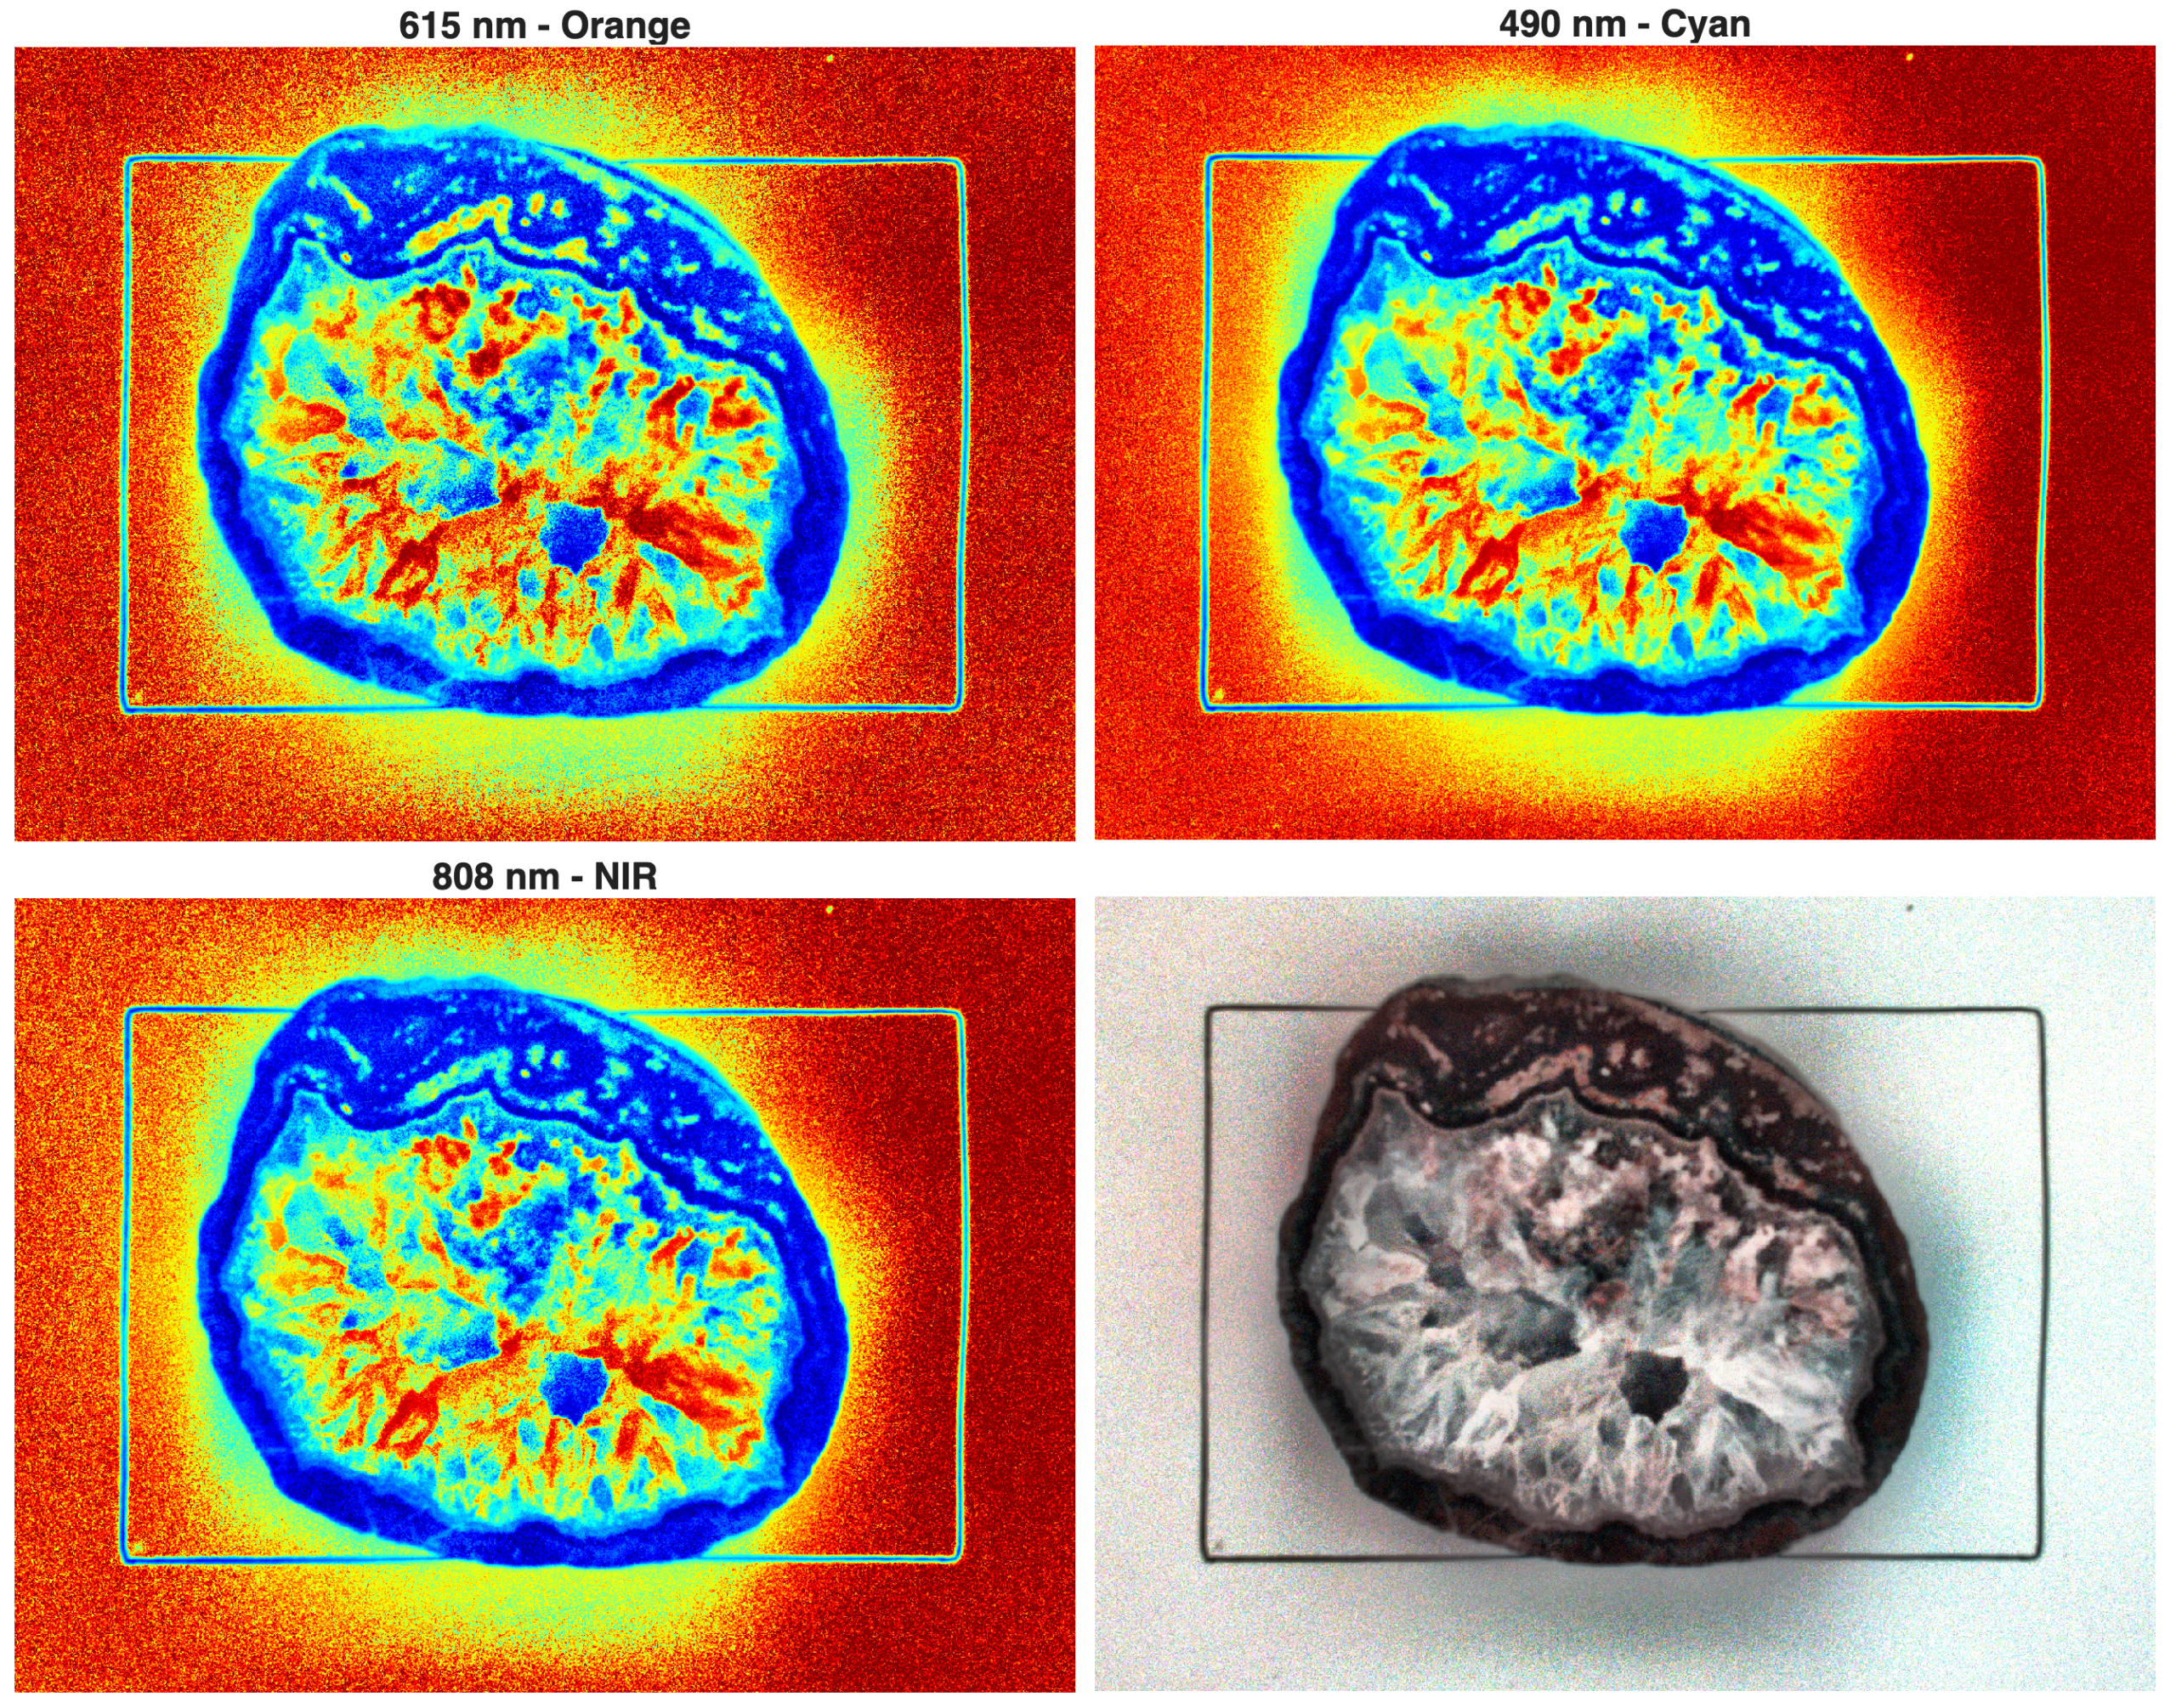
On April 1, 2022, a satellite was launched as part of the German Environmental Mapping and Analysis Program (EnMAP) to collect hyperspectral data, which can be obtained free of charge. Here is a MATLAB script to import and display the data.
Continue reading “Importing, Processing and Displaying EnMAP Hyperspectral Images with MATLAB”
Stratigraphic Correlation of Multiple Sediment Cores Using MATLAB, Part 2
In geological drilling projects, two or more parallel cores often collected in order to compensate for core losses during drilling by overlapping sequences. Correlation of the core is a time-consuming and complex process that is usually done by very experienced geologists. Yesterday I posted the script for manual correlation of core records based on visual inspection of the record of sediment physical properties. This post explains how to use dynamic time warping for automated correlation of cores. Continue reading “Stratigraphic Correlation of Multiple Sediment Cores Using MATLAB, Part 2”
Stratigraphic Correlation of Multiple Sediment Cores Using MATLAB, Part 1
In geological drilling projects, two or more parallel cores often collected in order to compensate for core losses during drilling by overlapping sequences. Correlation of the core is a time-consuming and complex process that is usually done by very experienced geologists. In the Chew Bahir Drilling Project in Ethiopia, as part of the Hominin Sites and Paleolakes Drilling Projects (HSPDP), two parallel, almost 280 m long cores were collected in late 2014. The two cores are correlated using the Correlator software, which is part of the CoreWall package, but we also make experiments using manual and automated correlation using MATLAB. Here I present a script to perform a visual inspection and correlation of two cores using physical properties of the sediment such as the magnetic susceptibility. Continue reading “Stratigraphic Correlation of Multiple Sediment Cores Using MATLAB, Part 1”
Using Scholar AI to Synthetize Scientific Literature, Part 2
AI tools are rapidly changing and improving, we repeated the 16 June 2024 experiment about eight months later and got a completely different result, as can be seen in the report from 3 February 2025. Continue reading “Using Scholar AI to Synthetize Scientific Literature, Part 2”
Creating Better Scientific Posters, Part 4
It’s been a while since I wrote about posters. Right now I’m working on an update of the MDRES book and so I had to deal with the topic again. The following text deals with the presentation of posters. Continue reading “Creating Better Scientific Posters, Part 4”
Evolutionary Lomb-Scargle Power Spectral Analysis with MATLAB
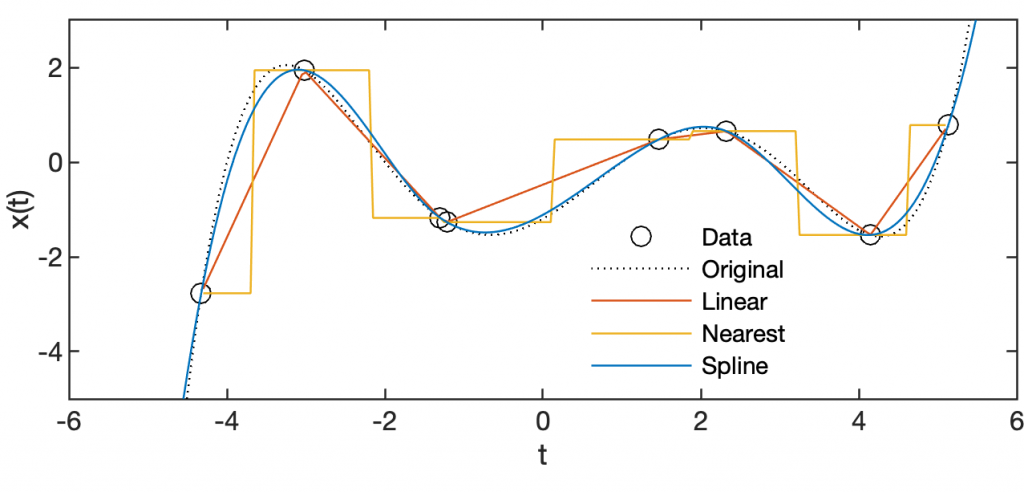
In paleoclimate time series amplitude of spectral peaks usually varies with time. Evolutionary power spectral analysis such as the FFT-based spectrogram and wavelet power spectral analysis helps. These methods, however, require interpolation of the time series to a grid of evenly-spaced times. Instead we can use the Lomb-Scargle Method for unevenly-spaced spectral analysis, computed for a sliding window, to map changes of the cyclicities through time.
Continue reading “Evolutionary Lomb-Scargle Power Spectral Analysis with MATLAB”
Adaptive Filters in Paleoclimatology: Measure it Twice!
Time series of stable isotopes (oxygen, carbon) measured at foraminifers are often very noisy due to the combined effect of low sedimentation rates, intensive bioturbation and small sample sizes (5-20 foraminifers). Adaptive filters may help to increase the signal-to-noise ratio of such time series where conventional methods such as fixed filters cannot be applied if optimal filtering is to be achieved, because the signal-to-noise ratio is unknown and varies with time. Continue reading “Adaptive Filters in Paleoclimatology: Measure it Twice!”