In two weeks scientists from the Chew Bahir project will meet in the Virtual Space to discuss the latest results of the 290 m long ICDP cores from S Ethiopia. Continue reading “Sixth Chew Bahir Drilling Project Workshop in the Virtual Space”

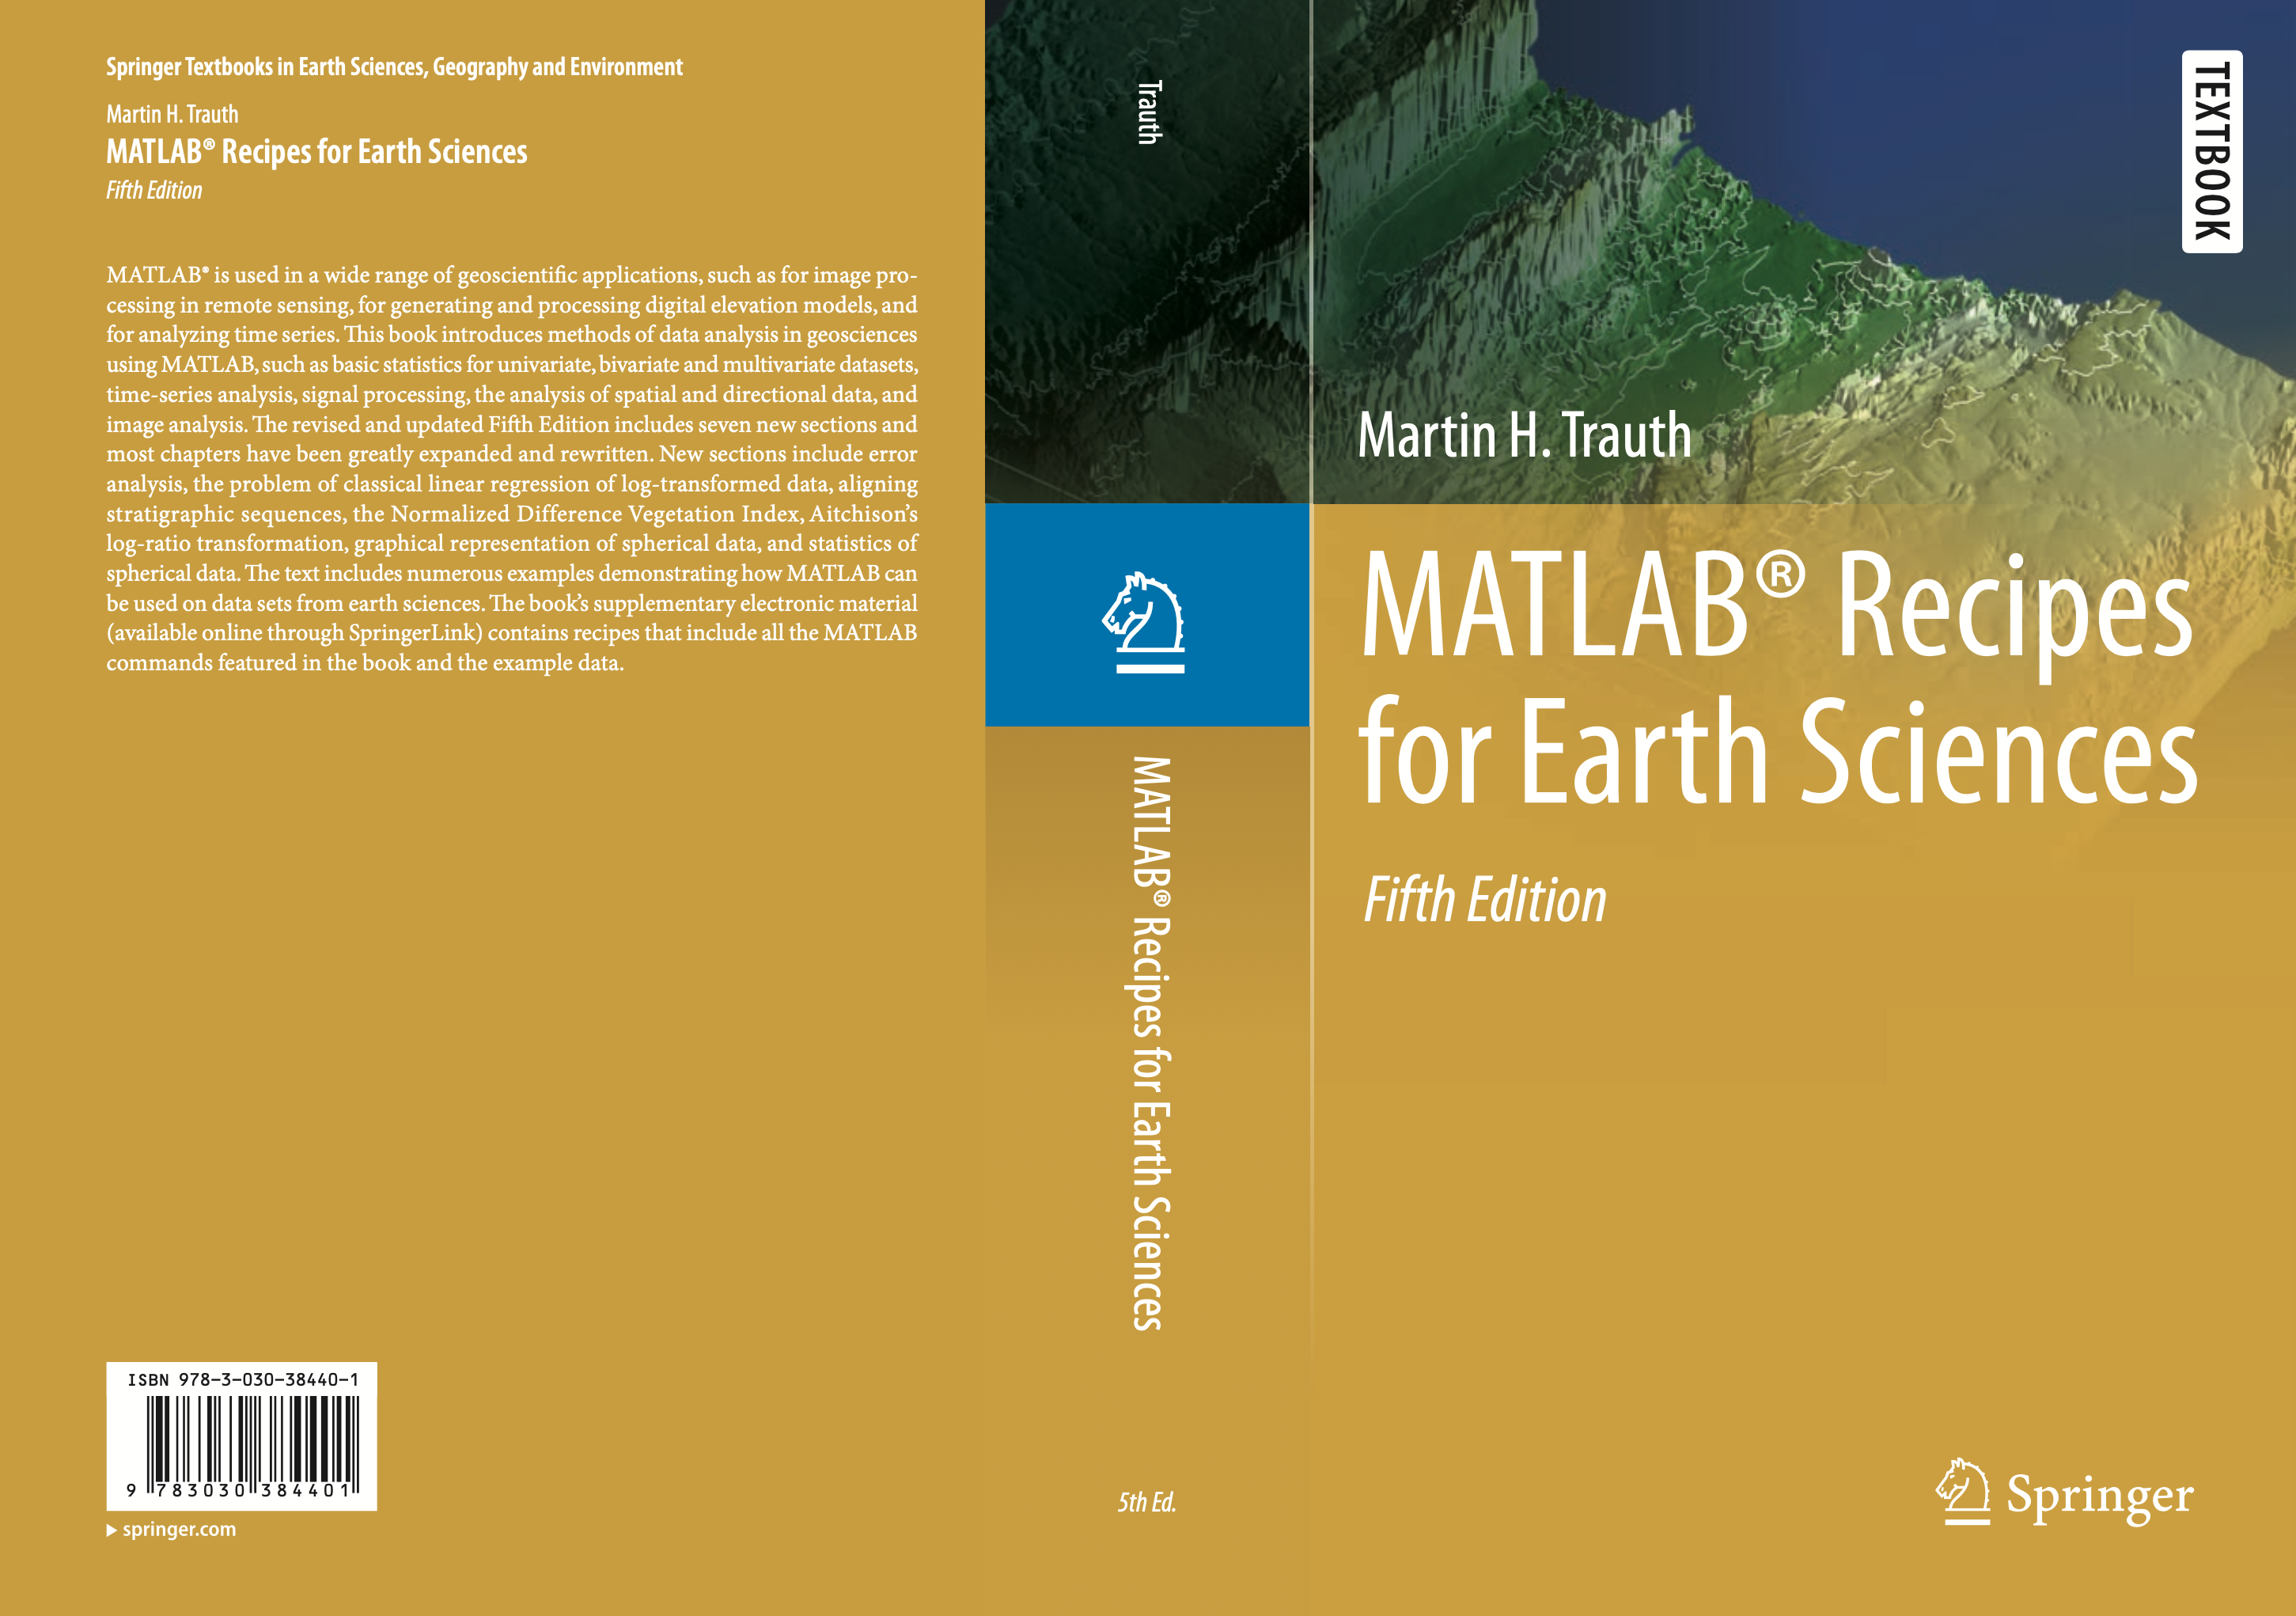
MATLAB and Python Recipes for Earth Sciences
Martin H. Trauth, University of Potsdam, Germany
In two weeks scientists from the Chew Bahir project will meet in the Virtual Space to discuss the latest results of the 290 m long ICDP cores from S Ethiopia. Continue reading “Sixth Chew Bahir Drilling Project Workshop in the Virtual Space”
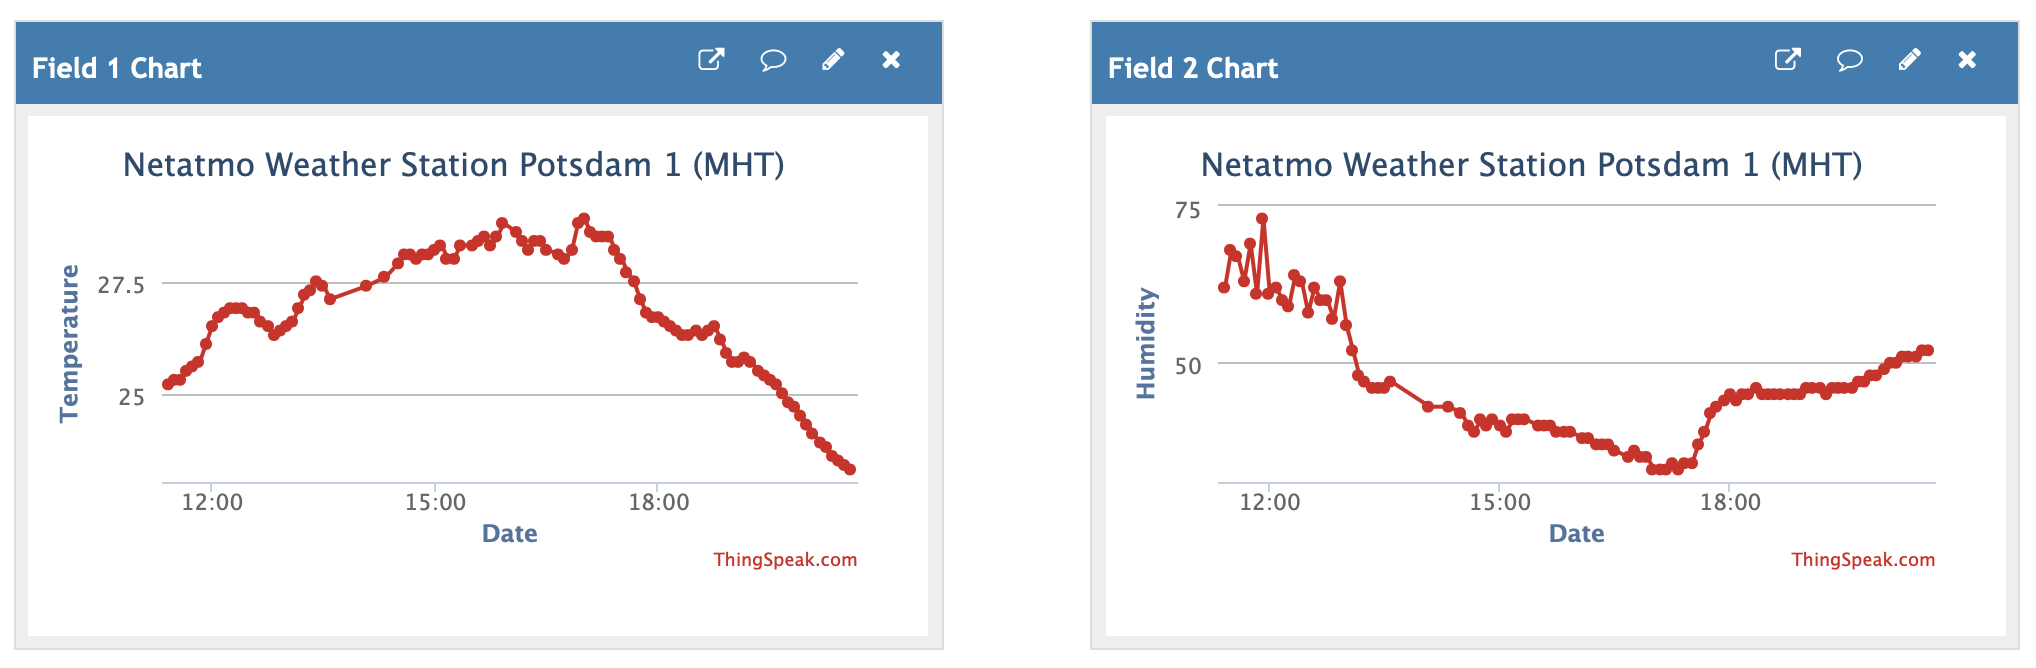
Reading meteorological parameters through a weather station connected to the Internet has gained great popularity. Here’s an example of how to set up a weather station, connect it to ThingSpeak and display the time series. We use the inexpensive and very popular Smart Weather Station from Netatmo in this experiment. Continue reading “ThingSpeak IoT Weather Station”
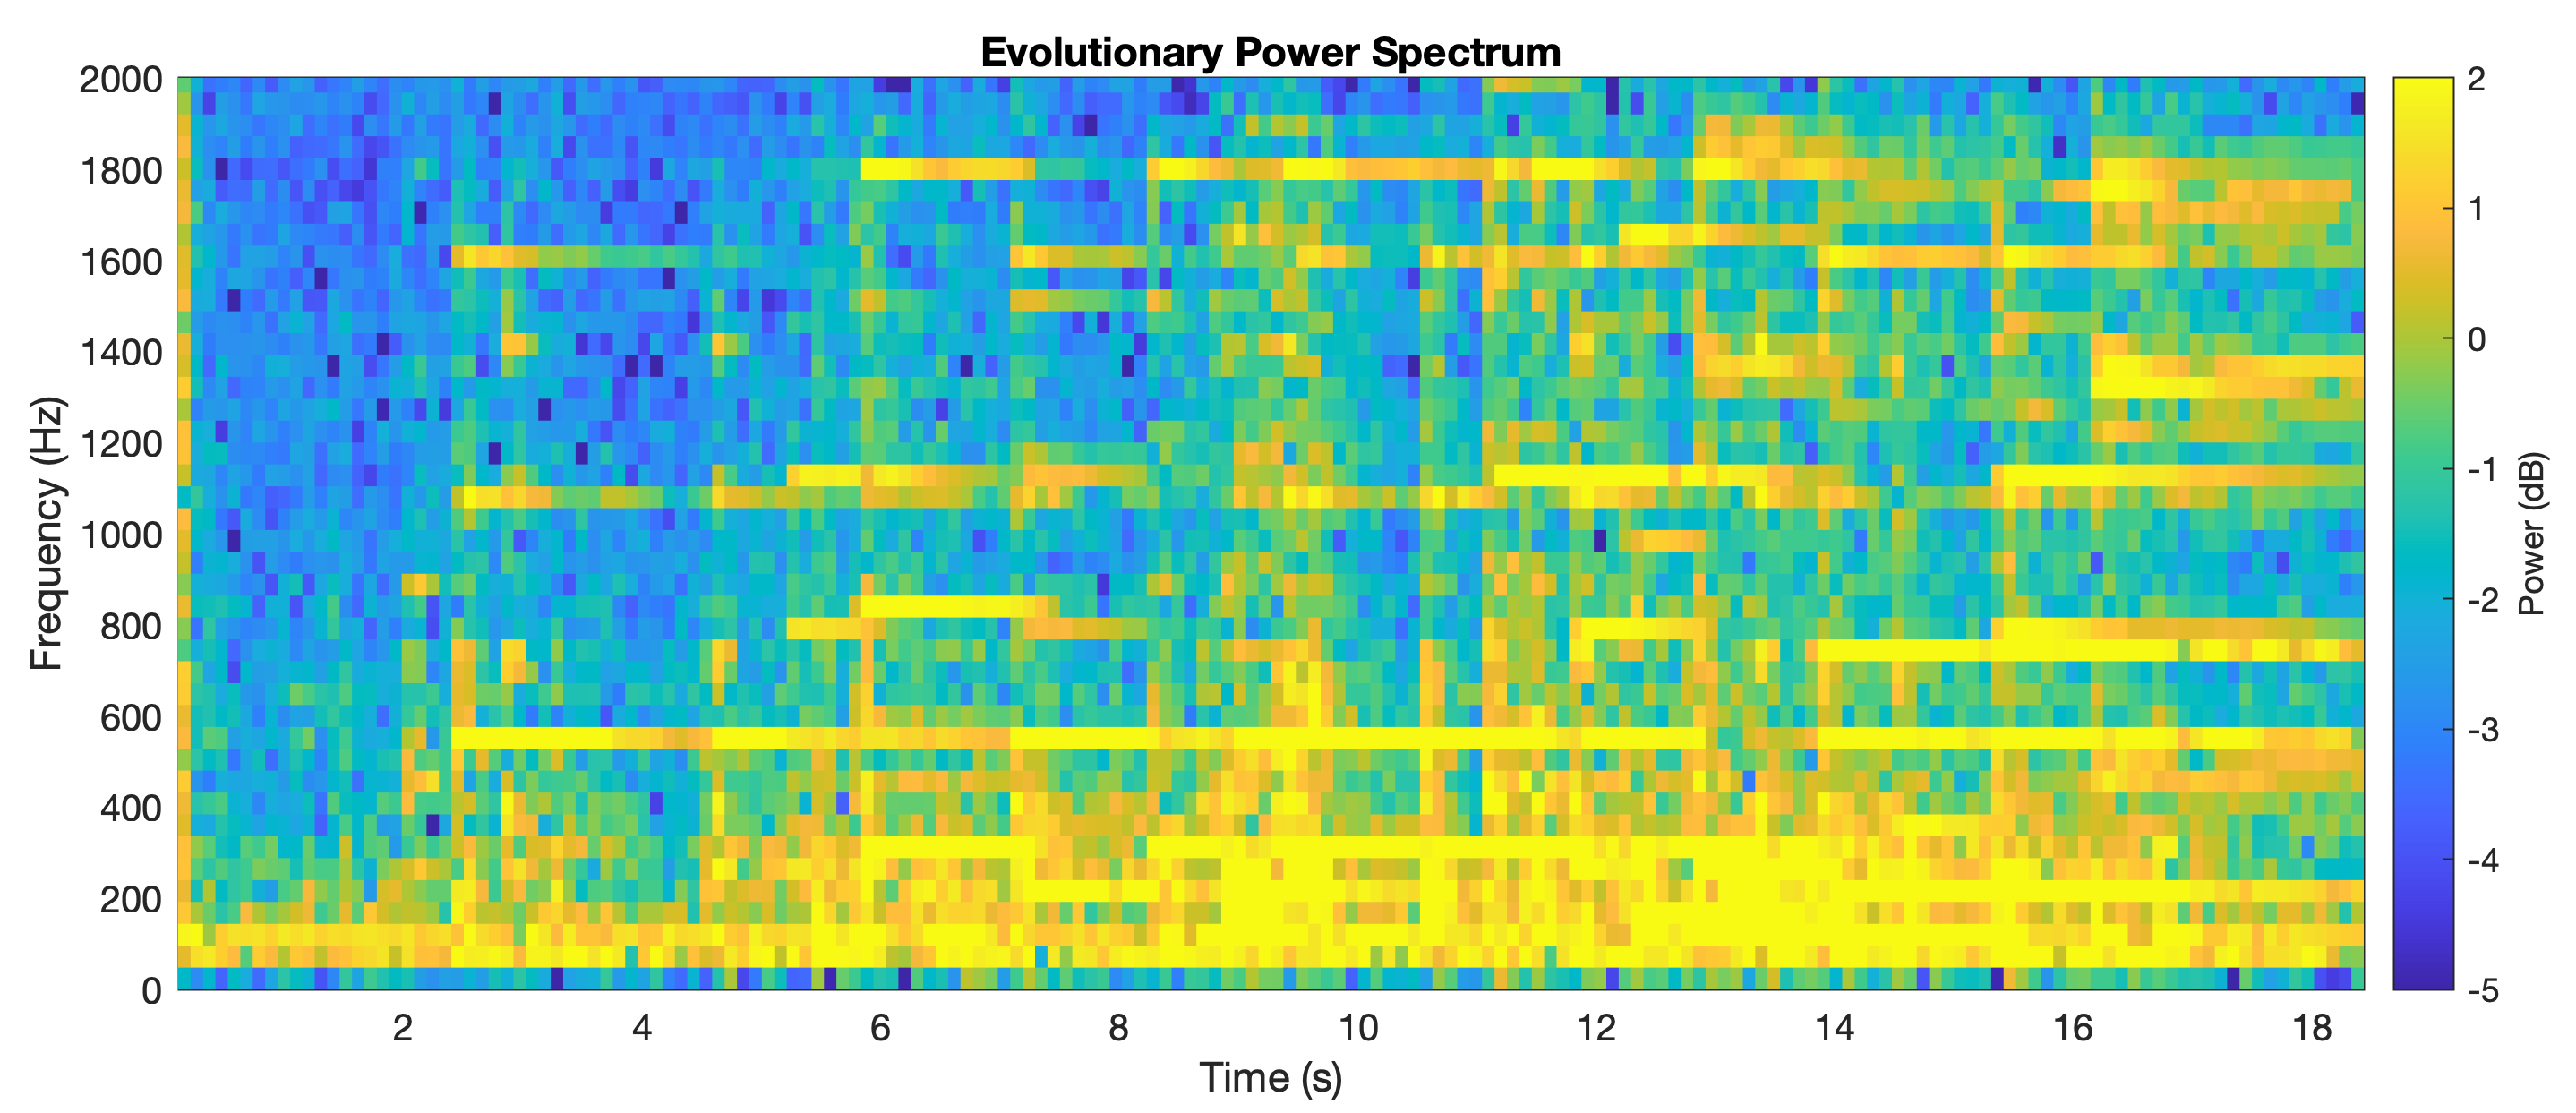
Computing the evolutionary spectrum of a short piano piece helps to recognize that music is the result of a complex interplay of temporal and spectral changes of sound. The MATLAB Audio Toolbox has numerous useful functions for spectrally analyzing music. Continue reading “Analyzing Music in the Time and Frequency Domain using MATLAB”
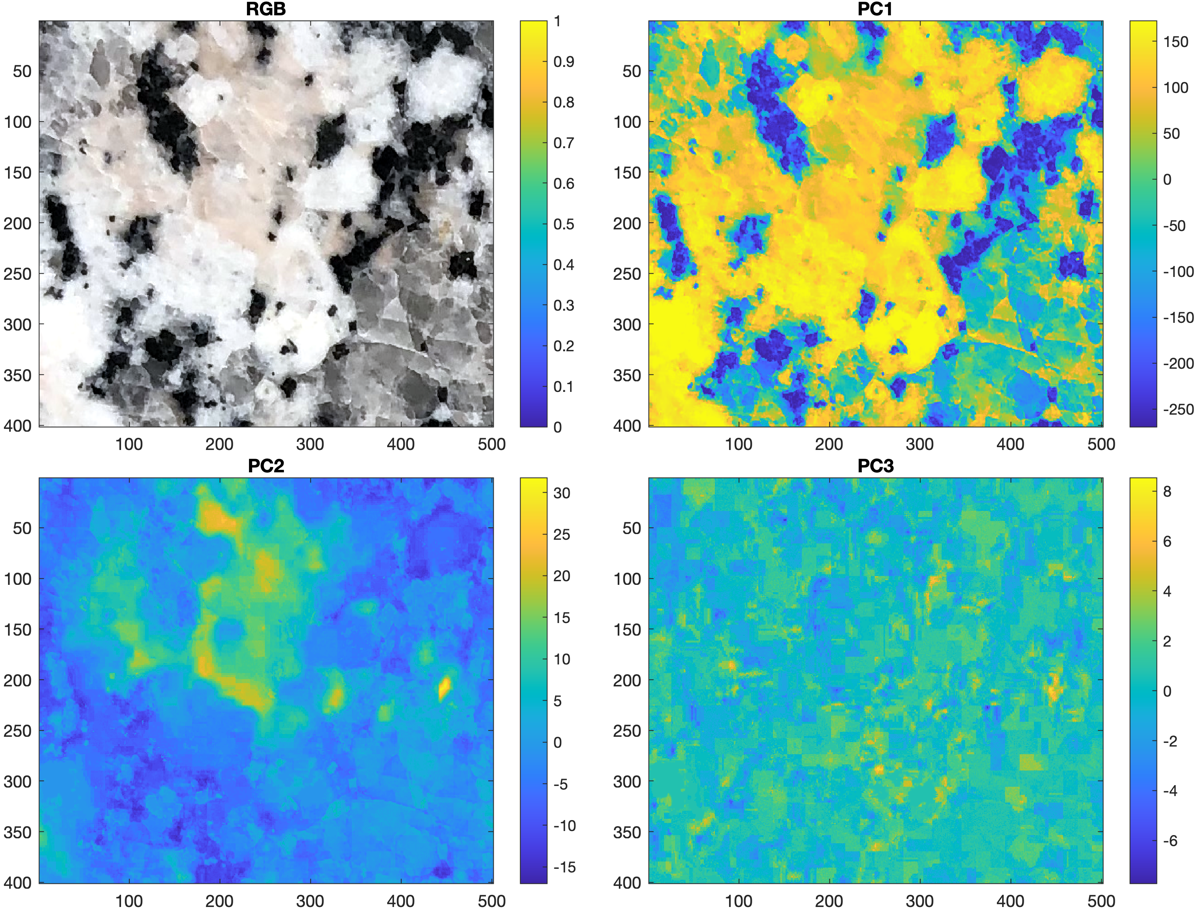
Color is an uncertain characteristic for the determination of minerals. Many minerals occur in a variety of different colors. Examples are quartz with its color variants amethyst, rose quartz or smoky quartz or feldspar with color variants like amazonite. However, if the minerals in a rock are reliably determined, their different coloring can be used to quantify them. In this example we use a simple RGB photo taken with a smartphone to determine the amounts of quartz, plagioclase, alkali feldspar and dark minerals such as biotite and hornblende in granite. To facilitate the differentiation of minerals, we use a principal component analysis (PCA), which is also used to unmix and classify spectral images such as satellite images (Trauth, 2020).
Color is an uncertain characteristic for the determination of minerals. Many minerals occur in a variety of different colors. Examples are quartz with its color variants amethyst, rose quartz or smoky quartz or feldspar with color variants like amazonite. However, if the minerals in a rock are reliably determined, their different coloring can be used to quantify them. Continue reading “MRES Exercise #14 PCA To Classify Minerals in Granite”
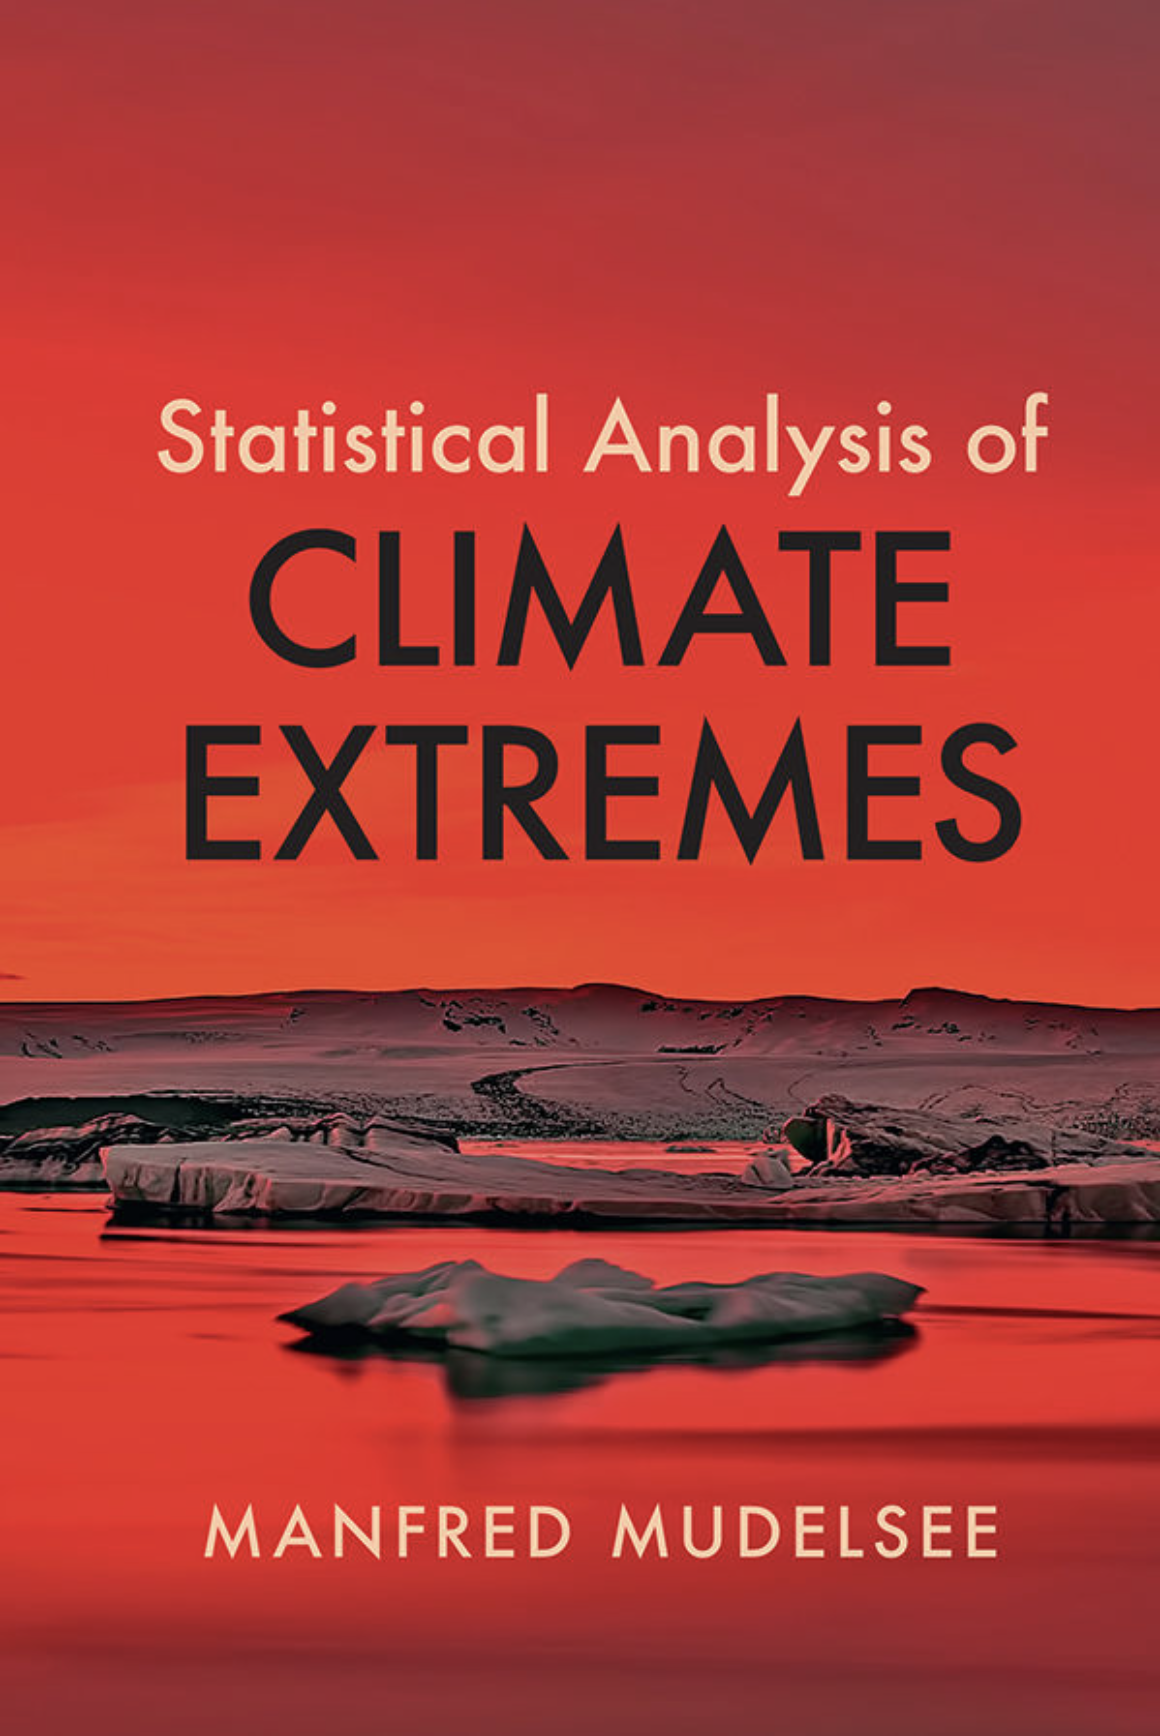
My colleague and friend Manfred Mudelsee has just published a remarkable book on the statistical analysis of climate extremes with Cambridge University Press. It is Manfred’s second book, after his very successful book on climate time series analysis (Springer, 2nd Edition, 2014). Continue reading “A New Book on Climate Extremes by Manfred Mudelsee”
During the worldwide SARS-CoV-2 pandemic, teaching at universities changed fundamentally within a few days. This also has an impact on the traditional MRES compact courses, which are now offered entirely online! The interactive online seminar on MATLAB Recipes for Earth Sciences will be held on 14–18 September 2020 (in English language) and 28 September–2 October 2020 (in German language).
Continue reading “50th and 51st Shortcourse on MRES – Interactive Online Seminars”
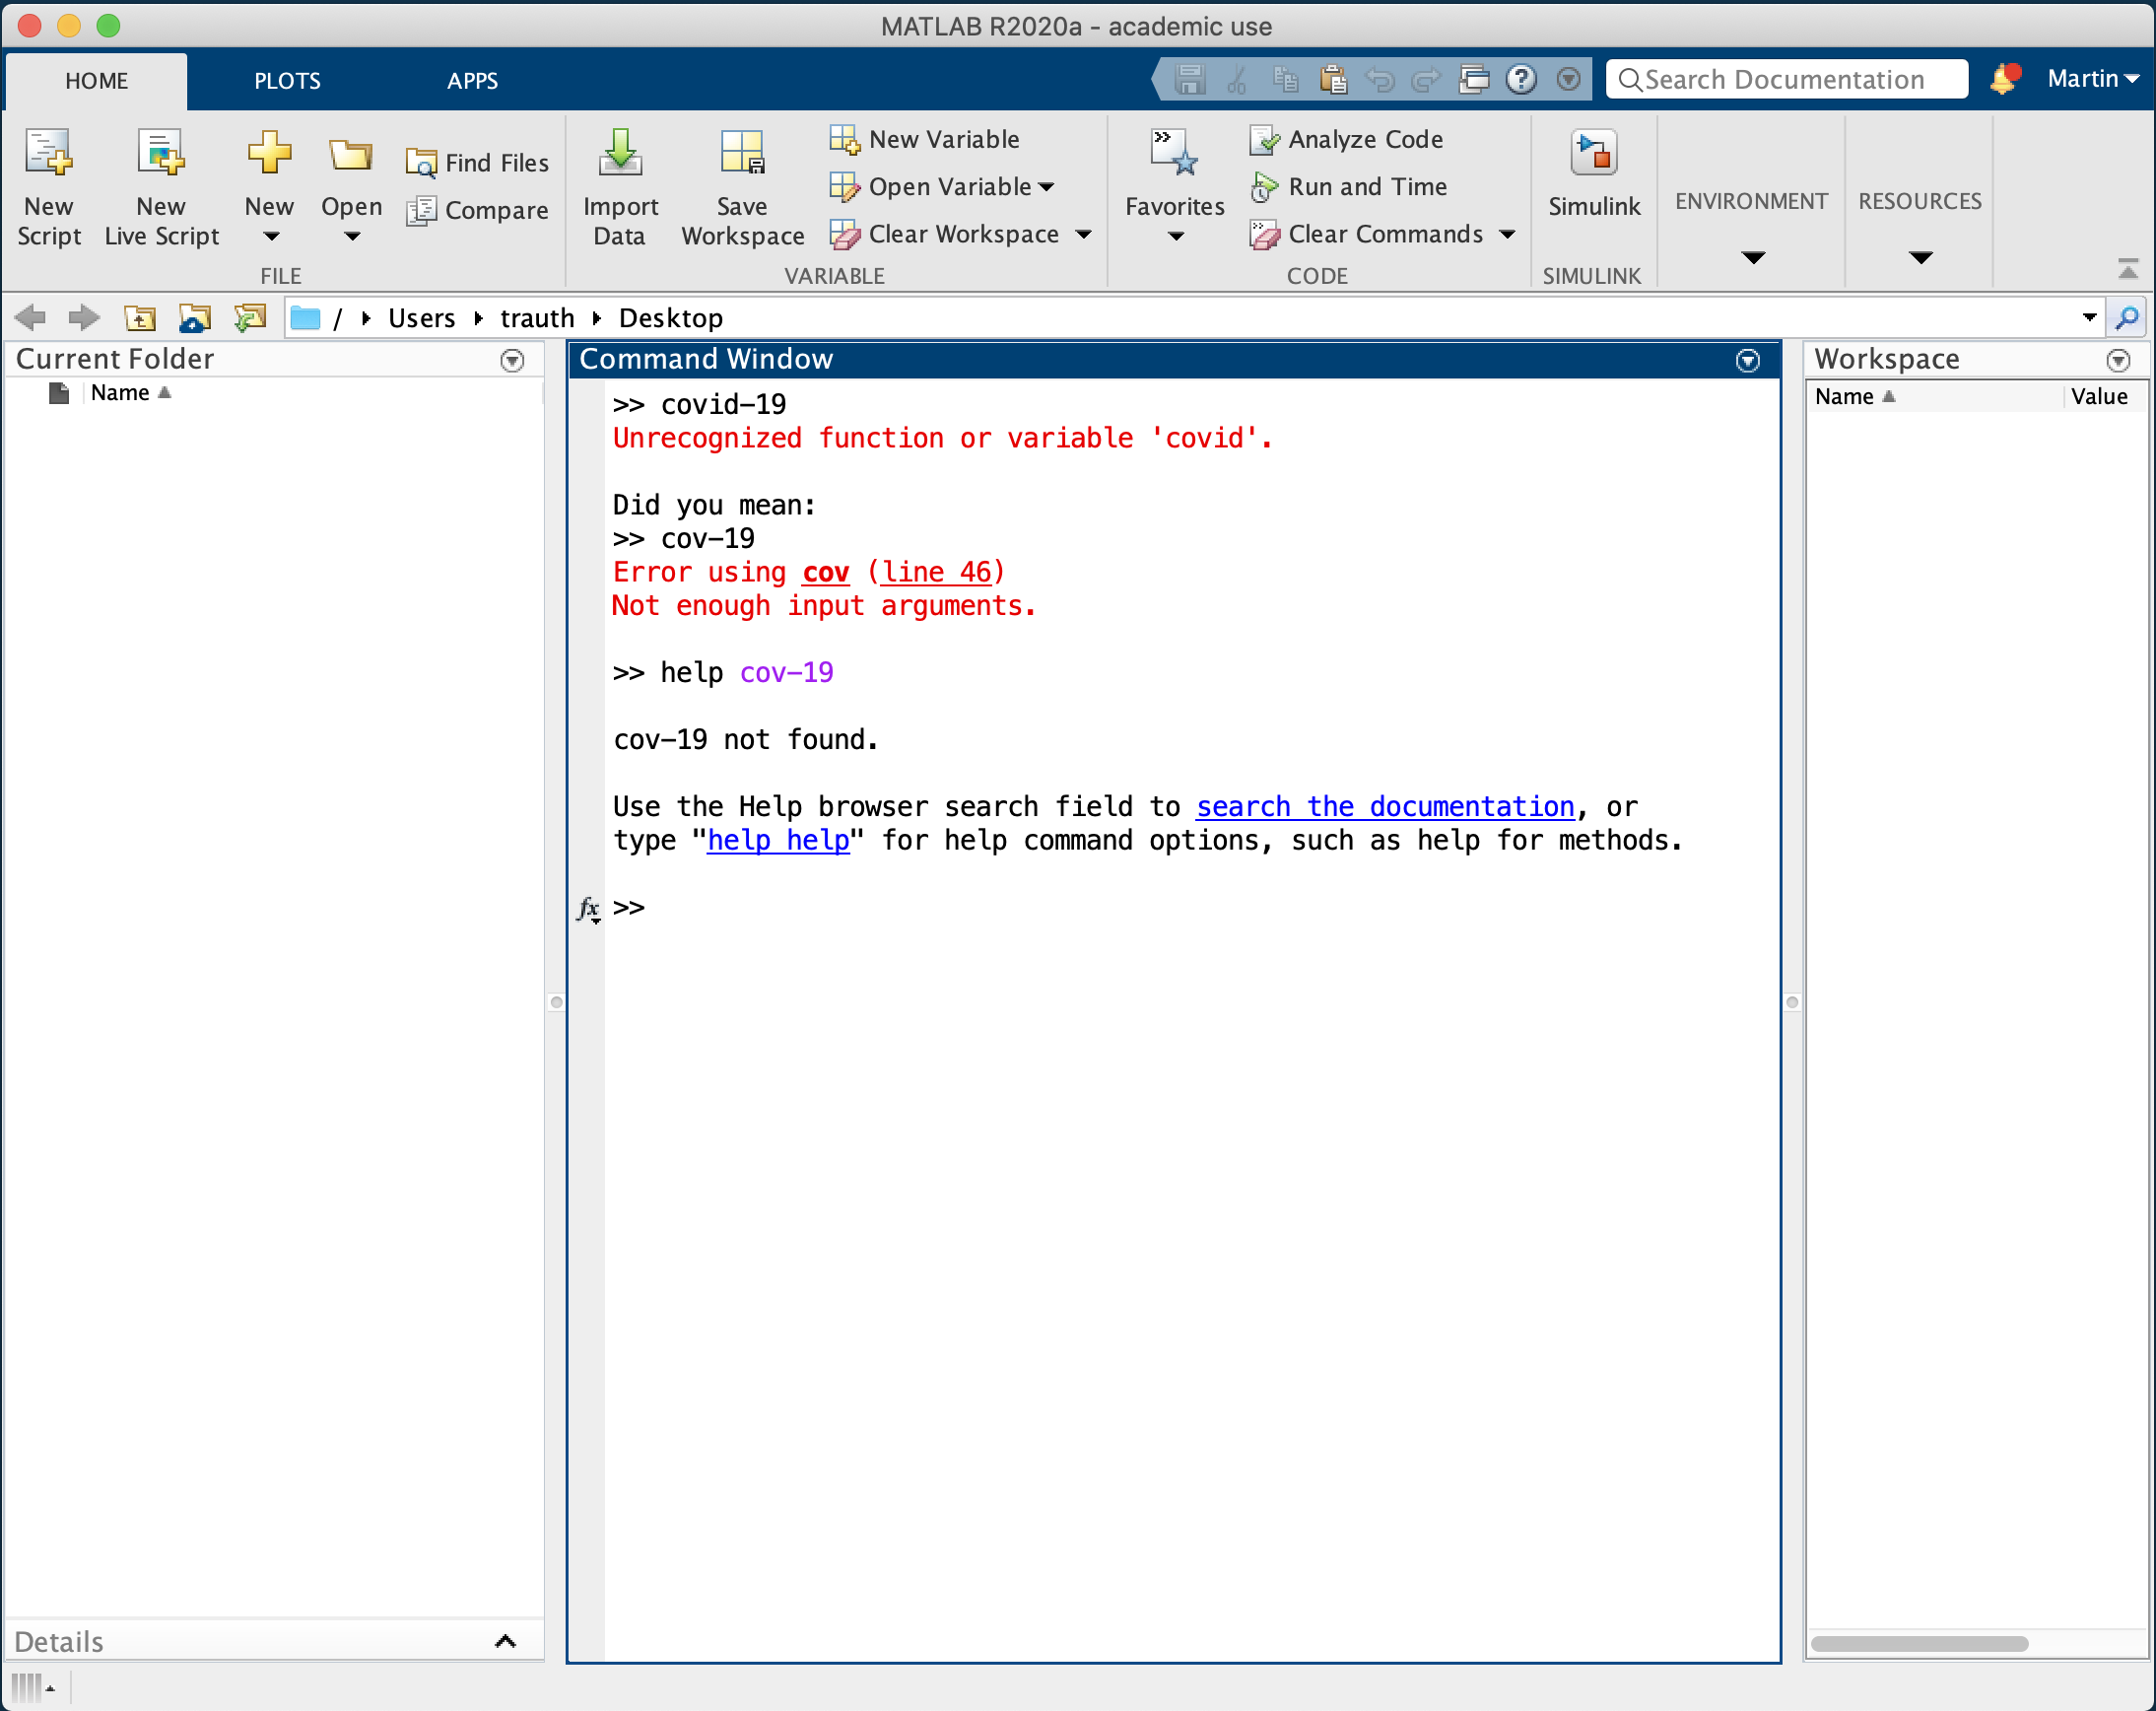
During the worldwide Sars-COV-2 pandemic, teaching in schools and universities changed fundamentally within a few days. Here are first experiences in teaching and learning with MATLAB. Continue reading “Teaching Data Analysis with MATLAB in COVID-19 Times”