
On April 1, 2022, a satellite was launched as part of the German Environmental Mapping and Analysis Program (EnMAP) to collect hyperspectral data, which can be obtained free of charge. Here is a MATLAB script to import and display the data.
The EnMAP satellite acquires 224 spectral bands in the range between 420 nm and 2450 nm with a ground resolution of 30 m x 30 m. The data are free of charge, but you have to apply for permission to include new images. The free EnMAP-Box is available for use with QGIS for data evaluation.
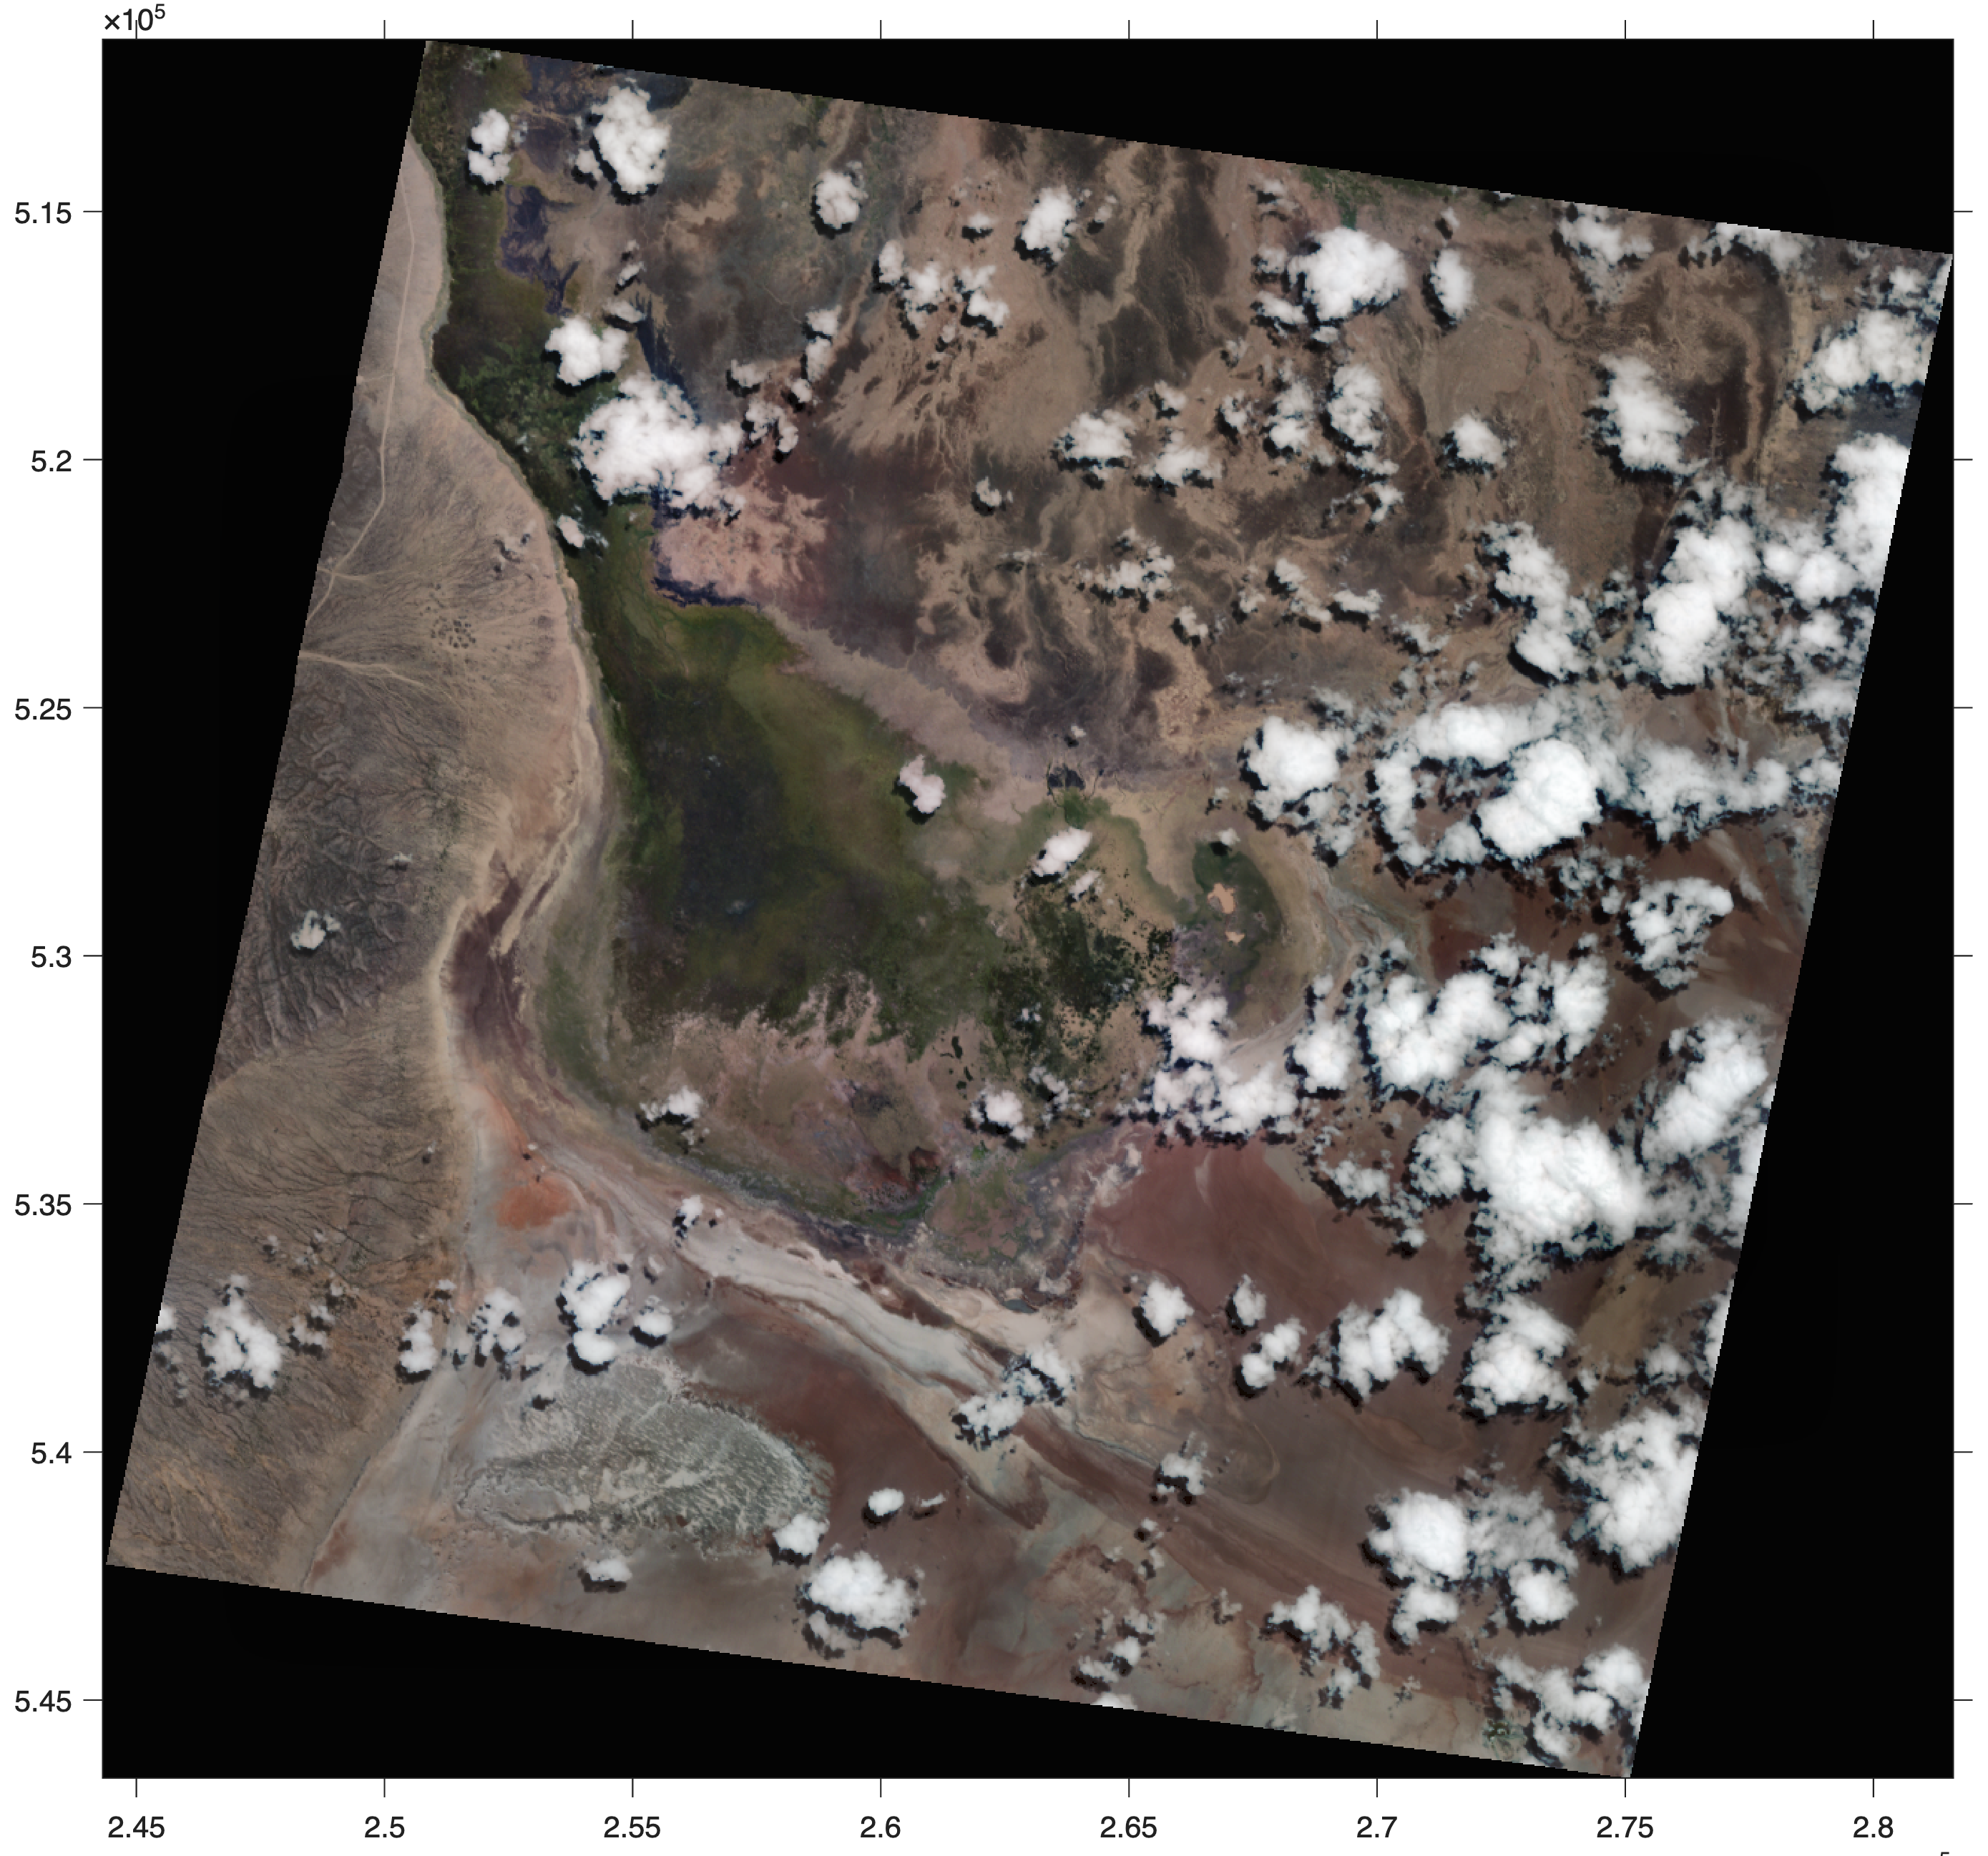
However, the data can also be analyzed with MATLAB, for which there is a Hyperspectral Imaging Library available for the Image Processing Toolbox, released by MathWorks. As an example, we download an image (369.9 MB) that we took as part of our project in Chew Bahir in the southern Ethiopian Rift.
We first define the names of the files with the metadata and the spectral data using
clear, clc, close all

filename_metadata = ...
   ['ENMAP01-____L2A-DT0000038475_',...
   '20230831T083041Z_',...
   '003_V010400_202311',...
   '07T163005Z-METADATA.XML'];

filename_spectrum = ...
   ['ENMAP01-____L2A-DT0000038475_',...
   '20230831T083041Z_',...
   '003_V010400_202311',...
   '07T163005Z-SPECTRAL_IMAGE.TIF'];
opts = xmlImportOptions(...
   "VariableSelectors",...
   "//wavelengthCenterOfBand");

wavelengths = readtable(filename_metadata,opts);

wv = table2array(wavelengths);
wv = str2double(wv);

clear opts wavelengths
hcube = geohypercube(filename_spectrum);
datacube = gather(hcube);
R = hcube.Metadata.RasterReference;
xlimits = R.XWorldLimits;
ylimits = R.YWorldLimits;
I1(:,:,1) = datacube(:,:,38);
I1(:,:,2) = datacube(:,:,23);
I1(:,:,3) = datacube(:,:,12);
I2 = double(I1);
I2(I2 == -32768) = NaN;
I3 = I2/max(I2(:));
I4 = sqrt(I3);
We then further enhance the image for display by using an adaptive histogram equalization. Since the method replaces NaNs by zeros, it causes a long list of warnings. We therefore disable this specific type of warning before using adapthisteq.
warning('off','images:imhistc:inputHasNaNs')

I4(:,:,1) = adapthisteq(I4(:,:,1));
I4(:,:,2) = adapthisteq(I4(:,:,2));
I4(:,:,3) = adapthisteq(I4(:,:,3));
imshow(I4,...
   'XData',xlimits,...
   'YData',ylimits)
axis on
Groundtruthing is the next step to calibrate and validate the EnMAP data, sampling in the field and perform spectral measurements, either in the lab or in the field using Analytical Spectral Devices (ASD). You can then compare the measured spectra with the ones from the EnMAP image, using single pixels or flat fields, as described in two other blog posts.
Download example data and script
Download data and script (369.9 MB)
References
Chabrillat, S., Foerster, S., Segl, K., Beamish, A., Brell, M., Asadzadeh, S., Milewski, R., Ward, K.J., Brosinsky, A., Koch, K., Scheffler, D., Guillaso, S., Kokhanovsky, A., Roessner, S., Guanter, L., Kaufmann, H., Pinnel, N., Carmona, E., Storch, T., Hank, T., Berger, K., Wocher, M., Hostert, P., Linden, S. van der, Okujeni, A., Janz, A., Jakimow, B., Bracher, A., Soppa, M.A., Alvarado, L.M.A., Buddenbaum, H., Heim, B., Heiden, U., Moreno, J., Ong, C., Bohn, N., Green, R.O., Bachmann, M., Kokaly, R., Schodlok, M., Painter, T.H., Gascon, F., Buongiorno, F., Mottus, M., Brando, V.E., Feilhauer, H., Betz, M., Baur, S., Feckl, R., Schickling, A., Krieger, V., Bock, M., Porta, L.L., Fischer, S., 2024. The EnMAP spaceborne imaging spectroscopy mission: Initial scientific results two years after launch. Remote Sens. Environ. 315, 114379. https://doi.org/10.1016/j.rse.2024.114379
Guanter, L., Kaufmann, H., Segl, K., Foerster, S., Rogass, C., Chabrillat, S., Kuester, T., Hollstein, A., Rossner, G., Chlebek, C., Straif, C., Fischer, S., Schrader, S., Storch, T., Heiden, U., Mueller, A., Bachmann, M., Mühle, H., Müller, R., Habermeyer, M., Ohndorf, A., Hill, J., Buddenbaum, H., Hostert, P., Linden, S. van der, Leitão, P., Rabe, A., Doerffer, R., Krasemann, H., Xi, H., Mauser, W., Hank, T., Locherer, M., Rast, M., Staenz, K., Sang, B., 2015. The EnMAP Spaceborne Imaging Spectroscopy Mission for Earth Observation. Remote Sensing 7, 8830–8857. https://doi.org/10.3390/rs70708830
Trauth, M.H. (2025) MATLAB Recipes for Earth Sciences – Sixth Edition. Springer International Publishing, 567 p, https://doi.org/10.1007/978-3-031-57949-3.