
Young people—as I was back then—do not really appreciate how quickly their valuable data, painstakingly created graphics, and carefully crafted texts can become unreadable. Here are a few thoughts on this and a recommendation.
In the realm of geosciences, data collection has undergone a significant transformation, transitioning from analog to digital formats. Gone are the days when we relied on paper maps, held geological compasses to rocks, and manually recorded strike and dip of layers on maps. Field notebooks were filled with notes and sketches, and analog cameras captured images. Today, field trips are preceded by comprehensive surveys utilizing satellite remote sensing and digital terrain analysis. Critical localities are then targeted for ground-truthing, where handheld Fourier-transform infrared and X-ray fluorescence spectrometers are employed to determine rock properties. However, it’s important to acknowledge that the value of our older data remains undiminished.
Many of us, with decades of scientific experience, are actively engaged in digitizing old data, particularly when it’s only available in analog form. Instead of simply copying data from old to newer storage media, we open it with updated software versions and save it anew, ensuring its longevity for future generations. I still have some 5¼-inch floppy disks on my shelf, and some storage media that nobody knows anymore, such as magneto-optical disks and ZIP disks, for which I haven’t had any devices to read them with for a long time. Among us, some of us still have slides stored in groups of 100 in plastic boxes on our shelves. While this is commendable and should never be discarded, it raises concerns about the preservation of our historical data. For instance, I have photographs of shorelines around lakes in the central Kenya Rift that have long since vanished, replaced by houses or destroyed by agricultural activities. When we scan these photographs, the quality of the scanned image is never superior to the original, and there’s uncertainty about whether the files will remain readable in 30 years.
This example highlights the importance of considering the sustainability of scientific data, particularly in terms of adopting sustainable data formats and storage solutions. Scientific journals rightly emphasize the need to publish articles along with data, and more recently, the computer code that facilitates the replication of analyses and, ideally, the generation of all figures, even decades after the article’s publication. My 30+ year old MATLAB still works, but what about your Python code? Are you sure you want to use MATLAB Live Scripts, or would you rather save them as UTF-8 Classic Scripts? Where do we store all this, on the journal’s website or on Zenodo, which is operated by CERN?
Creating sustainable text documents is just as important as graphics, photos, and tables. Experience with old Microsoft Word files suggests saving texts in multiple formats simultaneously, hoping at least one will remain readable after decades. If you’re unsure, consider saving text as UTF-8 or UTF-16, in addition to formats like Word or PDF. Even if old Word files on readable disks become inaccessible, the text can still be read without retyping. When saving spreadsheets, it’s advisable to save them in multiple formats, including plain text in UTF-8 format, the proprietary formats of spreadsheet programs, a PDF file, and even a paper printout, to ensure data security.
If the graphics, photos, and tables are still legible due to sustainable formats, the information remains available, albeit not in the visually appealing design of a PDF document. Unfortunately, file formats are prone to loss. Who can be certain that we’ll still be able to read PDF files in 30 years? Whether for MATLAB, Python, or another language, I prefer an open text format for creating and saving graphics, as shown in this example for MATLAB and Python. Here, the consistent use of graphic property names and values ensures that it is clear that the line has a width of 0.75 points and the color according to the RGB code [0.9258 0.6914 0.1250]:
line(data(:,1),fittedcurve_2,...
    'LineWidth',0.75,...
    'Color',[0.9258 0.6914 0.1250]);
I think that young people in particular—as I was back then—don’t really appreciate how quickly their valuable data, painstakingly created graphics, and carefully crafted texts can become unreadable. My advice is to save your data in multiple formats on different storage media, open it and save it regularly, and check that it is readable. And make backups. I have saved my books six times in different locations, in clouds and on a hard drive on a shelf that is not connected to the internet.
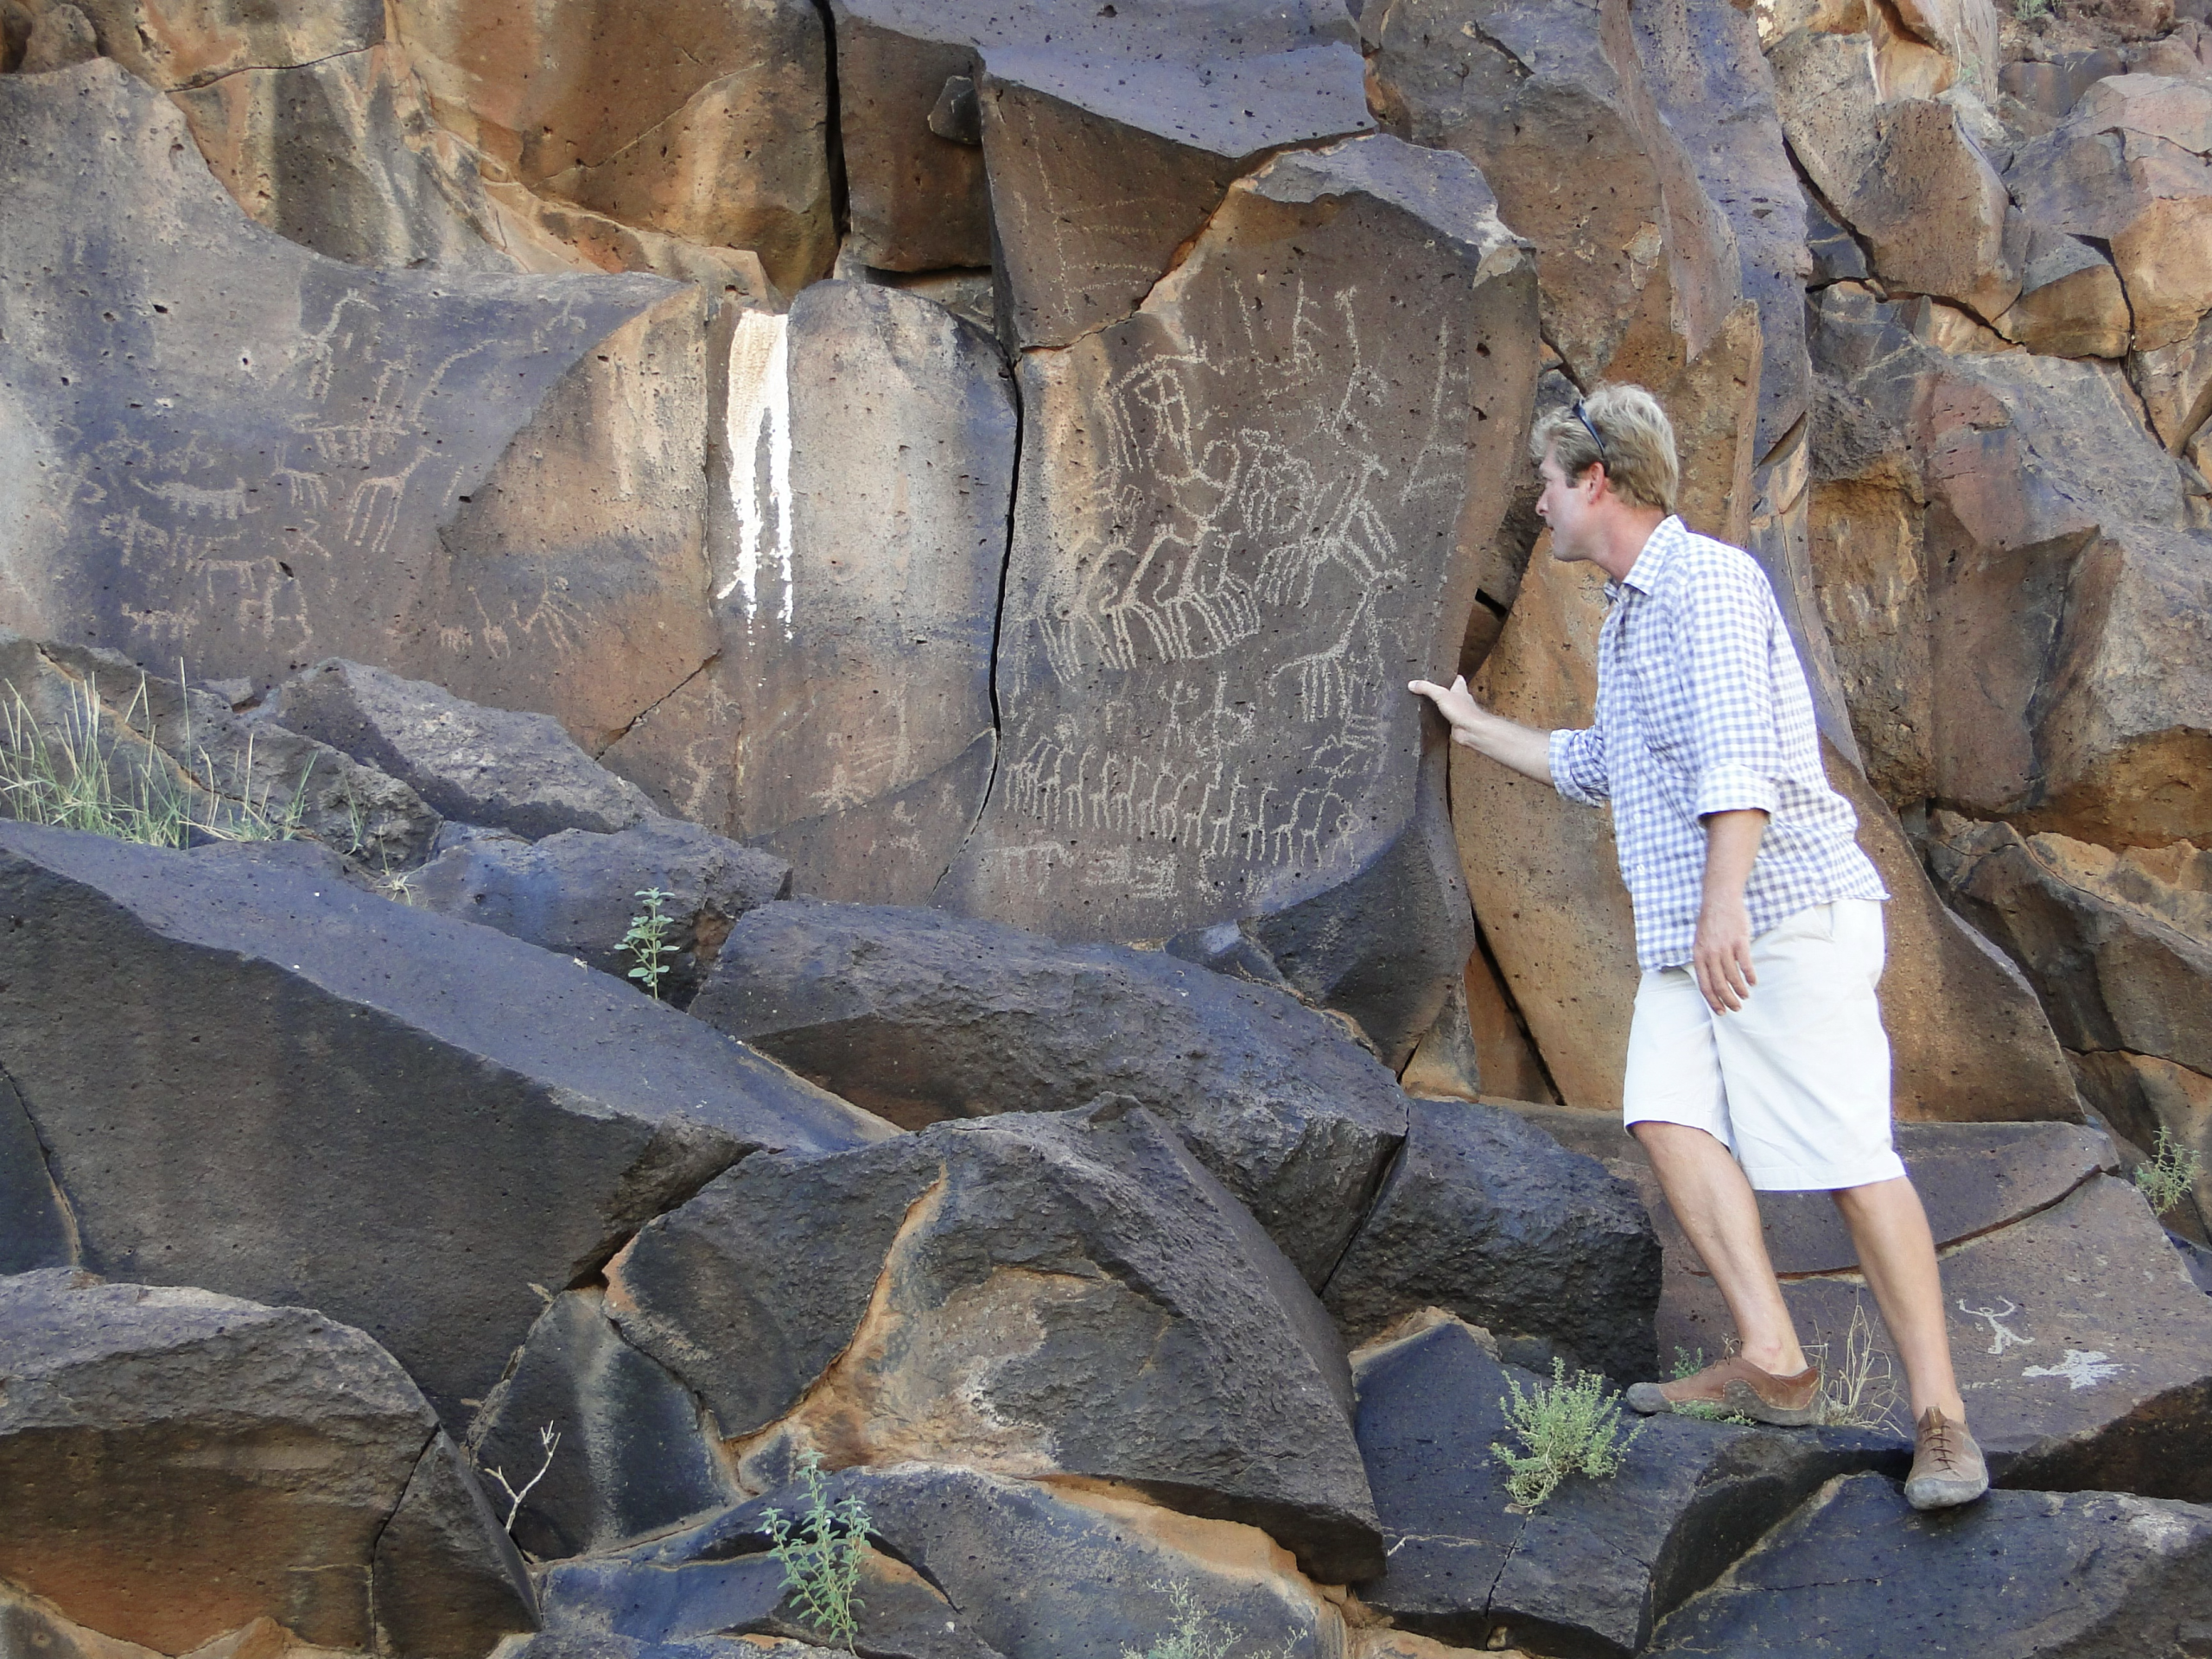
This text contains excerpts from my new books, which will be published by Springer next year. The photo in the article shows ~2500-year-old rock art on a basalt cliff in the southern Turkana Basin, Kenya, a good example of sustainability. Photo: M.H. Trauth.
References
Trauth, M.H., Sillmann, E. (2026) Collecting, Processing and Presenting Geoscientific Information with Python – First Edition. Springer International Publishing, in press.
Trauth, M.H., Sillmann, E. (2026) Collecting, Processing and Presenting Geoscientific Information with MATLAB® – Third Edition. Springer International Publishing, in press.