The exercise helps students to understand how to read complex text files with MATLAB.
Exercise “Read complex text files”
- Read the content of the file HSPDP_XRF.txt into the MATLAB workspace
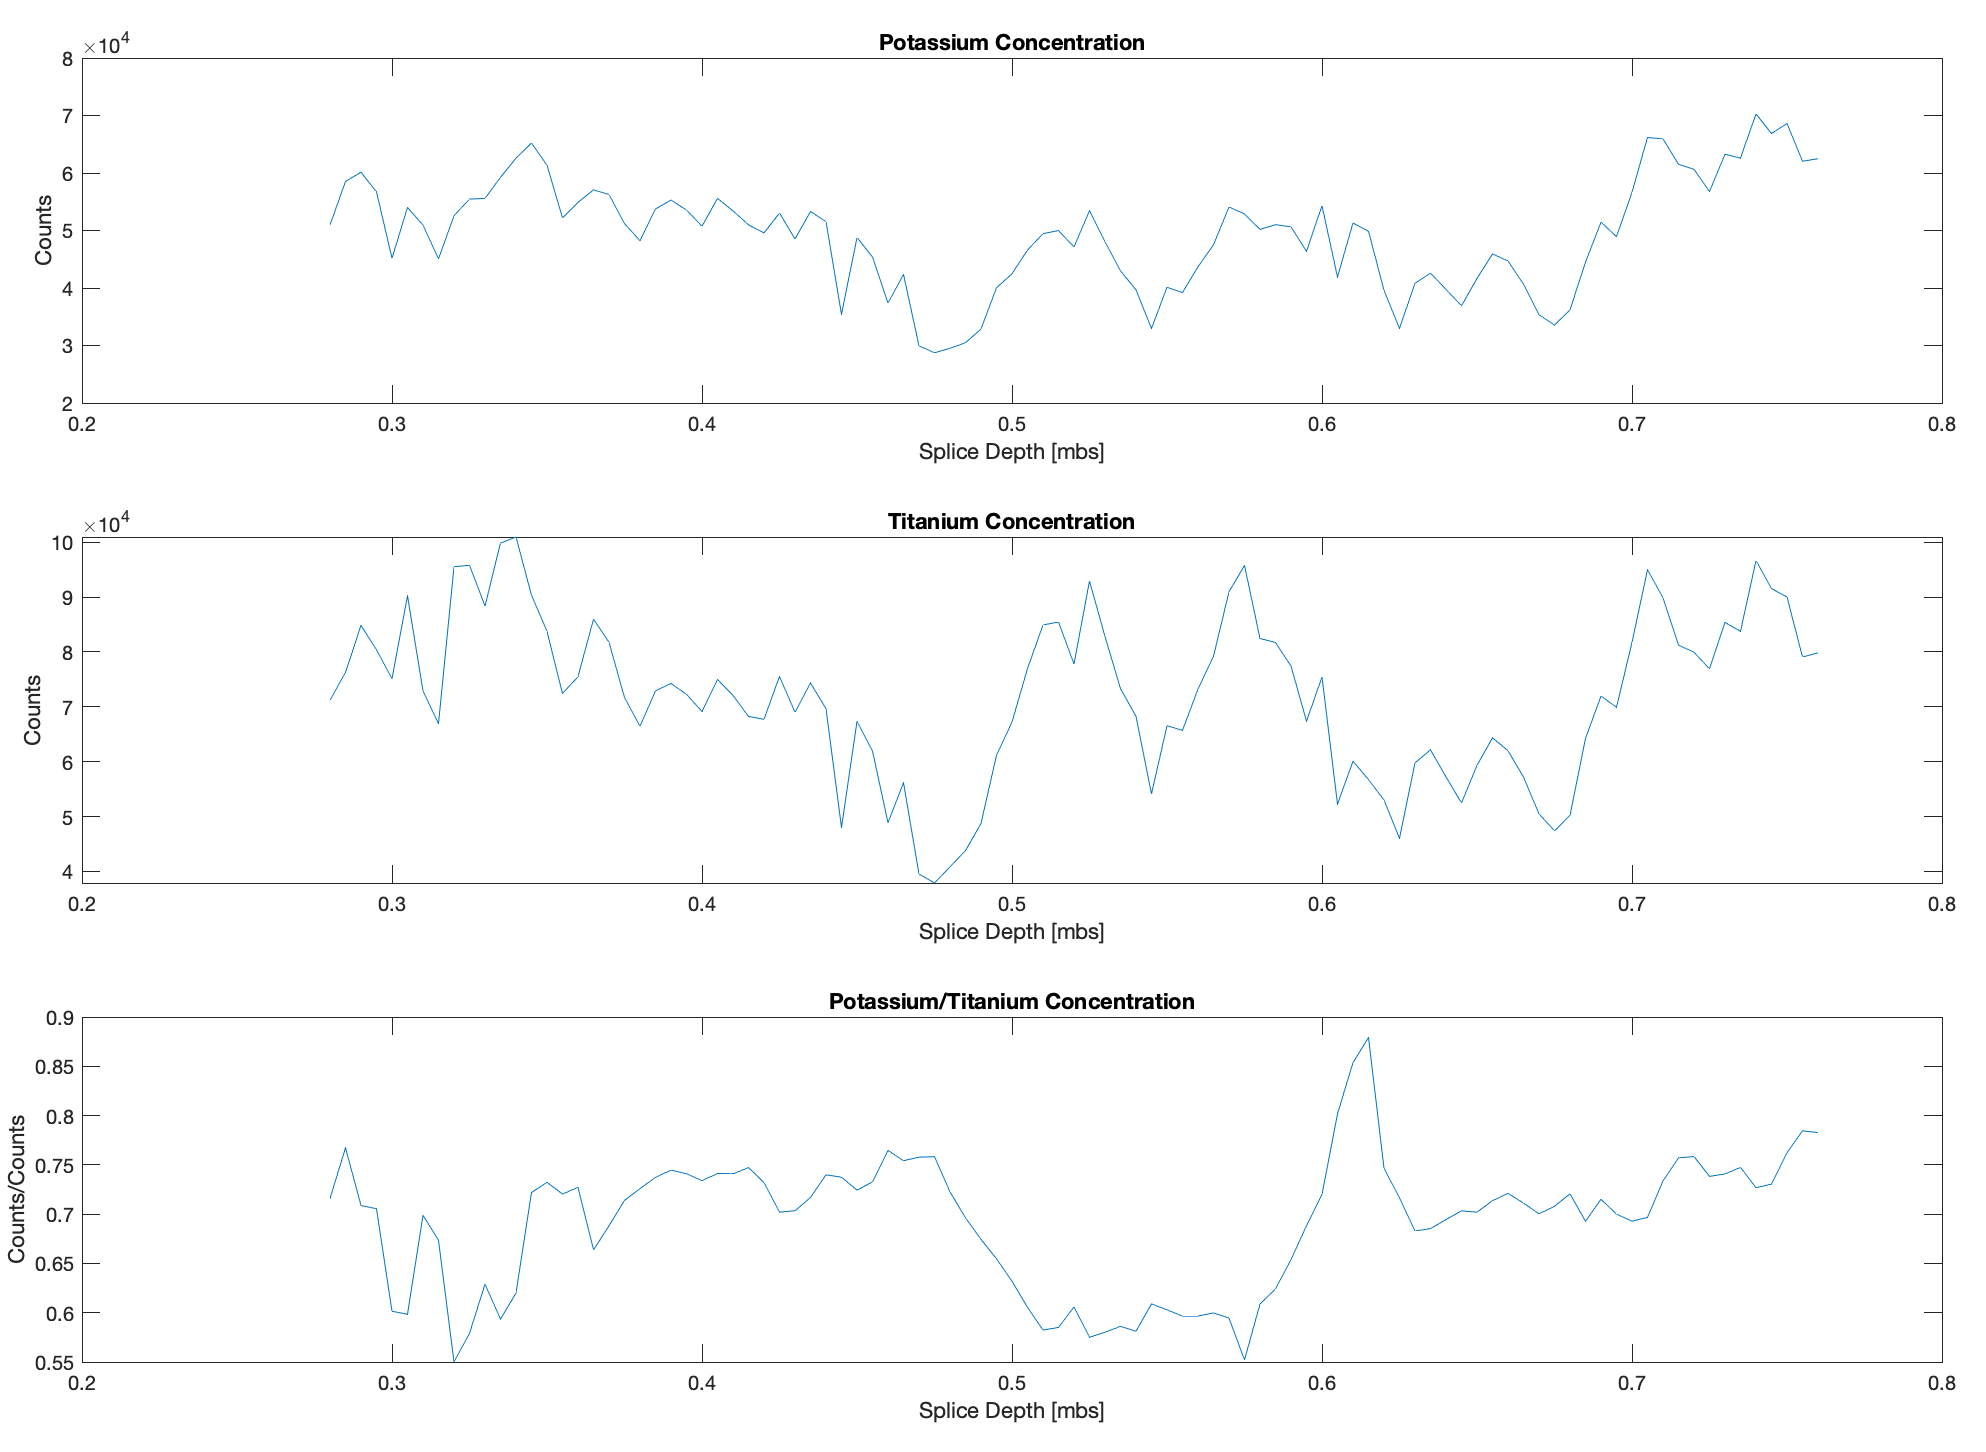
- Display the concentrations of K, Ti together with the K/Ti in three xy plots within a single figure window. Use x-labels, y-labels and a title.
Solution “Read complex text files”
fidA = fopen('HSPDP_XRF.txt');
formstrg = [repmat('%s ',1,3),...
repmat('%u %s ',1,2),'%u %s ',...
repmat('%f ',1,71)];
A1 = textscan(fidA,formstrg,...
   'Delimiter','\t',...
   'Headerlines',3);
fclose(fidA);
clear fidA

dataxrf1(:,1) = A1{13};
dataxrf1(:,2) = A1{43};
dataxrf1(:,3) = A1{70};

dataxrf1 = sortrows(dataxrf1,1);

figure('Position',[100 100 1200 800])
subplot(3,1,1)
plot(dataxrf1(:,1),dataxrf1(:,2))
xlabel('Splice Depth [mbs]')
ylabel('Counts')
title('Potassium Concentration')
subplot(3,1,2)
plot(dataxrf1(:,1),dataxrf1(:,3))
xlabel('Splice Depth [mbs]')
ylabel('Counts')
title('Titanium Concentration')
subplot(3,1,3)
plot(dataxrf1(:,1),dataxrf1(:,2)./dataxrf1(:,3))
xlabel('Splice Depth [mbs]')
ylabel('Counts/Counts')
title('Potassium/Titanium Concentration')