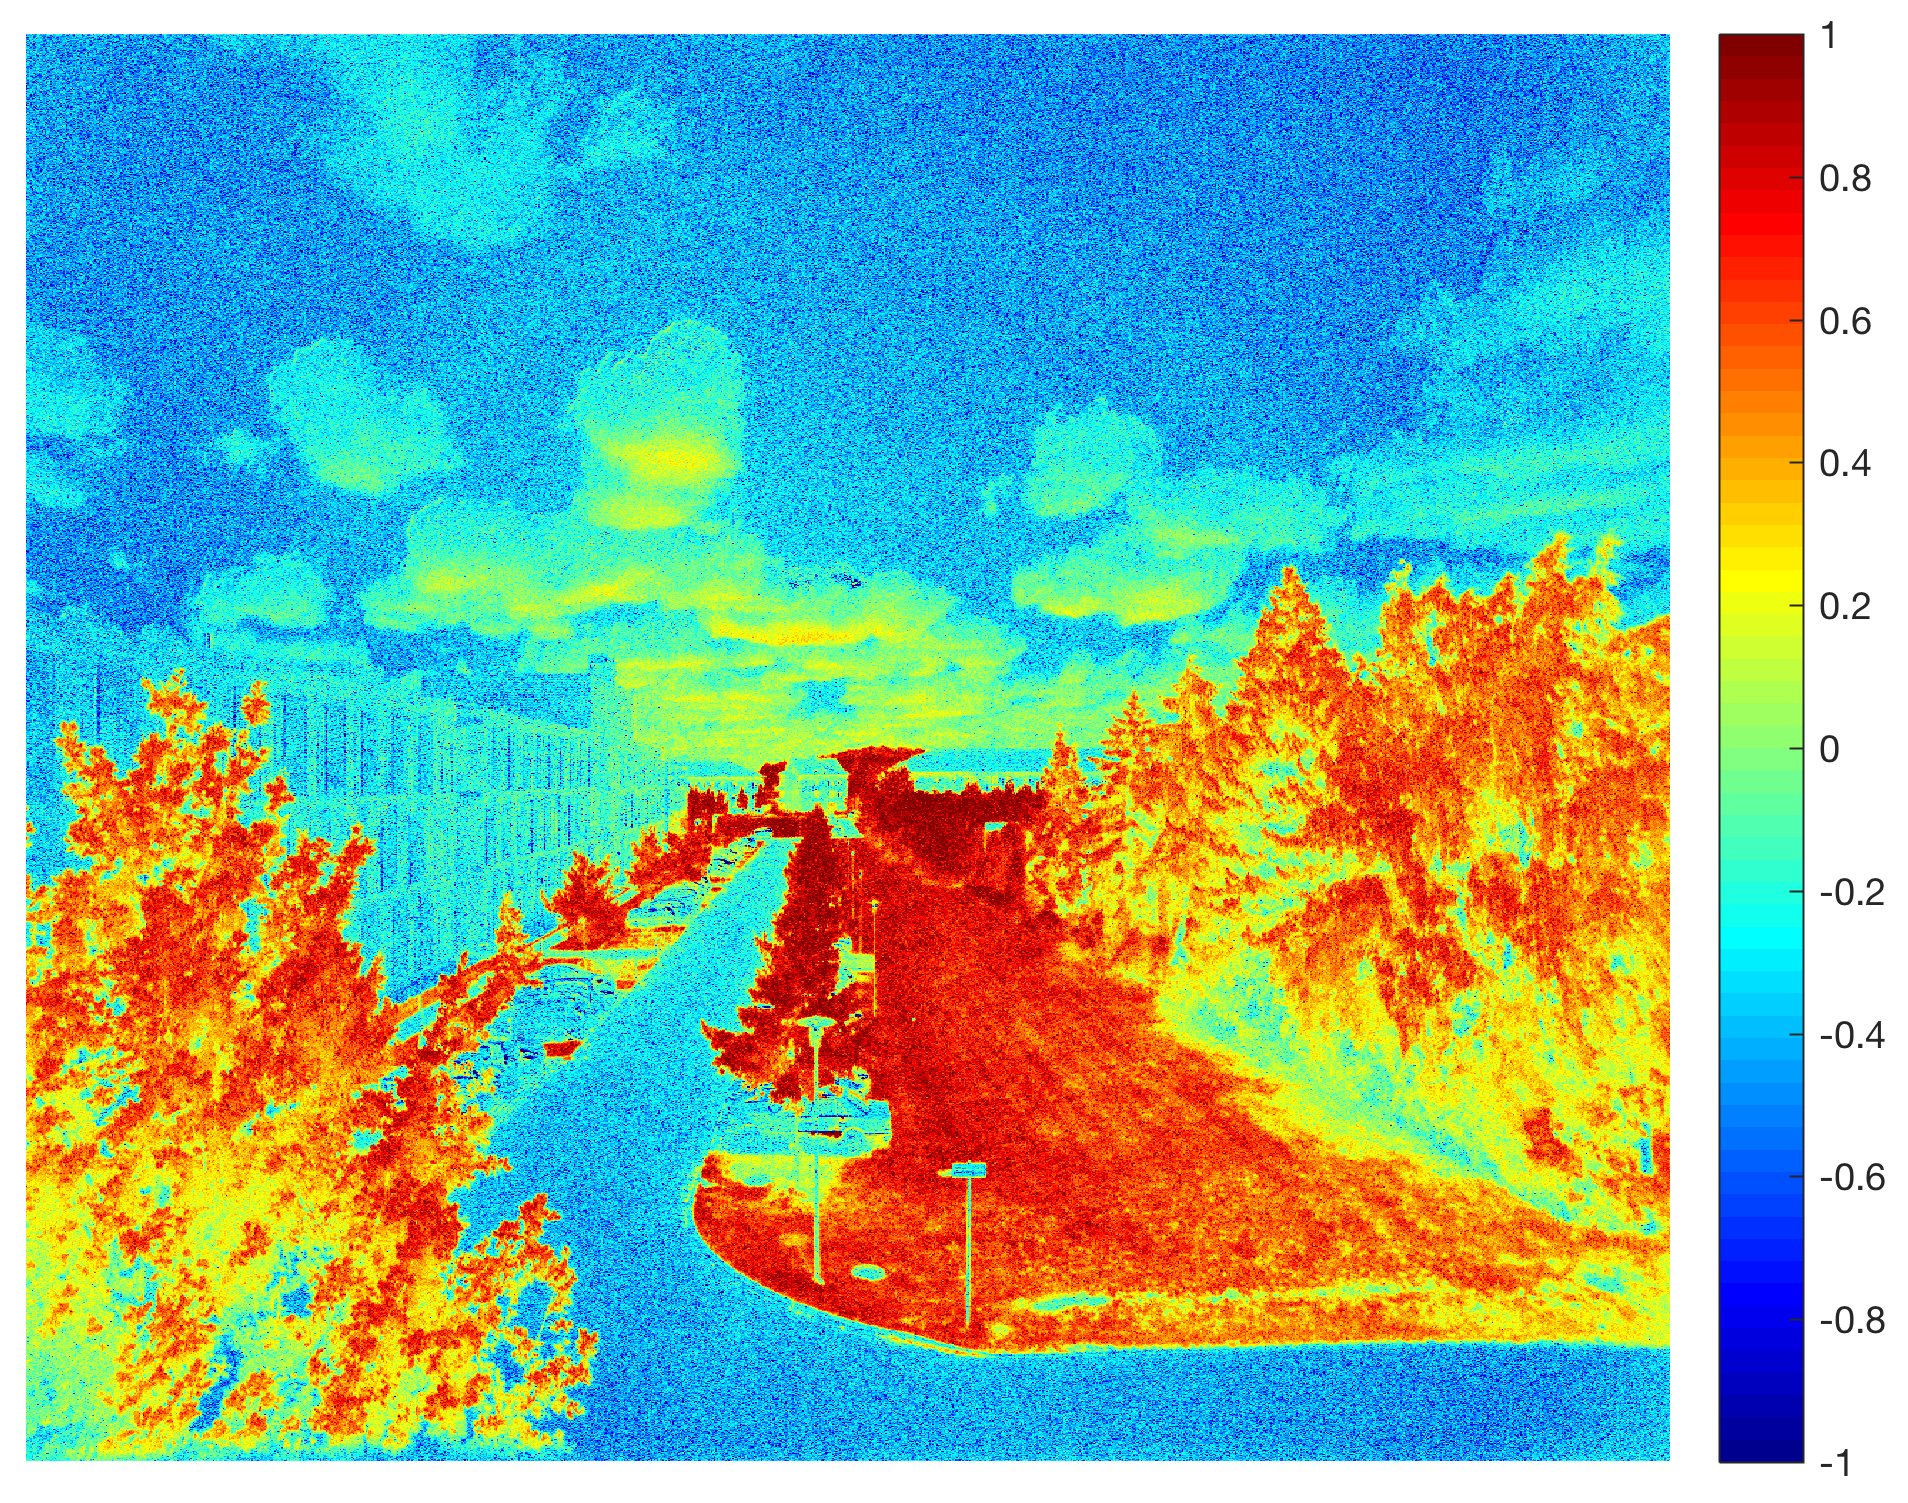
In an earlier post in March 2017 I explained how to capture NDVI Red+NIR images using a MAPIR Survey2 NDVI, to import the images into MATLAB and to calculate the Normalized Difference Vegetation Index. Here is the result of the experiment repeated in June 2017 during the growing season. Continue reading “Calculating the NDVI From Multispectral Camera Images Using MATLAB, Part 2”
Teaching Computational Geosciences with MATLAB, Part 9: Spatial Data
In a series of blog posts, I will tell you a little about how I teach computational geosciences with MATLAB. On the second half of day 4 of the one-week course I teach to import, process, analyze and visualize spatial data. Continue reading “Teaching Computational Geosciences with MATLAB, Part 9: Spatial Data”
Teaching Computational Geosciences with MATLAB, Part 8: Multivariate Statistics
In a series of blog posts, I will tell you a little about how I teach computational geosciences with MATLAB. On the first half of day 4 of the one-week course I teach multivariate statistics. Continue reading “Teaching Computational Geosciences with MATLAB, Part 8: Multivariate Statistics”