This exercise is intended to help students to understand advanced plotting with MATLAB.
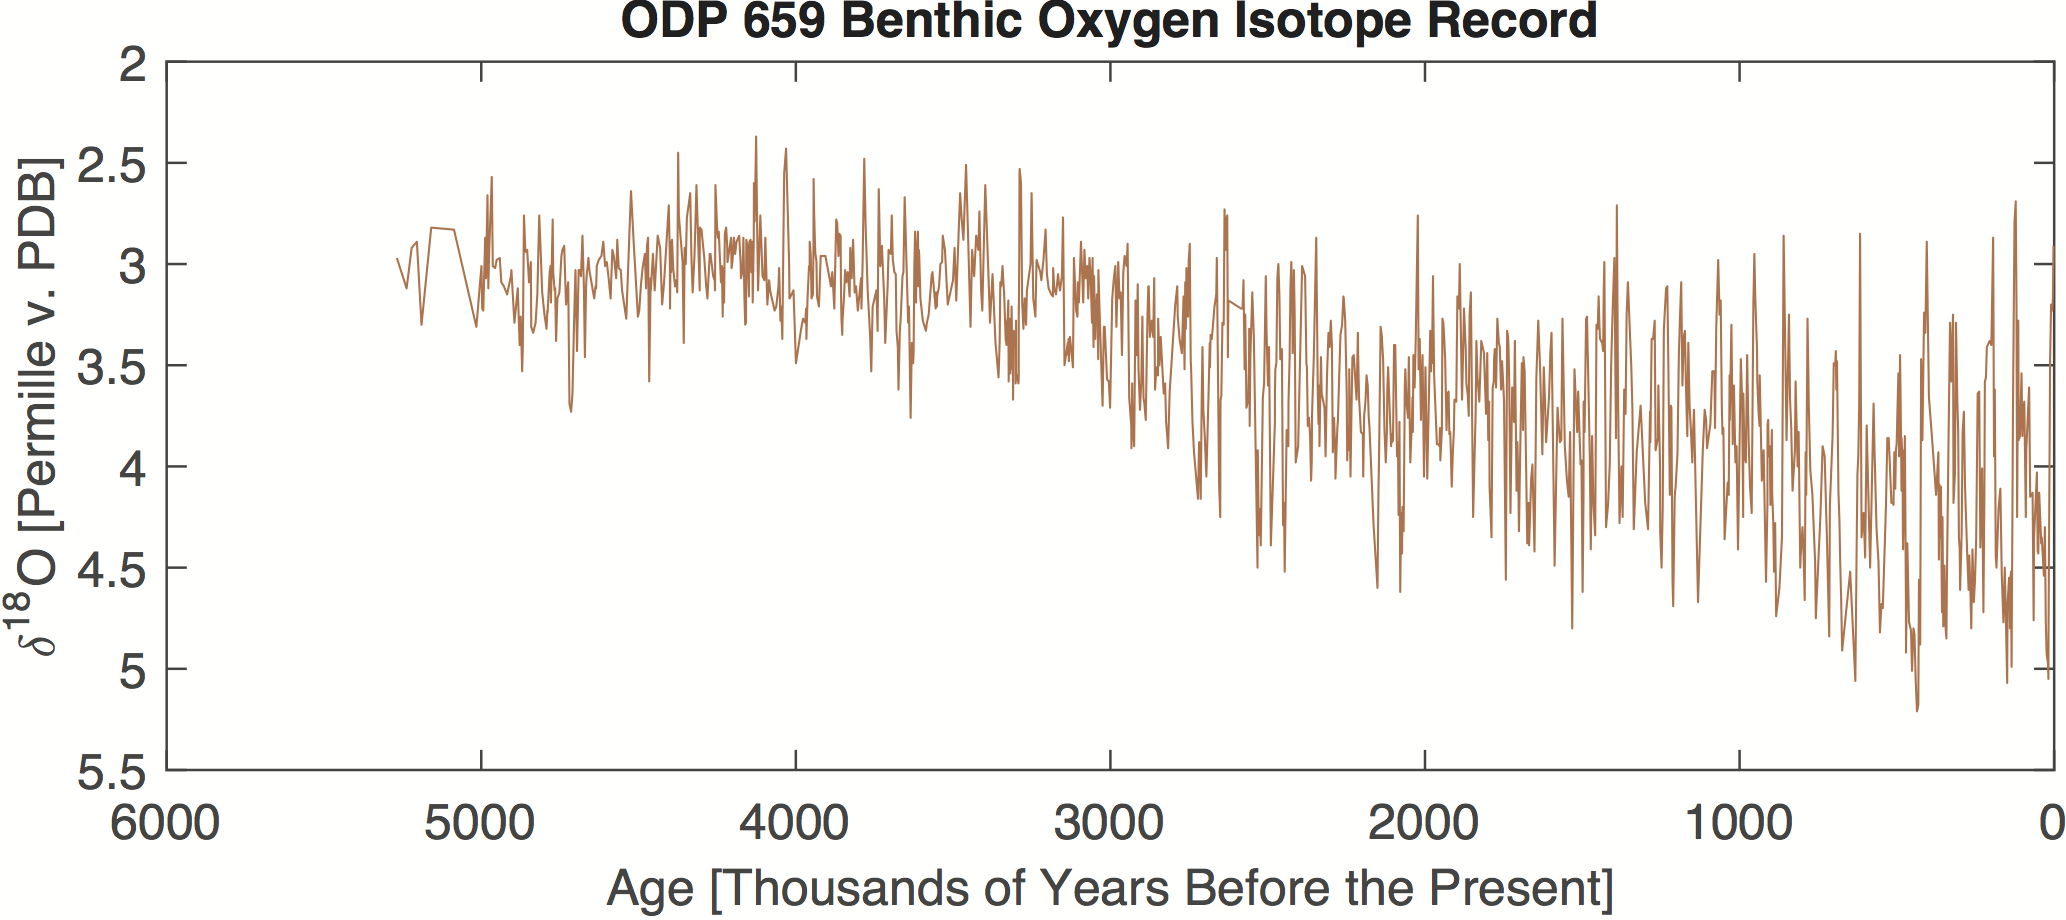
The file odp659data.txt contains marine oxygen isotope data from foraminifera sampled from a deep-see sediment core. Such isotope data reflect changes in global ice volume, in the case of planktonic foraminifere, also local sea surface temperature and salinity of the sea water on time scales of thousands of years. The first column of the data represent age (in kyrs), the second column represent the oxygen isotope value, i.e., the ratio of the oxygen isotopes O18 and O16 converted to a percentage difference from the ratio found in a carbonate standard.
Advanced editing of graphics requires the understanding of MATLAB graphics to be organized as hiercharical suites of graphics objects. The graphics object hierarchy includes, in a simplified description, three main layers: figure window, axes and plot objects. The objects within each layer have a fixed set of properties that can be modified to control the appearance of a graph. You can query the value of each property and set the values of most of them. I believe that the concept of graphics objects and object handles is not well explained in the MATLAB manual. To test this hypothesis please work on this exercise.
(1) Visualize the marine oxygen isotope data from ODP659 as a xy plot. The Figure Windows should have a white background instead of gray, the size of the window is 550 px times 260 px. The x-axis is 16 cm wide, the y-axis is 6 cm high. The line thickness of the axis is 0.6 pt. The direction of both x- and y-axis is reverse. Choose a title and x- and y-labels. The font of the axis labels and the title is Helvetica 12 pt. The RGB color of the line of the graph is [0.8 0.3 0.1]. The line thickness is 0.5 pt.
(2) Having completed our line graph, we save the result in a file to be further edited in a vector graphics software. The figure window needs to be active while printing the image to a file. The preferred format to save vector graphics like the one in our example is the Encapsulated Level 2 Color PostScript format. Save the graph from (1) in the EPSC2 format.
Please use the publishing feature of MATLAB to publish the results of your experiment as a PDF file with all graphs included.
Solution
Here is a possible solution of the exercise. You need to rename to file exercise_1_solution.m before using it with MATLAB. Please send me your comments, improvements, corrections!