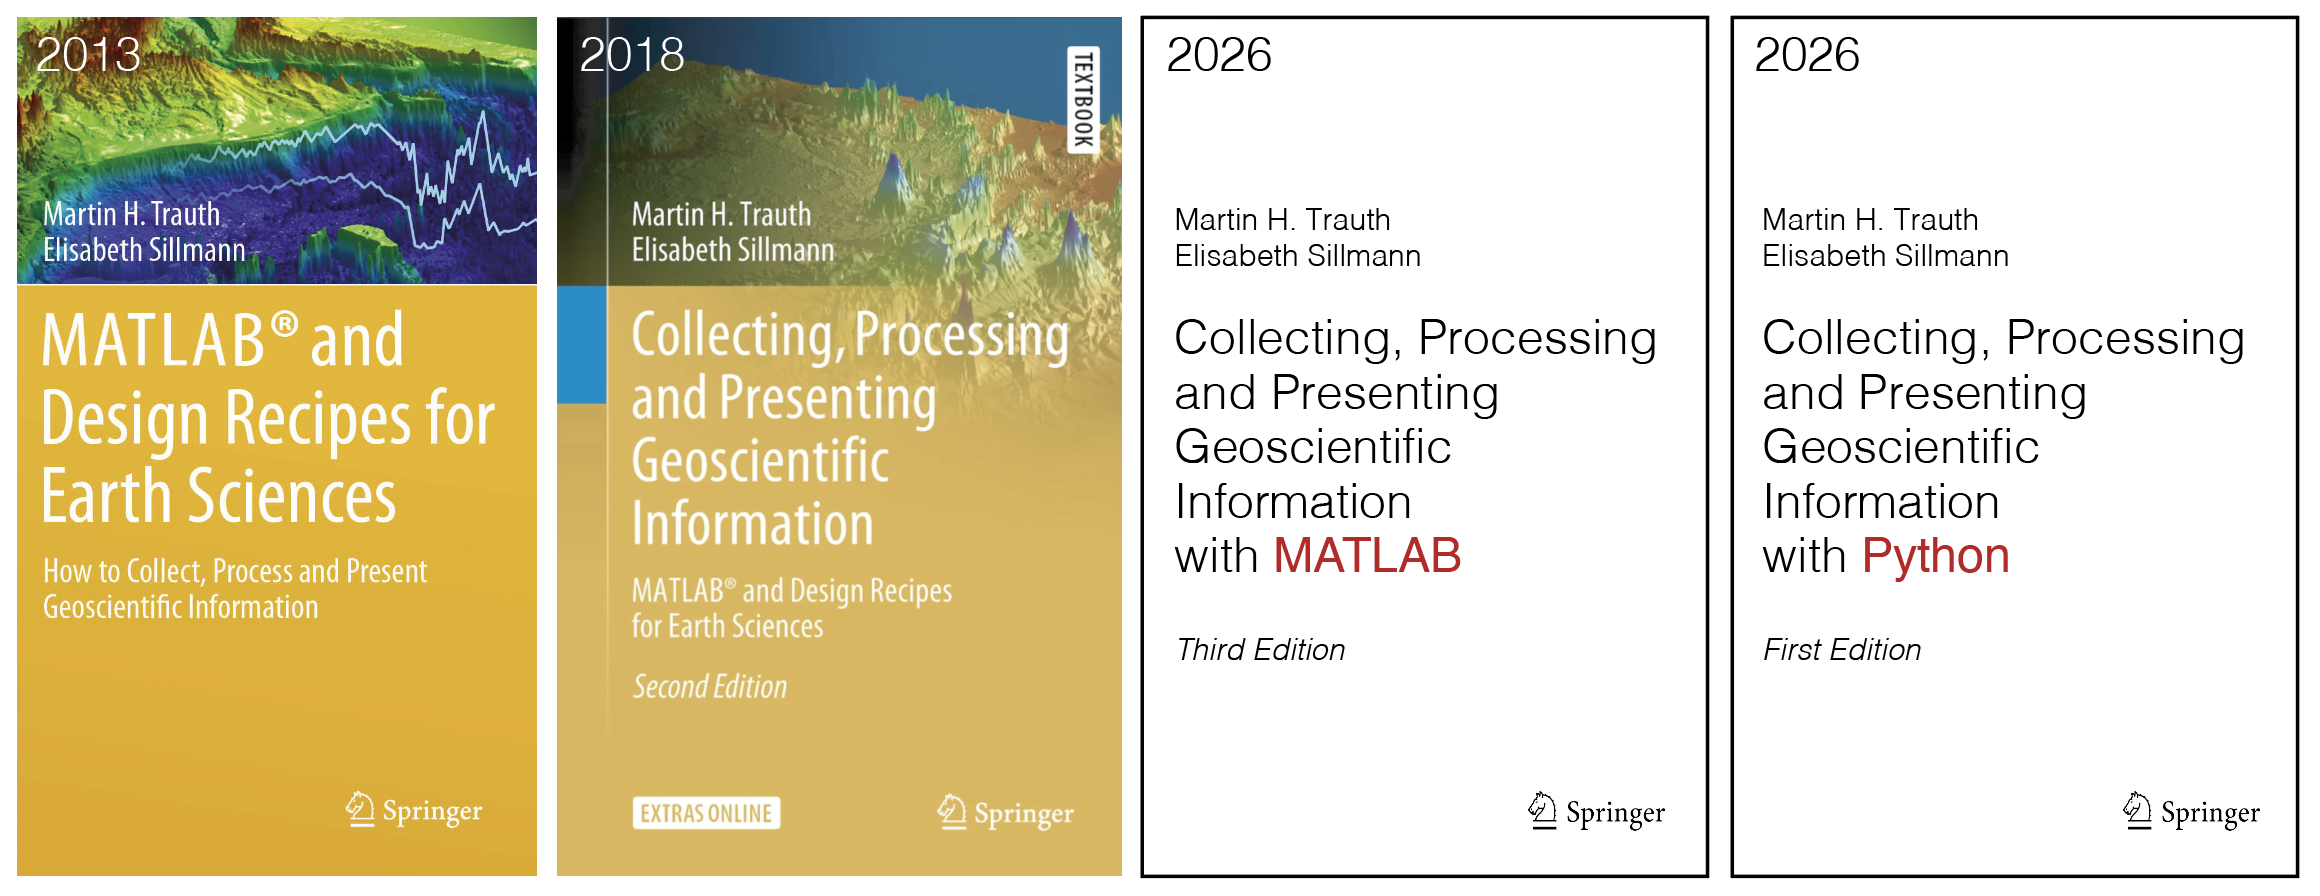
Multispectal imaging captures images across multiple spectral bands. Here is a MATLAB example where eight different spectral bands in visible light and near infrared show differences in a rock sample that are invisible to the human eye. Continue reading “Multispectral Imaging of Rock Samples with MAPIR Cameras”
Capturing Spectral Images with the new MAPIR Survey3 Camera
Thanks to the ongoing support of MathWorks Inc. through their Curriculum Development Program, I was able to purchase two additional spectral cameras. The MAPIR Survey2 cameras are no longer available. They have been replaced by the Survey3, which has slightly different features. Here is an example of how to import and process the RAW images in MATLAB.
Continue reading “Capturing Spectral Images with the new MAPIR Survey3 Camera”
Recommended Reading on Time Series Analysis by M.H. Trauth and Colleagues
From July 12-15, 2025, I will be participating in an ICDP workshop on LKD, where I will give a presentation on time series analysis. In the presentation, I will show a QR code with links to literature on the topic that we have written and courses on the topic. Continue reading “Recommended Reading on Time Series Analysis by M.H. Trauth and Colleagues”
Interpolating Unevenly Spaced Data With MATLAB
Most methods of time series analysis require evenly spaced time axes, which is why we have to convert unevenly spaced time series into a time series with an evenly spaced time axis using interpolation. Continue reading “Interpolating Unevenly Spaced Data With MATLAB”
Creating Animated 3D Objects with MATLAB
Ever since the introduction of electronic devices with touch controls, interactive 3D graphics objects have become increasingly popular in multimedia electronic books (ebooks). The Lidar Toolbox and the Computer Vision Toolbox from MathWorks provide the necessary tools for creating and exporting 3D graphics objects for inclusion in documents such as multimedia ebooks, interactive websites, and presentations (MathWorks 2025a, b).
Creating Animated 3D Objects with Python
Ever since the introduction of electronic devices with touch controls, interactive 3D graphics objects have become increasingly popular in multimedia electronic books (ebooks). The Open3D and the Rasterio packages for Python provide the necessary tools for creating and exporting 3D graphics objects for inclusion in documents such as multimedia ebooks, interactive websites, and presentations.
MATLAB Example to Illustrate John Aitchison’s Log-Ratio Transformation, Part 4
John Aitchison spent much of his career addressing the unique challenges of statistics for compositional data. His legacy is being carried on by colleagues who do not always succeed in presenting the material in a way that is understandable to geoscientists. Now in the fourth part of a series of blog posts, I am attempting to address the problems of closed data and possible workarounds using a series of simple MATLAB simulations, without frustrating geoscientists with mathematical formulas.
Continue reading “MATLAB Example to Illustrate John Aitchison’s Log-Ratio Transformation, Part 4”
60th Online Shortcourse on MATLAB & Python Recipes for Earth Sciences
The popular online course on data analysis in the geosciences will be taught bilingual using the two leading programming languages and development environments MATLAB and Python in parallel on 15–19 September 2025. The course is based on my books MATLAB Recipes for Earth Science (Springer 2025) and Python Recipes for Earth Sciences (Springer 2024).
Continue reading “60th Online Shortcourse on MATLAB & Python Recipes for Earth Sciences”