
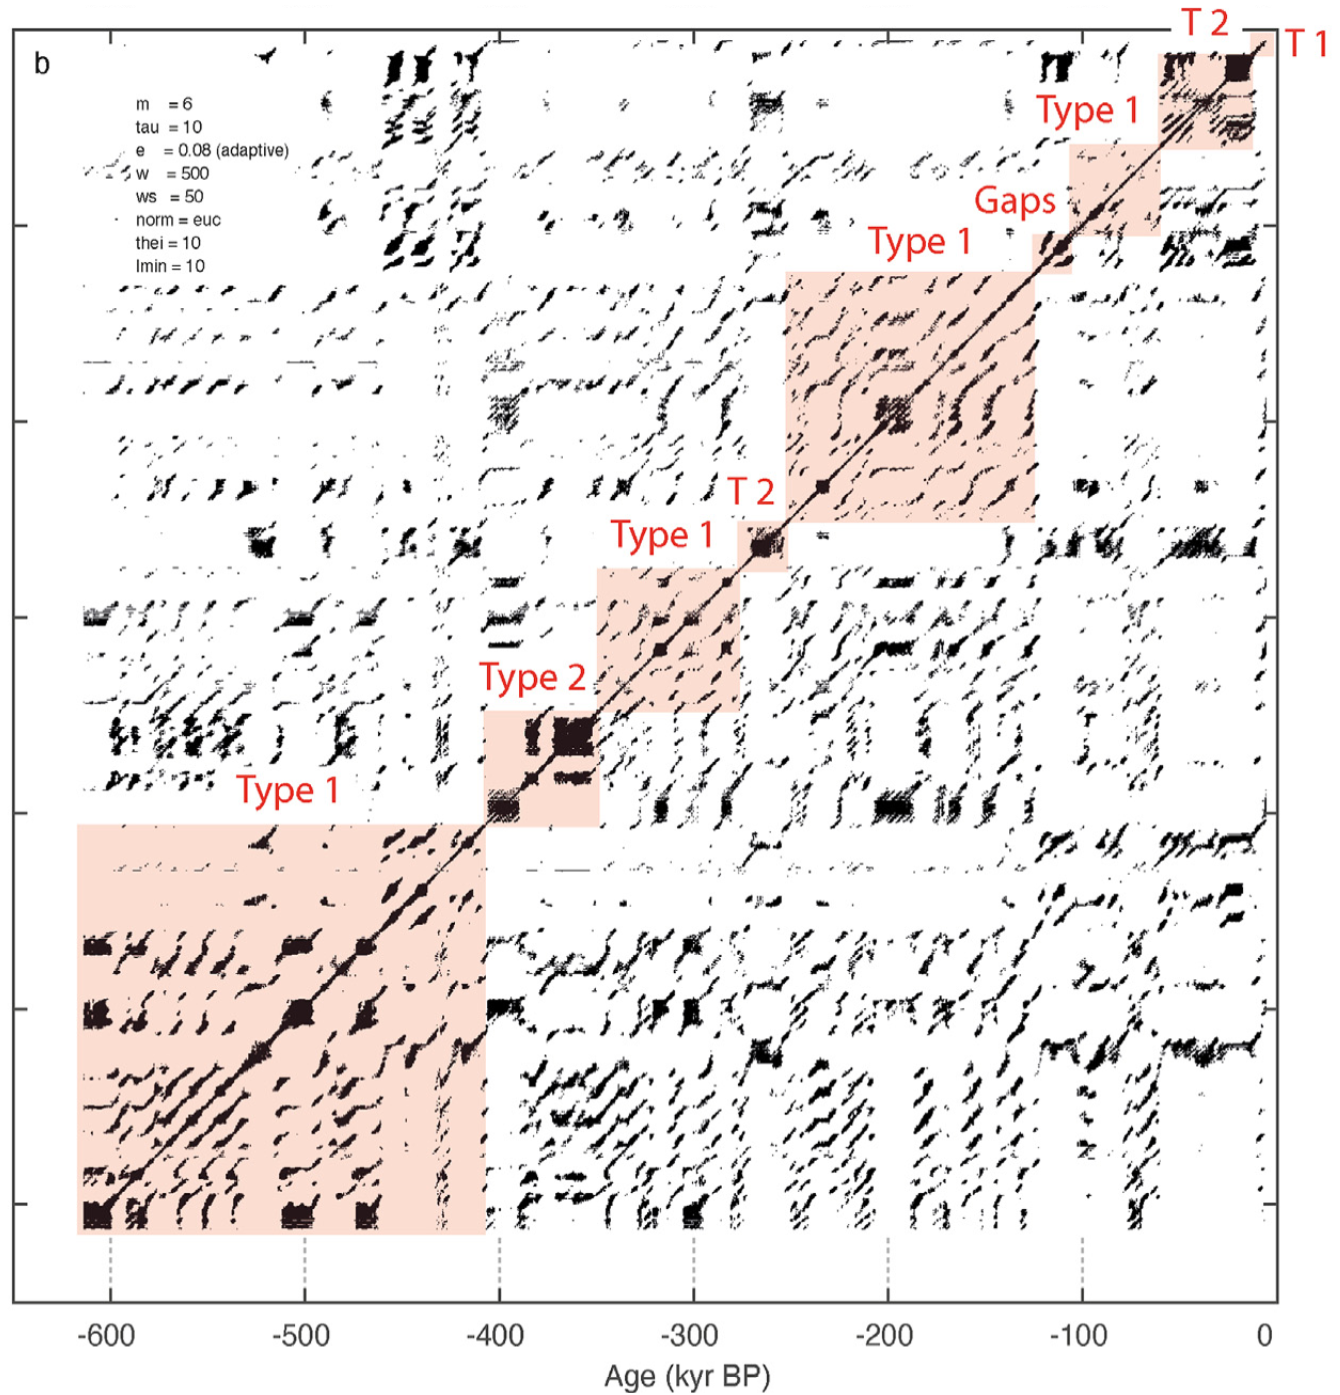
Here you find the MATLAB code and data of our paper “Recurring types of variability and transitions in the ~620 kyr record of climate change from the Chew Bahir basin, southern Ethiopia” published in the Elsevier journal Quaternary Science Reviews. Continue reading “MATLAB Code of “Recurring types of variability and transitions …” (Trauth et al., QSR 2021)”
5th Summer School Starts with 72 Participants and 15 Instructors
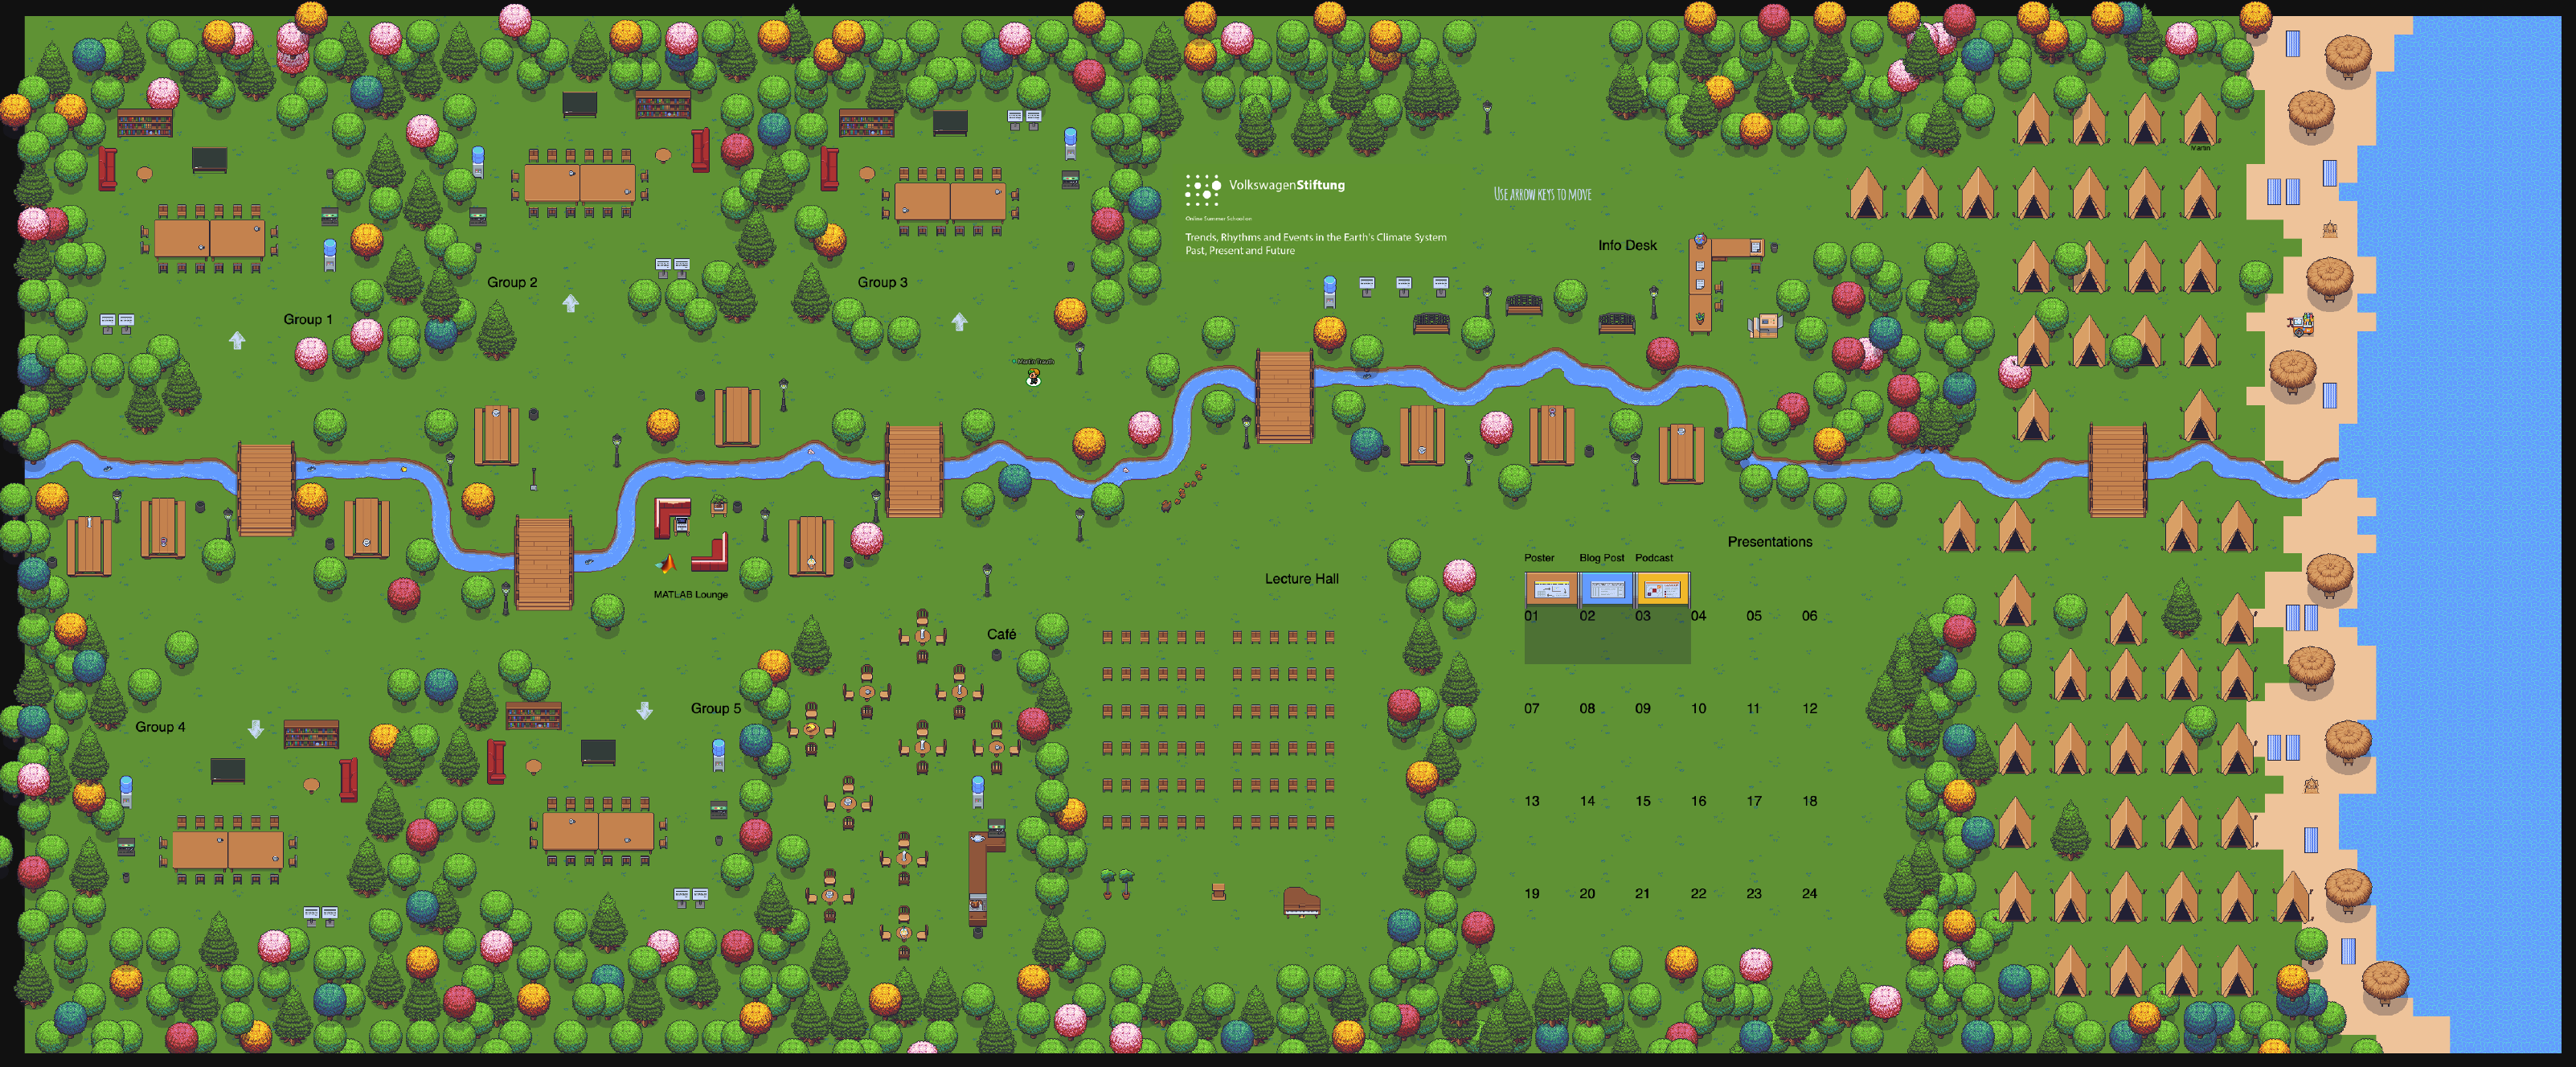
We will open our summer school on “Trends, Rhythms and Events in the Earth’s Climate System – Past, Present and Future” on funded by the VolkswagenFoundation and with support from Springer, MathWorks and Cambridge University Press on Sunday, May 23rd, 2021 with 72 participants and 15 instructors. Continue reading “5th Summer School Starts with 72 Participants and 15 Instructors”
QSR Virtual Special Issue on Global monsoonal systems during the last glacial-interglacial cycle
I am pleased to announce a Quaternary Science Reviews virtual special issue on “Global monsoonal systems during the last glacial-interglacial cycle”. This special issue focuses on well-dated records of all regional monsoon systems as well as paleomonsoon modelling during the last glacial-interglacial cycle (from ~ 150,000 years ago to the present). Interested authors of articles on the topic may contact me via email. Continue reading “QSR Virtual Special Issue on Global monsoonal systems during the last glacial-interglacial cycle”
New Book “Signal and Noise in Geosciences” (Springer 2021)
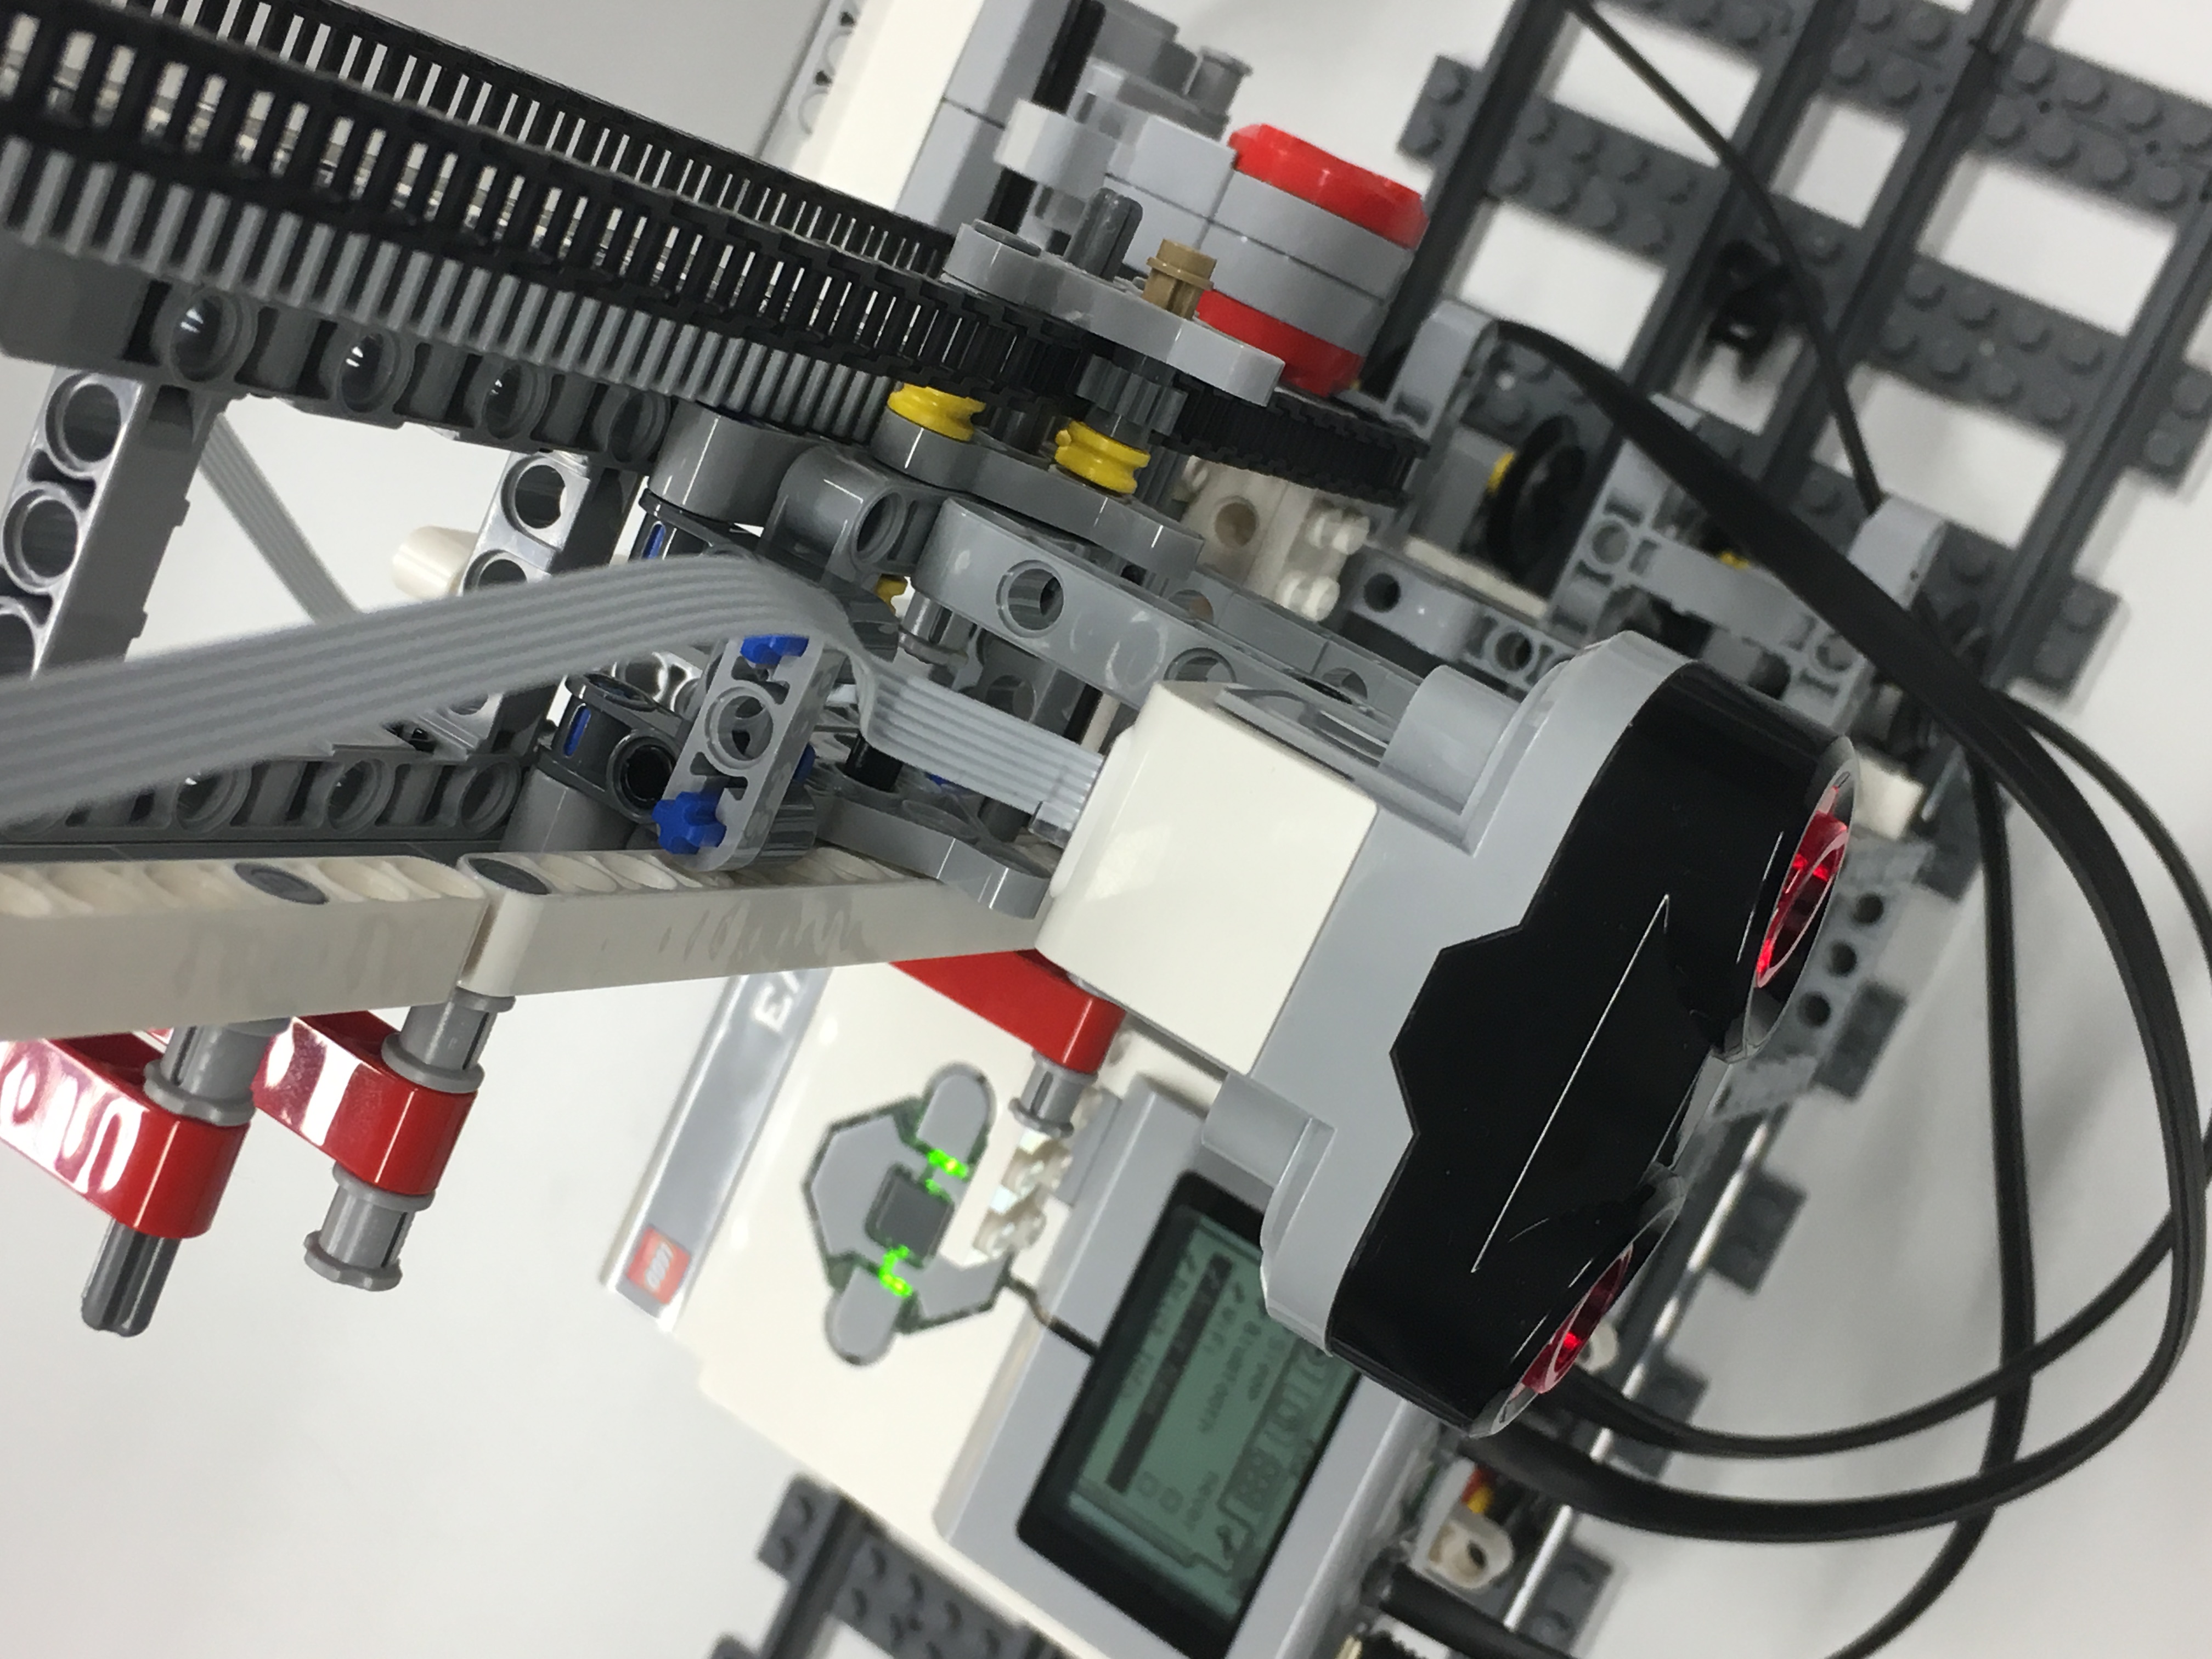
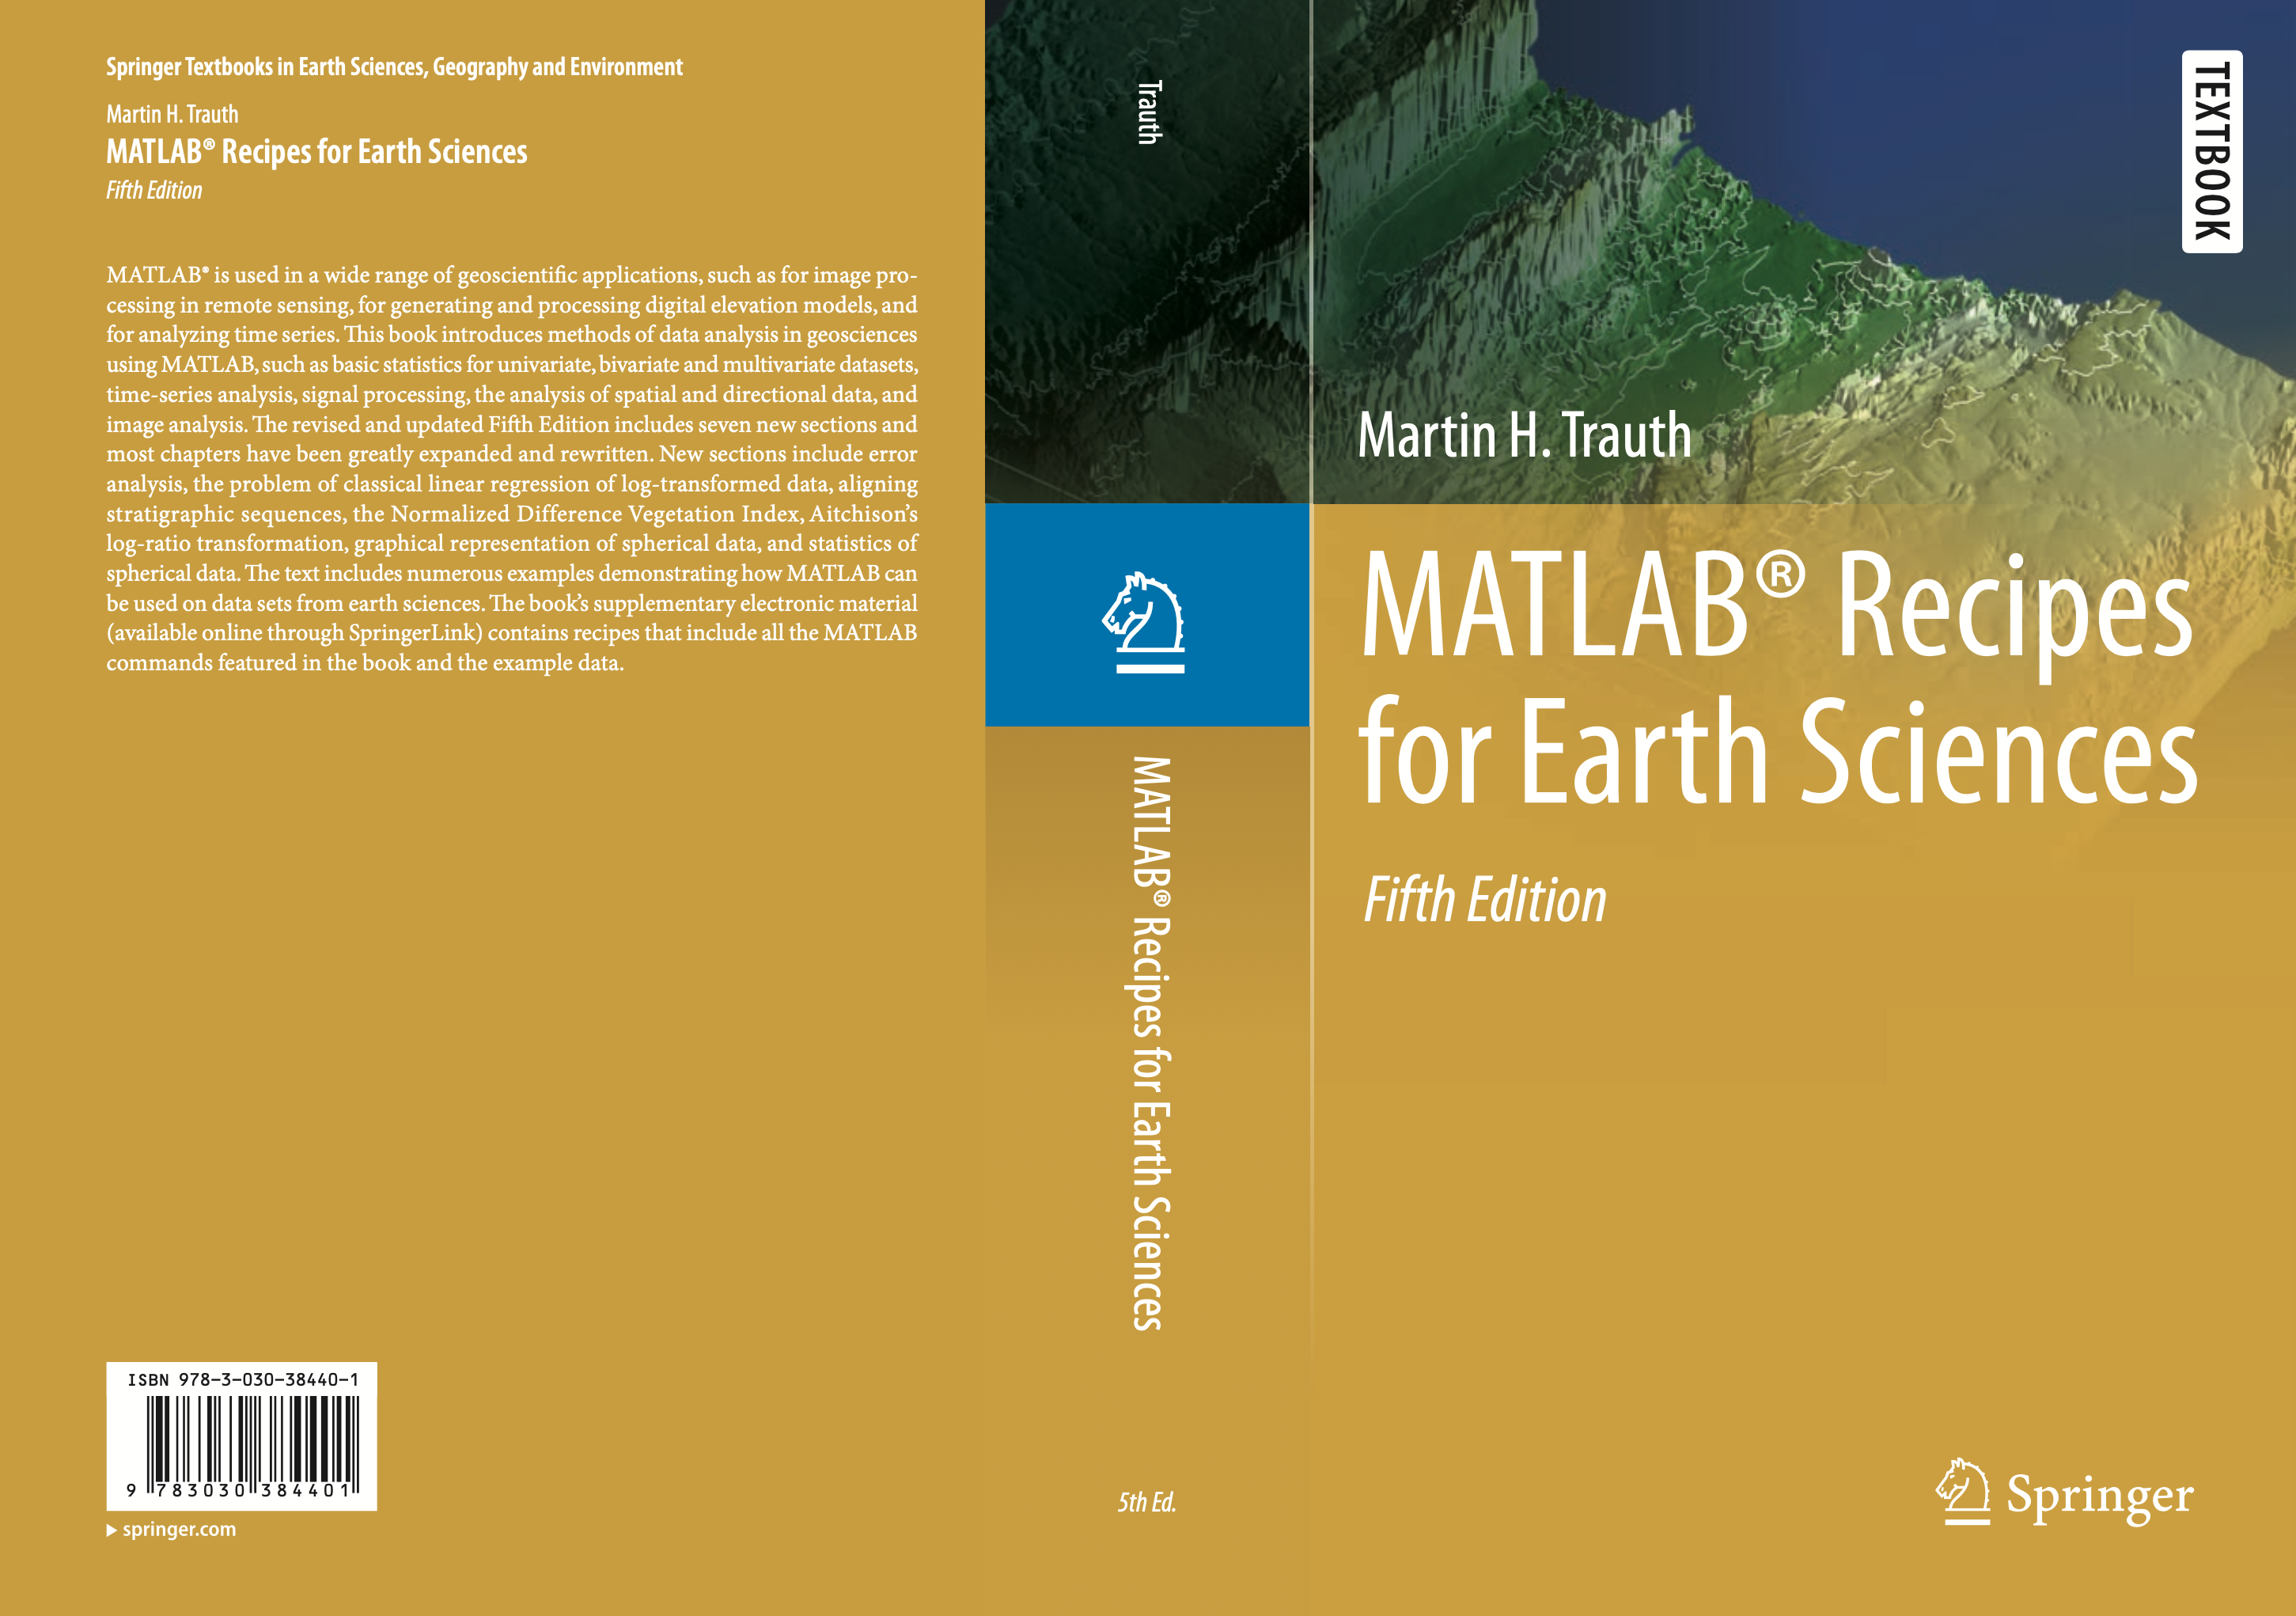
The new textbook “Signal and Noise in Geosciences” (Springer 2021) introduces methods of data acquisition in geosciences using MATLAB together with inexpensive data acquisition systems, such as the sensors on board of smartphones, sensors that come with the LEGO MINDSTORMS set, webcams with stereo microphones, affordable spectral and thermal cameras. Continue reading “New Book “Signal and Noise in Geosciences” (Springer 2021)”
Online-Workshop: Introduction to Graphical Programming with Simulink
Since 2018, the University of Potsdam has unlimited campus-wide access to MathWorks technology for all university members, which combines professional tools for data analysis with a development environment for software and a higher-level programming language. In addition to using MATLAB, this access also allows to use Simulink, a block diagram environment for model-based design. Students and employees of the University of Potsdam and interested guests are therefore invited to participate in the “Introduction to Graphical Programming with Simulink” workshop, which is offered under the University of Potsdam’s MathWorks Campus license (9 April 2021, 2 to 5 pm, online course, in English language).
Continue reading “Online-Workshop: Introduction to Graphical Programming with Simulink”
New MATLAB-Based Textbook on “Signal and Noise in Geosciences” Submitted
After signing a contract with SpringerGeo in August 2019, I submitted my third MATLAB-based textbook on Signal and Noise in #Geosciences: MATLAB Recipes for Data Acquisition in Earth Sciences” including a 4 GB electronic supplement today. Continue reading “New MATLAB-Based Textbook on “Signal and Noise in Geosciences” Submitted”
53th and 54th Shortcourse on MRES – Interactive Online Seminars
During the worldwide SARS-CoV-2 pandemic, teaching at universities changed fundamentally within a few days. This also has an impact on the traditional MRES courses, which are now offered entirely online! The interactive online seminar on MATLAB Recipes for Earth Sciences will be held on 20–24 September 2021 (in English language) and 4–8 October 2021 (in German language). UPDATE: The German course is cancelled and the participants take the course in English.
Continue reading “53th and 54th Shortcourse on MRES – Interactive Online Seminars”
Quantify Climate Transitions Using MATLAB
![]()
Detecting climate transitions, their relative duration and midpoint, together with confidence bounds, is an important application of time series analysis methods. Here is a MATLAB example of a nonlinear fit of a sigmoid function to noisy data with a transition.
Continue reading “Quantify Climate Transitions Using MATLAB”