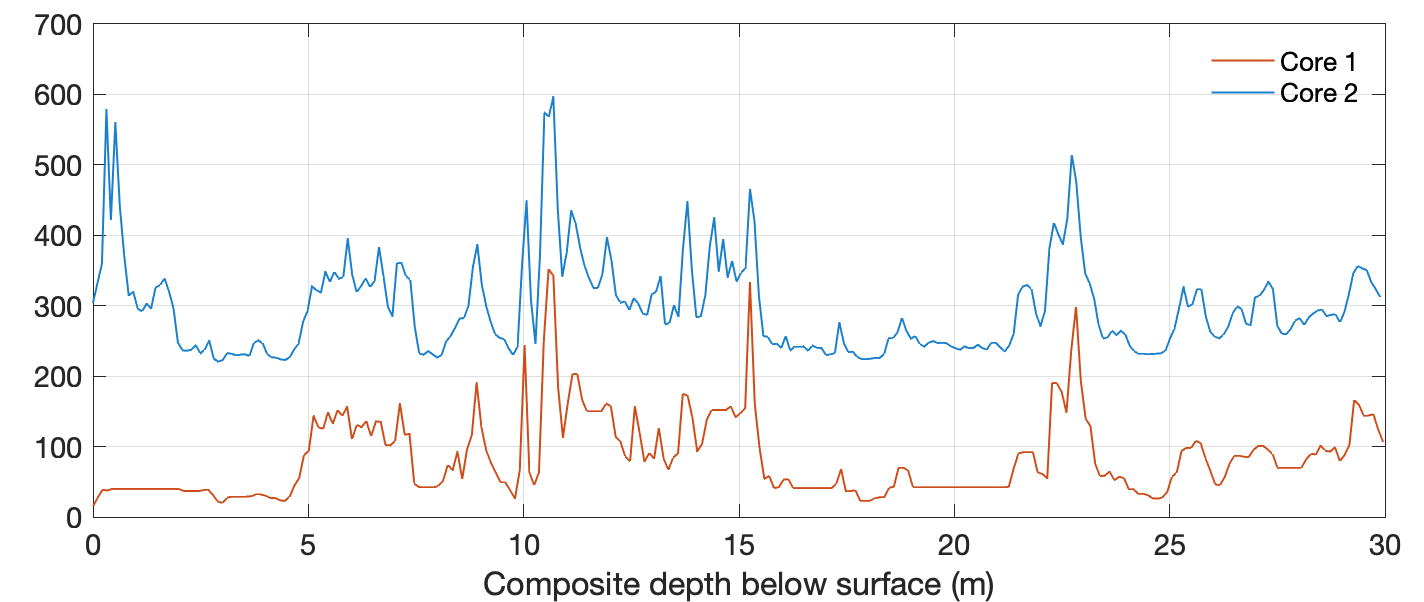
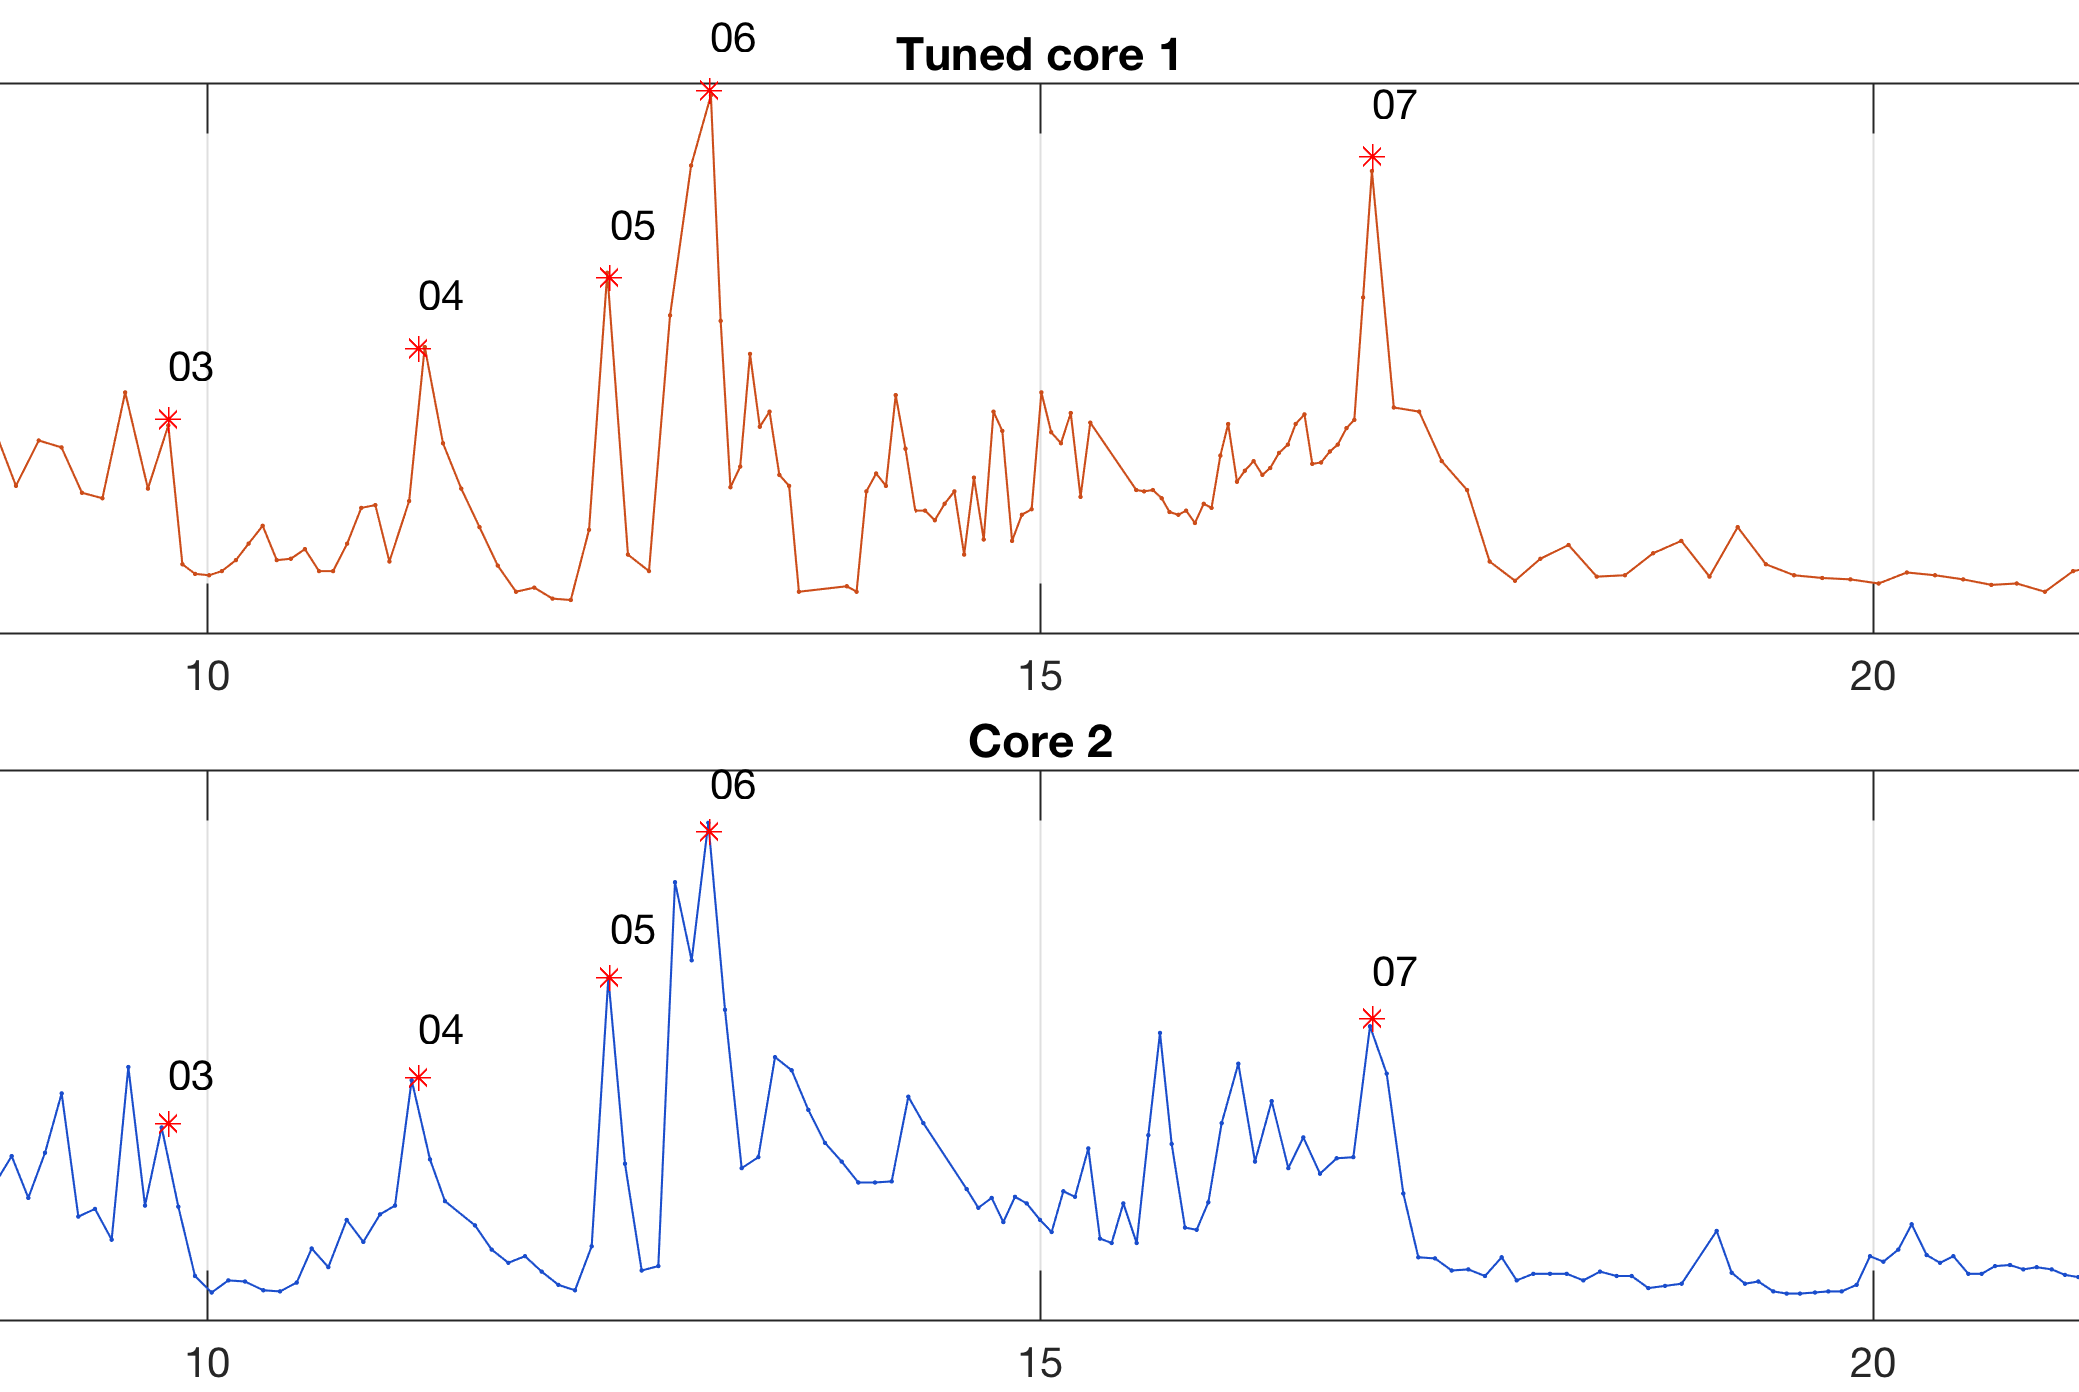
Time series of stable isotopes (oxygen, carbon) measured at foraminifers are often very noisy due to the combined effect of low sedimentation rates, intensive bioturbation and small sample sizes (5-20 foraminifers). Adaptive filters may help to increase the signal-to-noise ratio of such time series where conventional methods such as fixed filters cannot be applied if optimal filtering is to be achieved, because the signal-to-noise ratio is unknown and varies with time. Continue reading “Adaptive Filters in Paleoclimatology: Measure it Twice!”
Teaching Troubleshooting and Problem Solving
During my 30 years of teaching data analysis courses in earth sciences, I became increasingly aware that teaching troubleshooting is much more important than the actual application of data analysis methods. Continue reading “Teaching Troubleshooting and Problem Solving”
MRES 6th and PRES 2nd Errata Files

These is the for Python Recipes for Earth Sciences, 2nd Edition (Springer 2024) and MATLAB Recipes for Earth Sciences, 6th Edition (Springer 2024). Continue reading “MRES 6th and PRES 2nd Errata Files”
Probabilistic Age Modeling for Complex Stratigraphic Sequences

In an article published in Quaternary Geochronology (Trauth, 2014), I introduced a new method for modeling complex stratigraphic sequences. I would like to explain at this point what the result of the modeling is, and what it is not.
Continue reading “Probabilistic Age Modeling for Complex Stratigraphic Sequences”
Displaying Sediment Records with both Age and Depth Axis with MATLAB

Sediment data is typically display in diagrams with two axes, a core depth axis and an age axis. Here is a MATLAB script to convert depths into ages and display a sediment parameter in a diagram with both age and depth axis. Continue reading “Displaying Sediment Records with both Age and Depth Axis with MATLAB”
Follow MRES/PRES on Bluesky!

Following the latest political developments and the involvement of the operator of X (formerly known as Twitter), there is a veritable exodus from X to Bluesky. Please follow me there at @martinhtrauth.bsky.social and please also note the very, very well-put together Bluesky starter pack for Quaternary Scientists, put together by Christine Lane from the University of Cambridge. See you there!
Drawing Pollen Diagrams with MATLAB

Palynologists traditionally use the software Tilia by late Eric Grimm to plot their data, which is also used by micropaleontologists. Here is a MATLAB script to create a diagram that is similar to the typical Tilia graphics.
Continue reading “Drawing Pollen Diagrams with MATLAB”
Cluster Analysis with MATLAB

Cluster analysis creates groups of objects that are very similar to one another compared with other individual objects or groups of objects. The aim of the method is to gain insights into the structure of a data set without predefining categories and therefore cluster analysis is a method of unsupervised learning. Continue reading “Cluster Analysis with MATLAB”


