Using DATASTORE to Work with Large Collections of Data

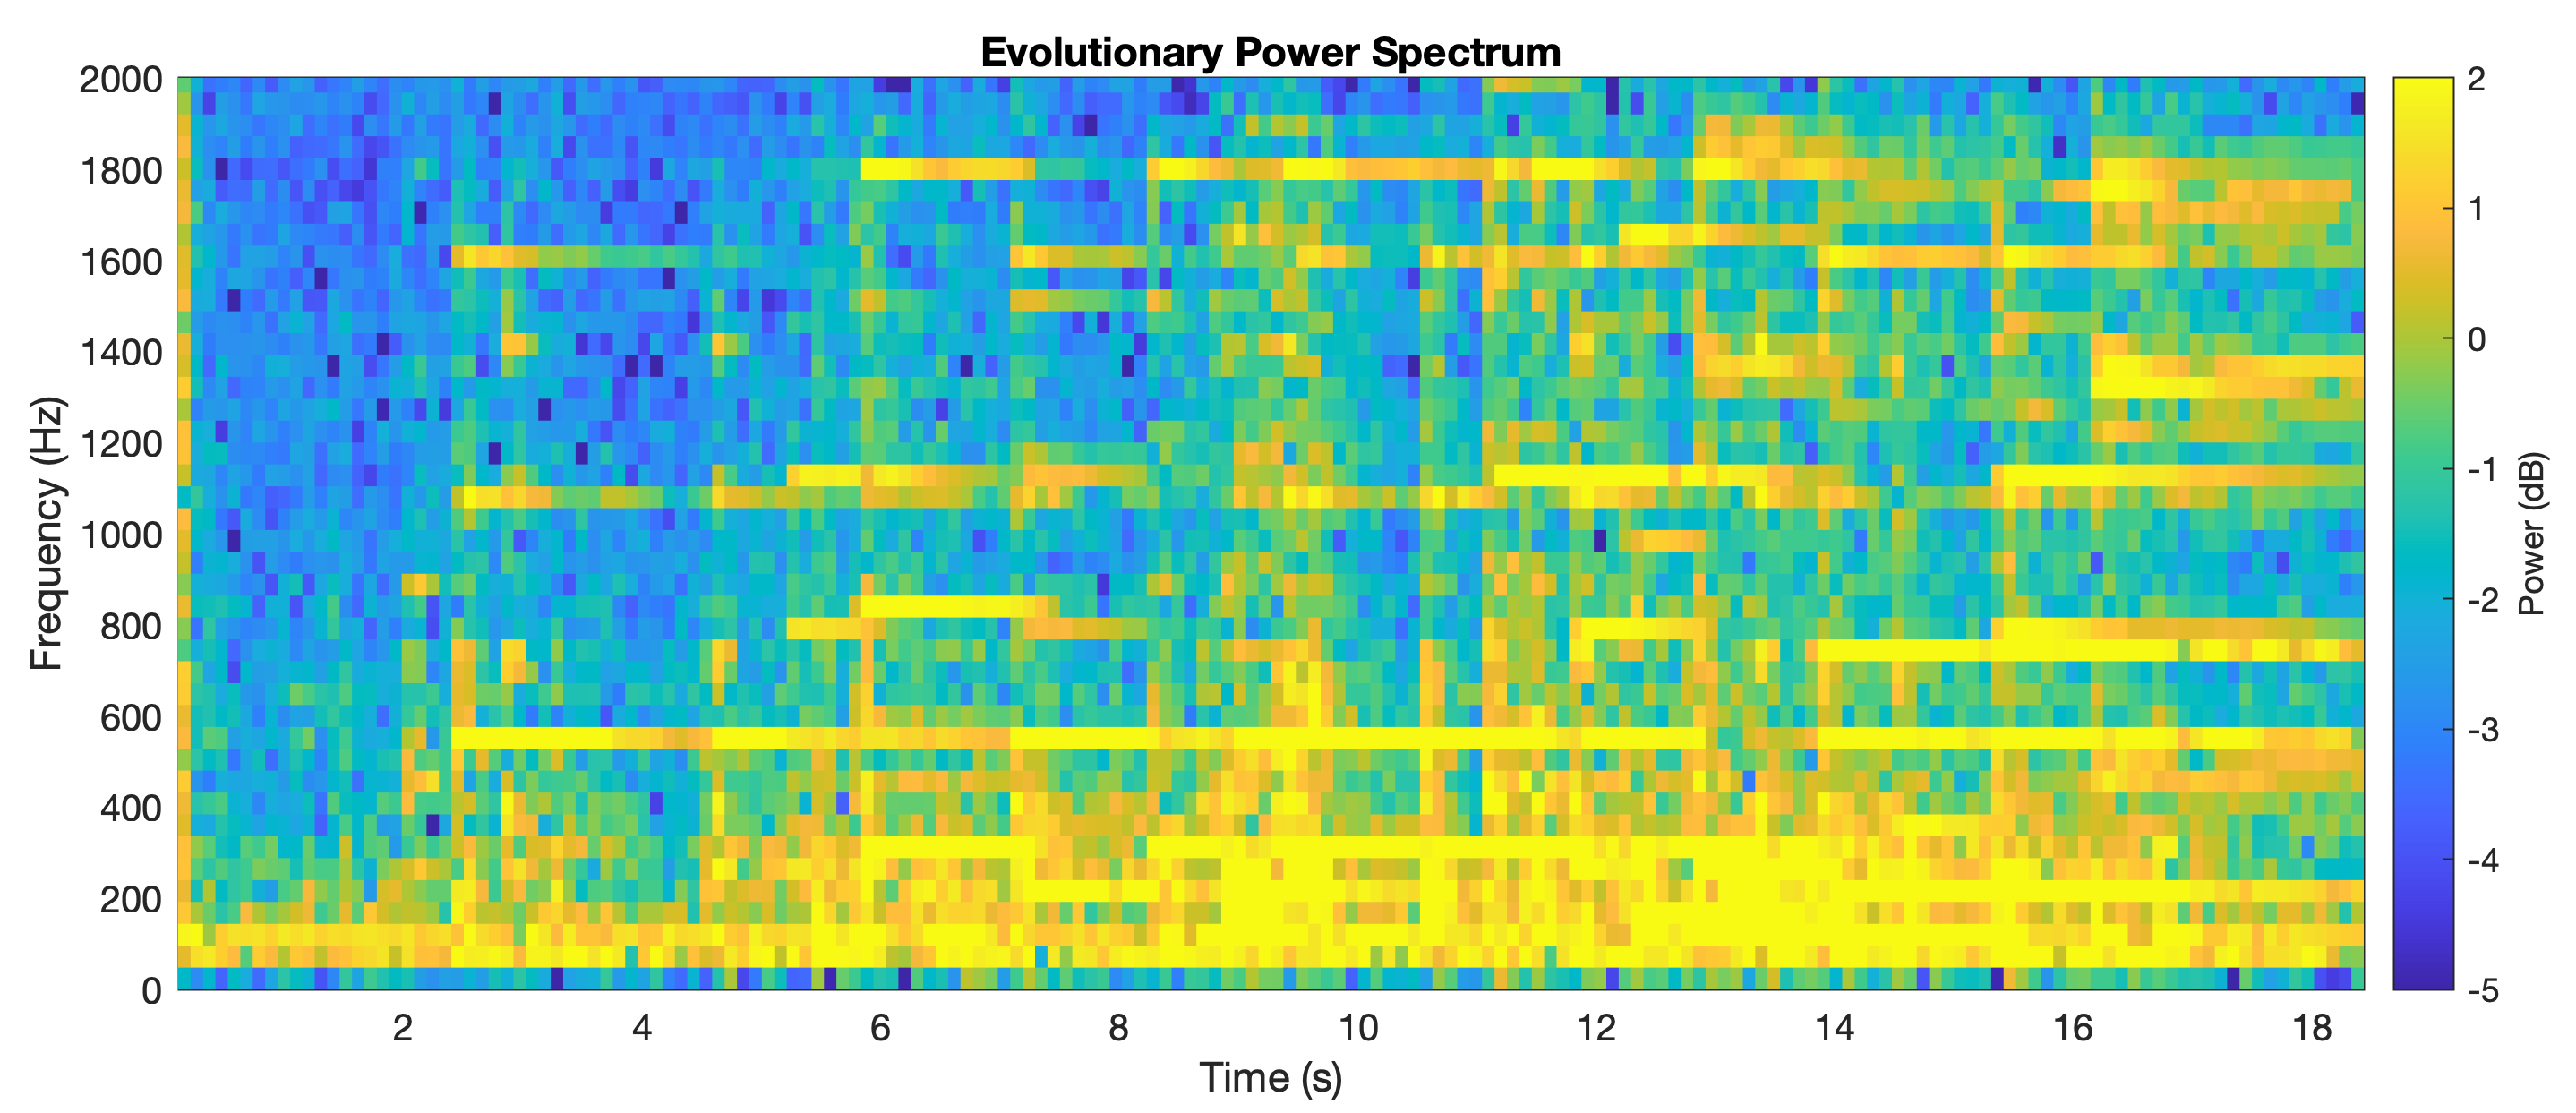
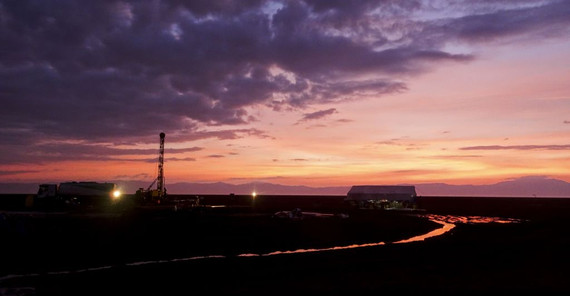
The function datastore can be used to handle large collections of data. As an example, the modern multisensor core loggers for the automatic determination of physical and chemical properties of drill cores generates huge amounts of data within a very short time. An array with 80 variables, each with 50,000 measured values, is not unusual. In addition, the corresponding files contain mixtures of character strings for core section names, measurement dates and times, and comments from the laboratory technician who carried out the measurements, along with the actual numeric readings.

Continue reading “Using DATASTORE to Work with Large Collections of Data”

Poster for the EGU General Assembly 2019 in Vienna 7–12 April 2019

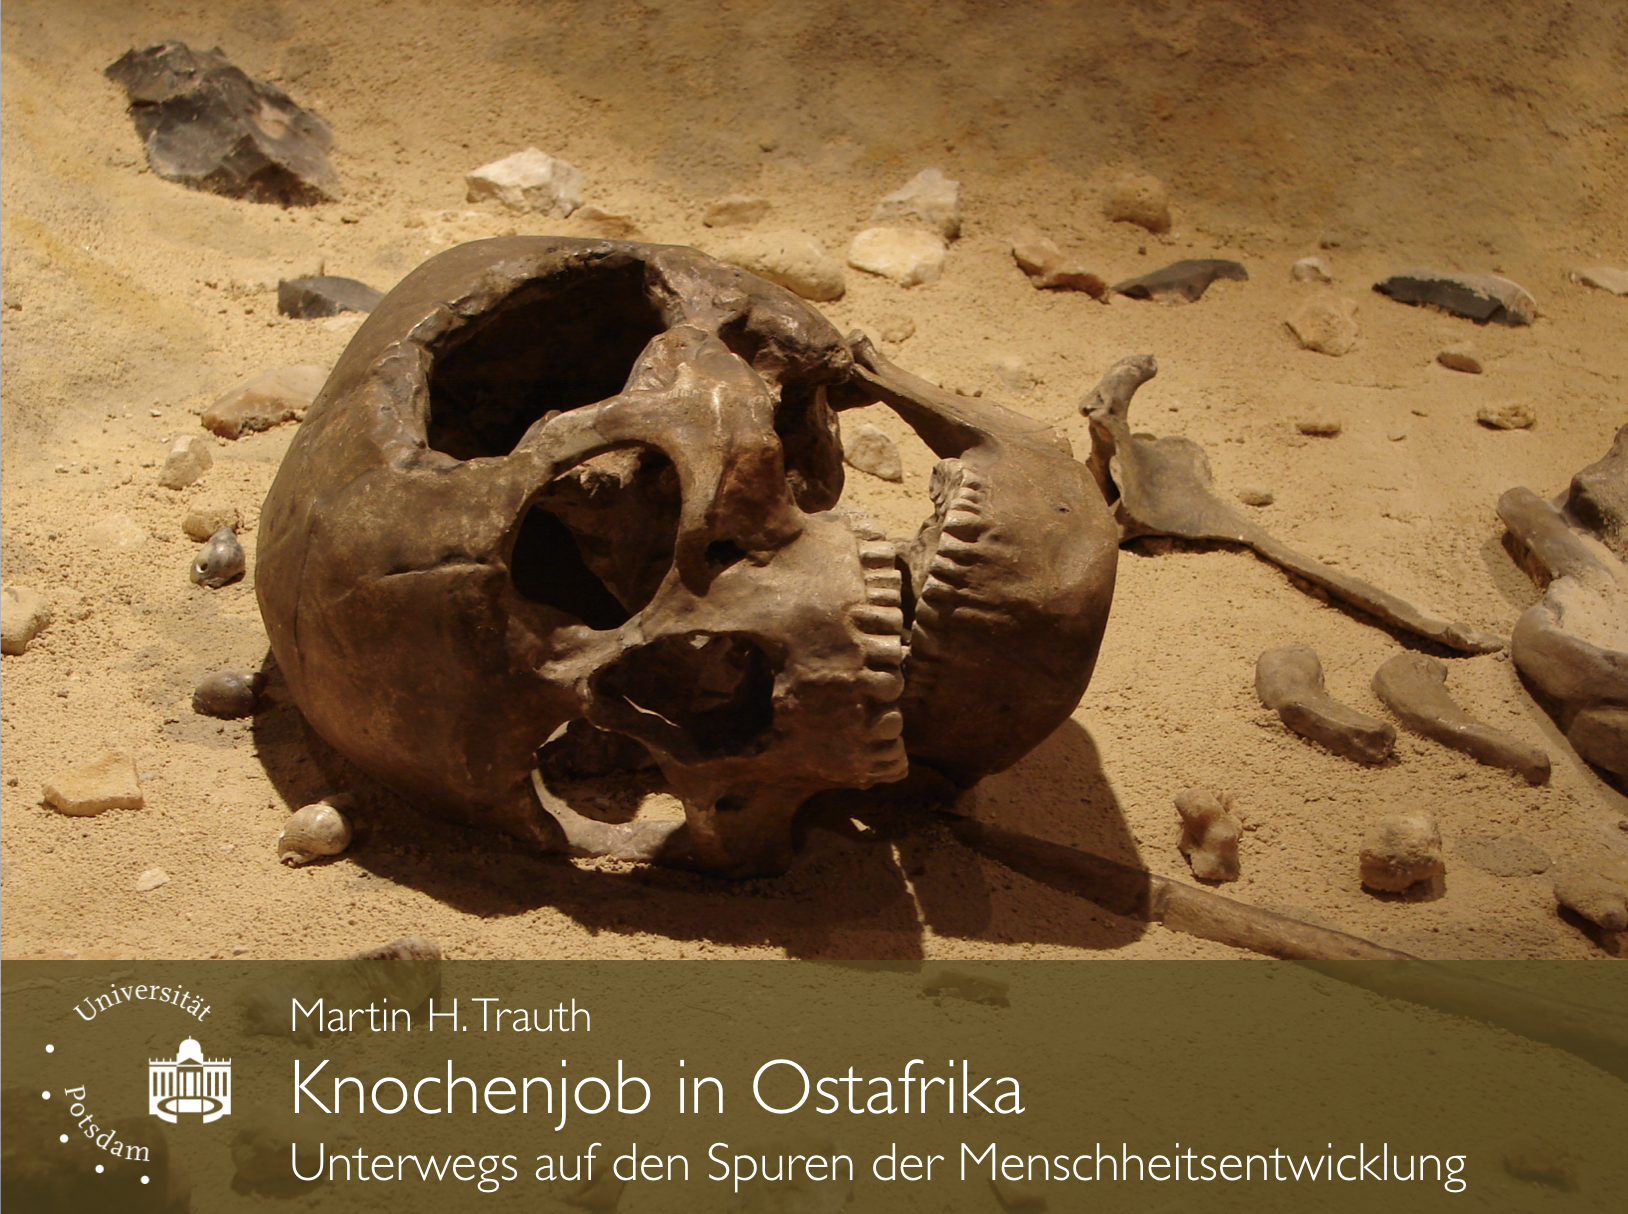
On Friday, April 12, 2019, I will present a poster at this year’s EGU General Assembly in Vienna, Austria in the Session SSP1.3 “Integrating stratigraphy, sedimentology, paleontology and paleoclimate in human evolution and dispersal studies – from early hominins to the Holocene“, organized by Verena Foerster and colleagues.

Continue reading “Poster for the EGU General Assembly 2019 in Vienna 7–12 April 2019”

Both MATLAB-Based Books again Springer Bestellers in Spring 2019

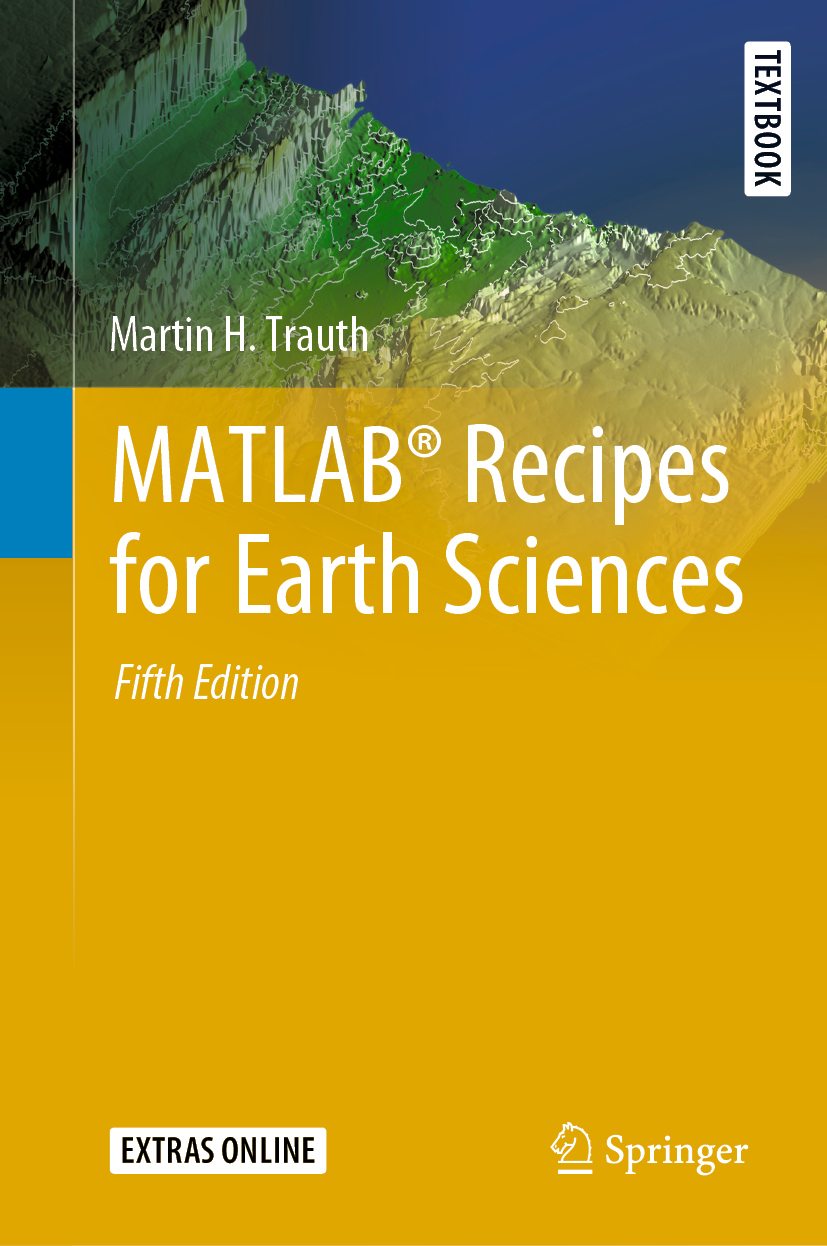
The book MATLAB Recipes for Earth Sciences” (Springer, 2015) is ranked 13th (hardcover) and 27 (softcover), the book “Collecting, Processing and Presenting Information in the Geosciences” (Springer, 2018, with Elisabeth Sillmann at BlaetterwaldDesign) is ranked 46th in the Top 100 out of >4,600 books in Earth Sciences, Geography & Environment of Springer. Thanks to all readers for buying the book!

MATLAB Code of “Classifying past climate change in the Chew Bahir basin …” (Trauth et al., Clim Dyn 2019)

Here you find the MATLAB code of our paper “Classifying past climate change in the Chew Bahir basin, southern Ethiopia, using recurrence quantification analysis” accepted for publication by Springer journal Climate Dynamics. Continue reading “MATLAB Code of “Classifying past climate change in the Chew Bahir basin …” (Trauth et al., Clim Dyn 2019)”

Shading Areas Between Two Curves With MATLAB

Our paleoclimate time series often contain too much detail, i.e. they have a high variance in the high frequency range. Of course, this can be true climate variability, but it usually contains a lot of noise. Therefore we like to plot a filtered variant of the curve together with the original curve and fill the area between the two. Here I show you how it works with MATLAB. Continue reading “Shading Areas Between Two Curves With MATLAB”