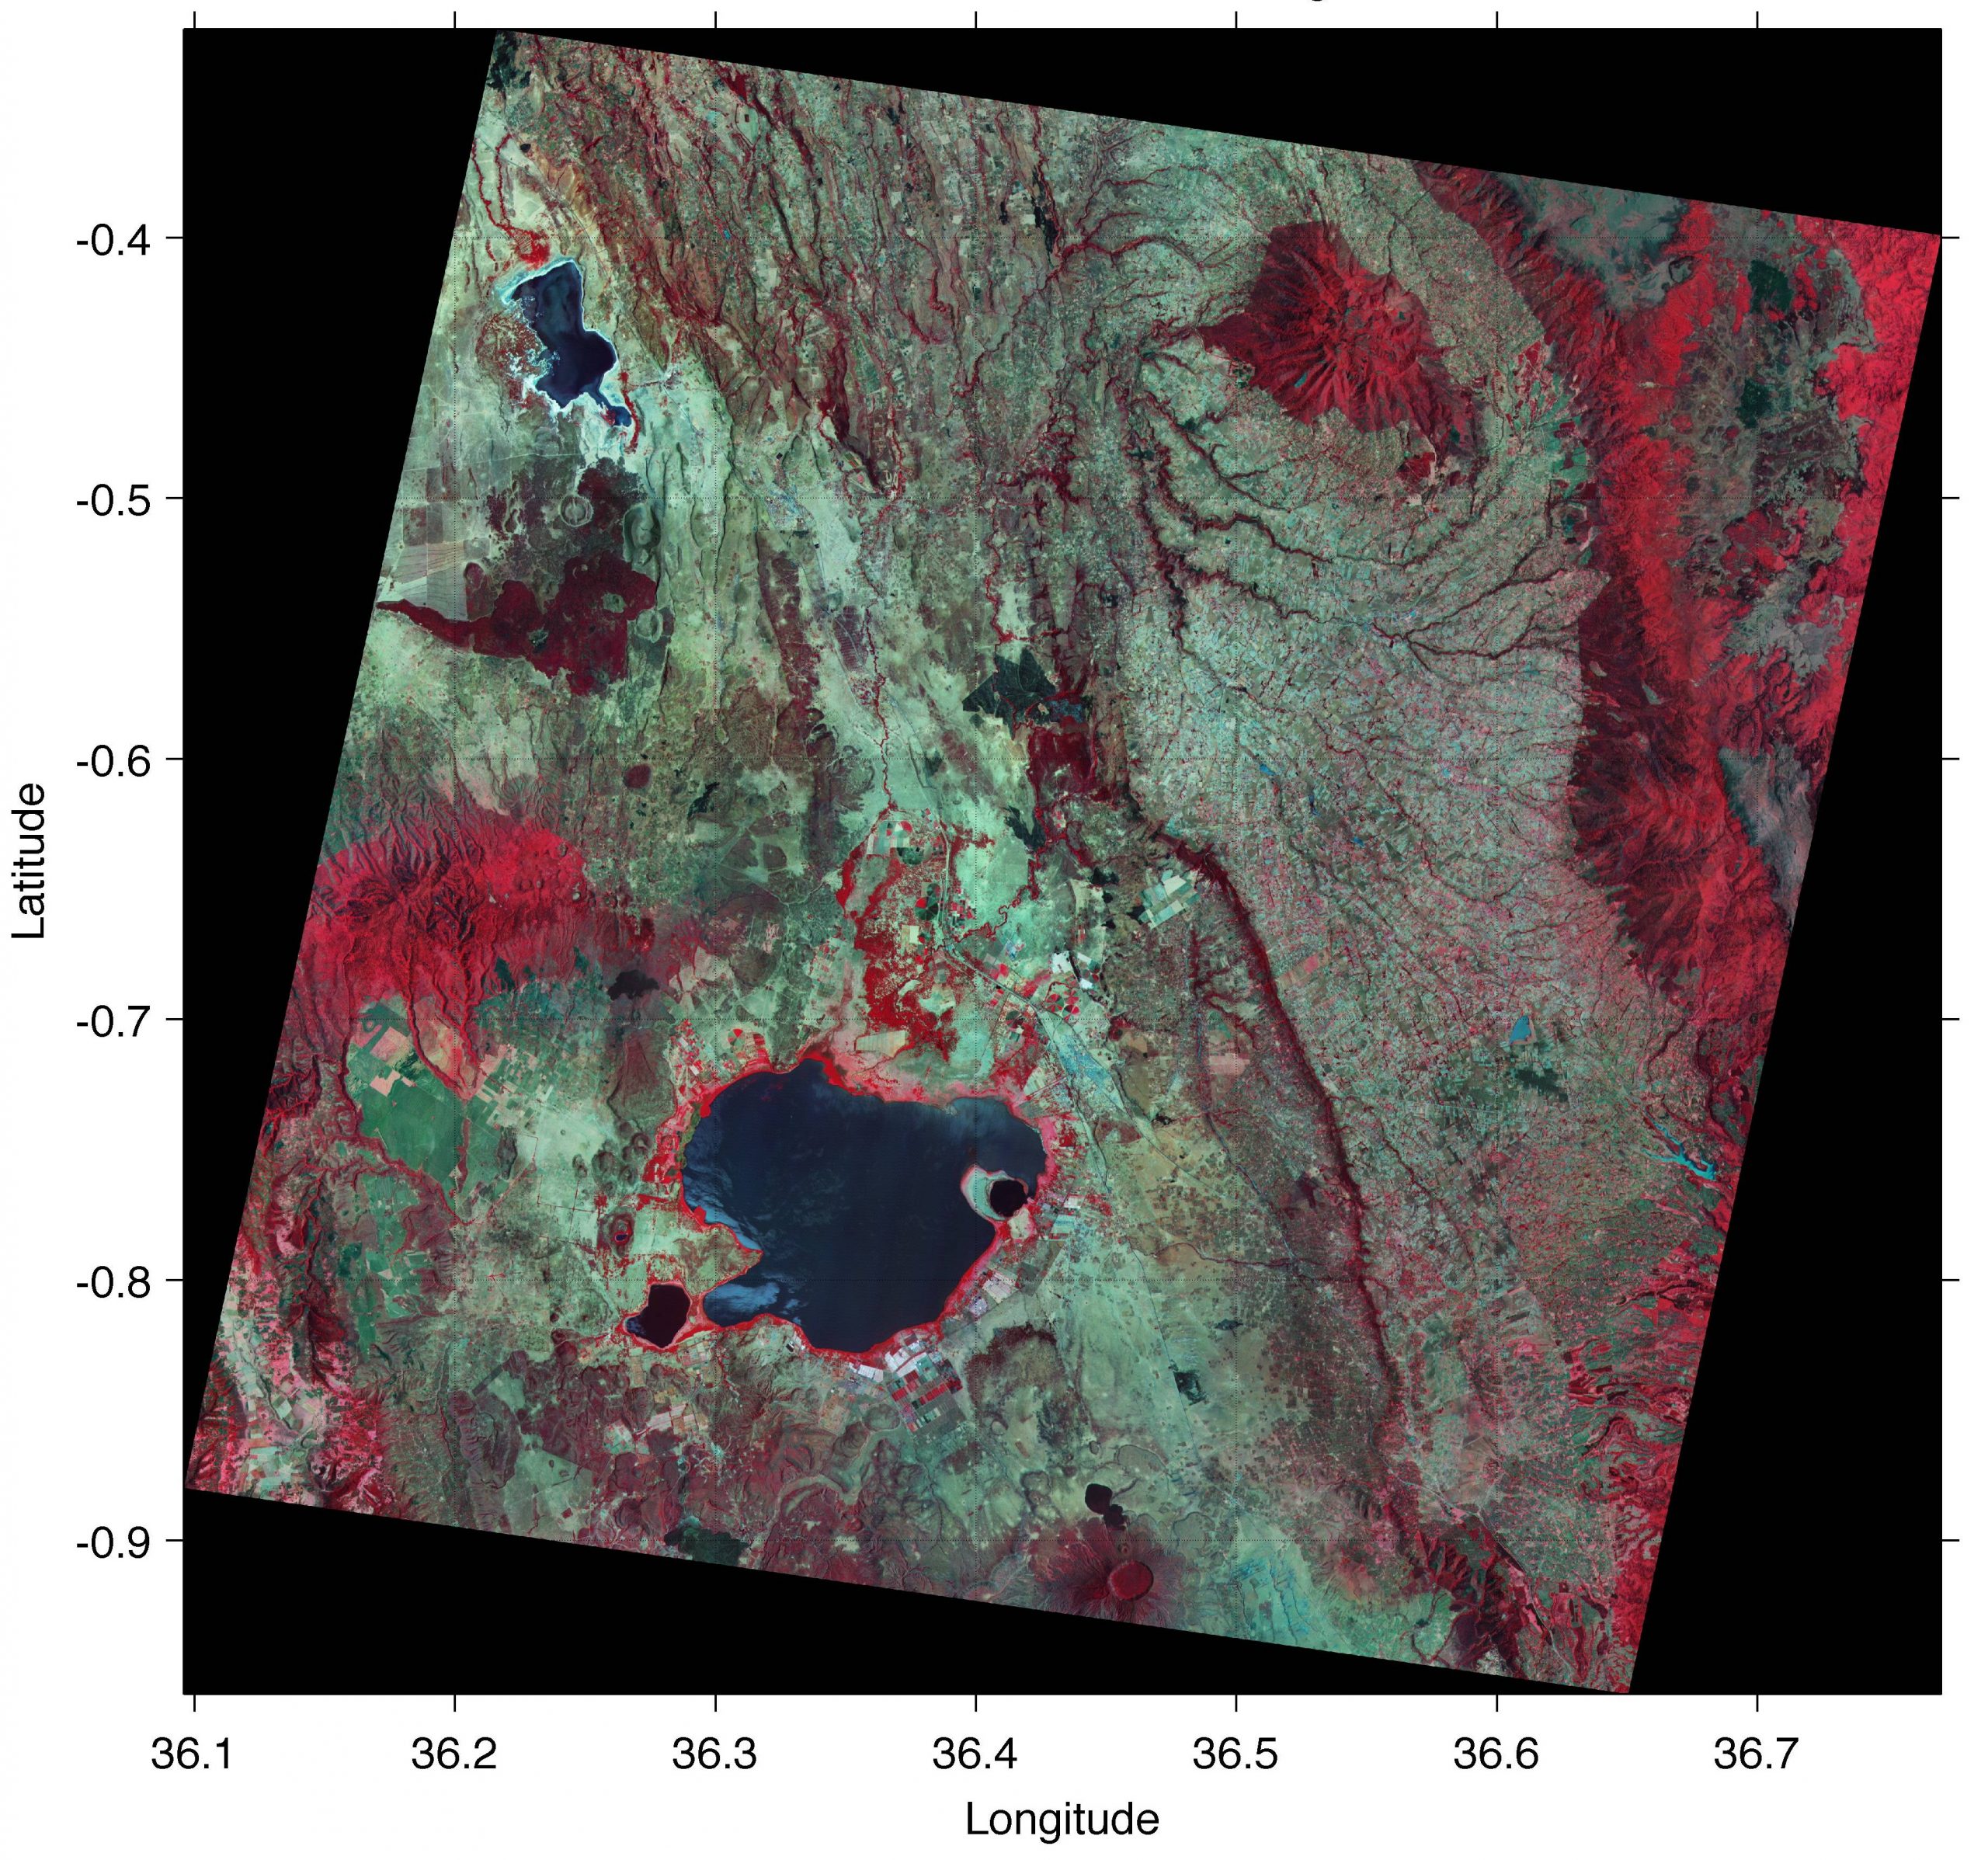
Since 1 April 2016 all ASTER data products are free to all users. Here is an updated MATLAB script to import, enhance and georeference an ASTER image with MATLAB, different from that published in the 5th edition of MRES and the published earlier on this blog. Continue reading “Importing and Georeferencing TERRA ASTER Images with MATLAB, Part 2”
Create Publishable Graphics with MATLAB … or Python?
My blog post “Create Publishable Graphics with MATLAB, Part 1” goes viral! Matt Hank, subsurface data scientist and founder of Subsurface Underground, and Maurizio Petrelli, professor at U Perugia and author of the Introduction to Python in Earth Science Data Analysis book (Springer 2021), took up the challenge and converted my MATLAB code to Python! The result doesn’t look too bad I have admit! Continue reading “Create Publishable Graphics with MATLAB … or Python?”
New Textbook “Signal and Noise in Geosciences” (Springer 2021)
The new textbook “Signal and Noise in Geosciences” (Springer 2021) introduces methods of data acquisition in geosciences using MATLAB together with inexpensive data acquisition systems, such as the sensors on board of smartphones, sensors that come with the LEGO MINDSTORMS set, webcams with stereo microphones, affordable spectral and thermal cameras. Continue reading “New Textbook “Signal and Noise in Geosciences” (Springer 2021)”
MATLAB Recipes in Three Different Languages
Online Lecture for the Association for the Highly Gifted Child and Young People
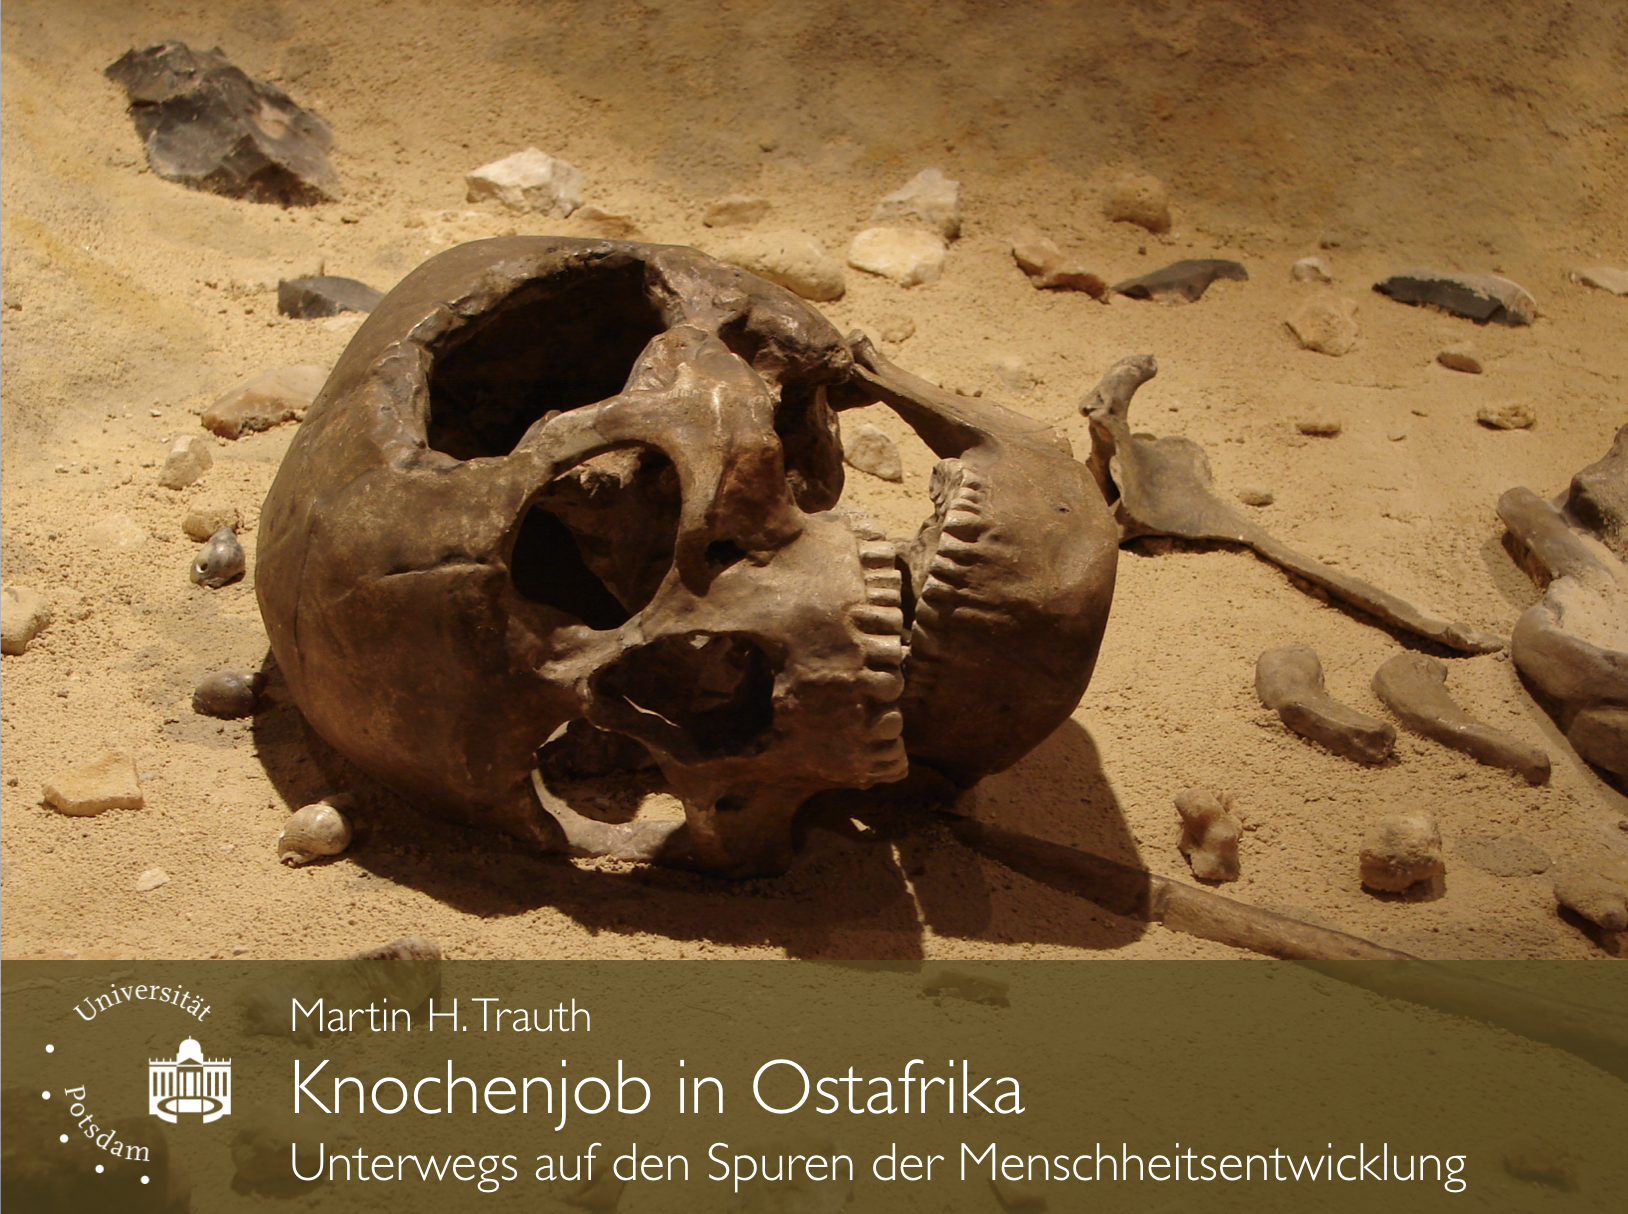
On 20 November 2021 I will teach a lecture on “How climate influenced the evolution of early humans” for the Association for the Highly Gifted Child and Young People (DGhK Berlin-Brandenburg).
MATLAB®-Rezepte für die Geowissenschaften
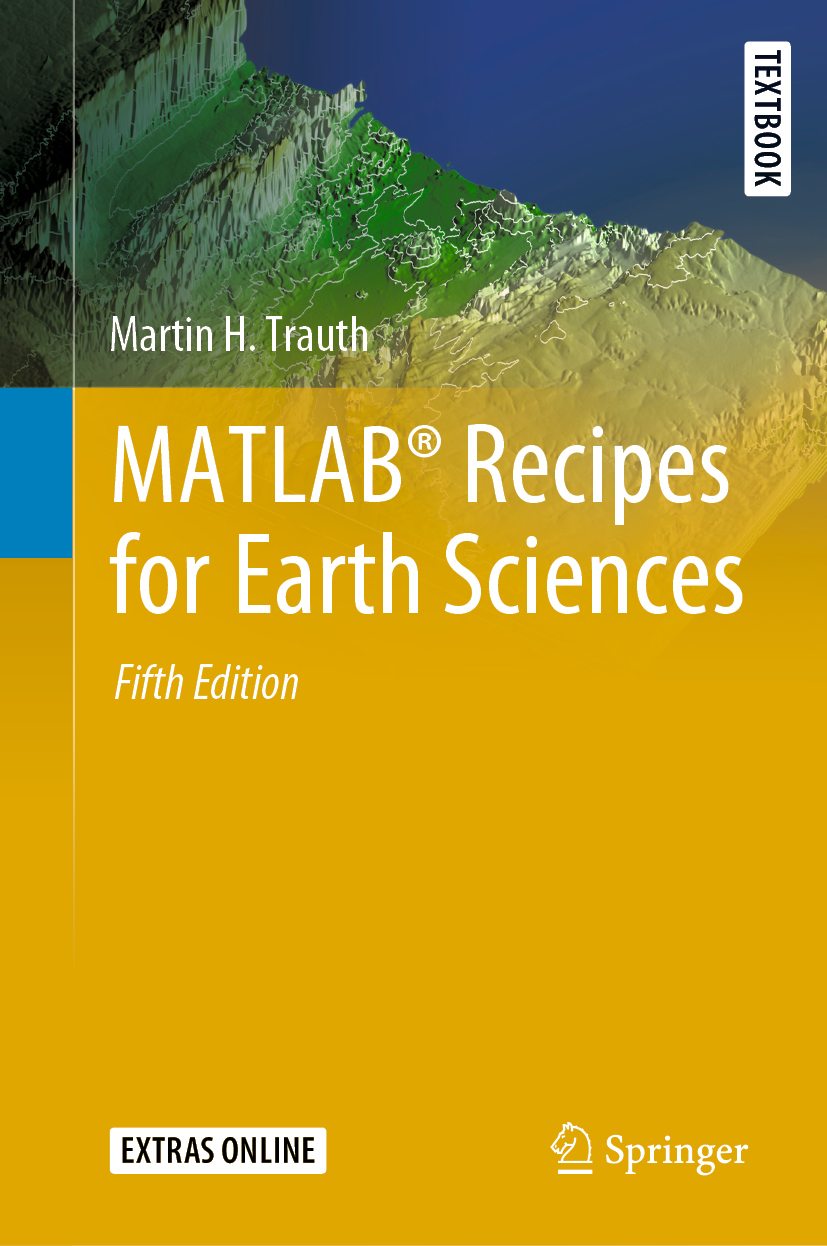
The 5th edition of my textbook MATLAB Recipes for Earth Sciences will soon be available in German, corrected and updated. Continue reading “MATLAB®-Rezepte für die Geowissenschaften”
MRES Ranked 10th in Earth Sciences, Geography & Environment of Springer
The book “MATLAB Recipes for Earth Sciences” (Springer, 2021) is ranked 10th (fall 2021) in the Top 100 out of more than 4,600 books in Earth Sciences, Geography & Environment of Springer. Thanks to all readers for buying the book!
Public Online Lecture during the University of Potsdam Children’s University
On 24 September 2021 the University of Potsdam will open virtual lecture halls for 1,250 children aged 8–10 in order to inspire them for the world of science. During the event I will teach a lecture on climate change and human evolution during the Children’s University Potsdam.


