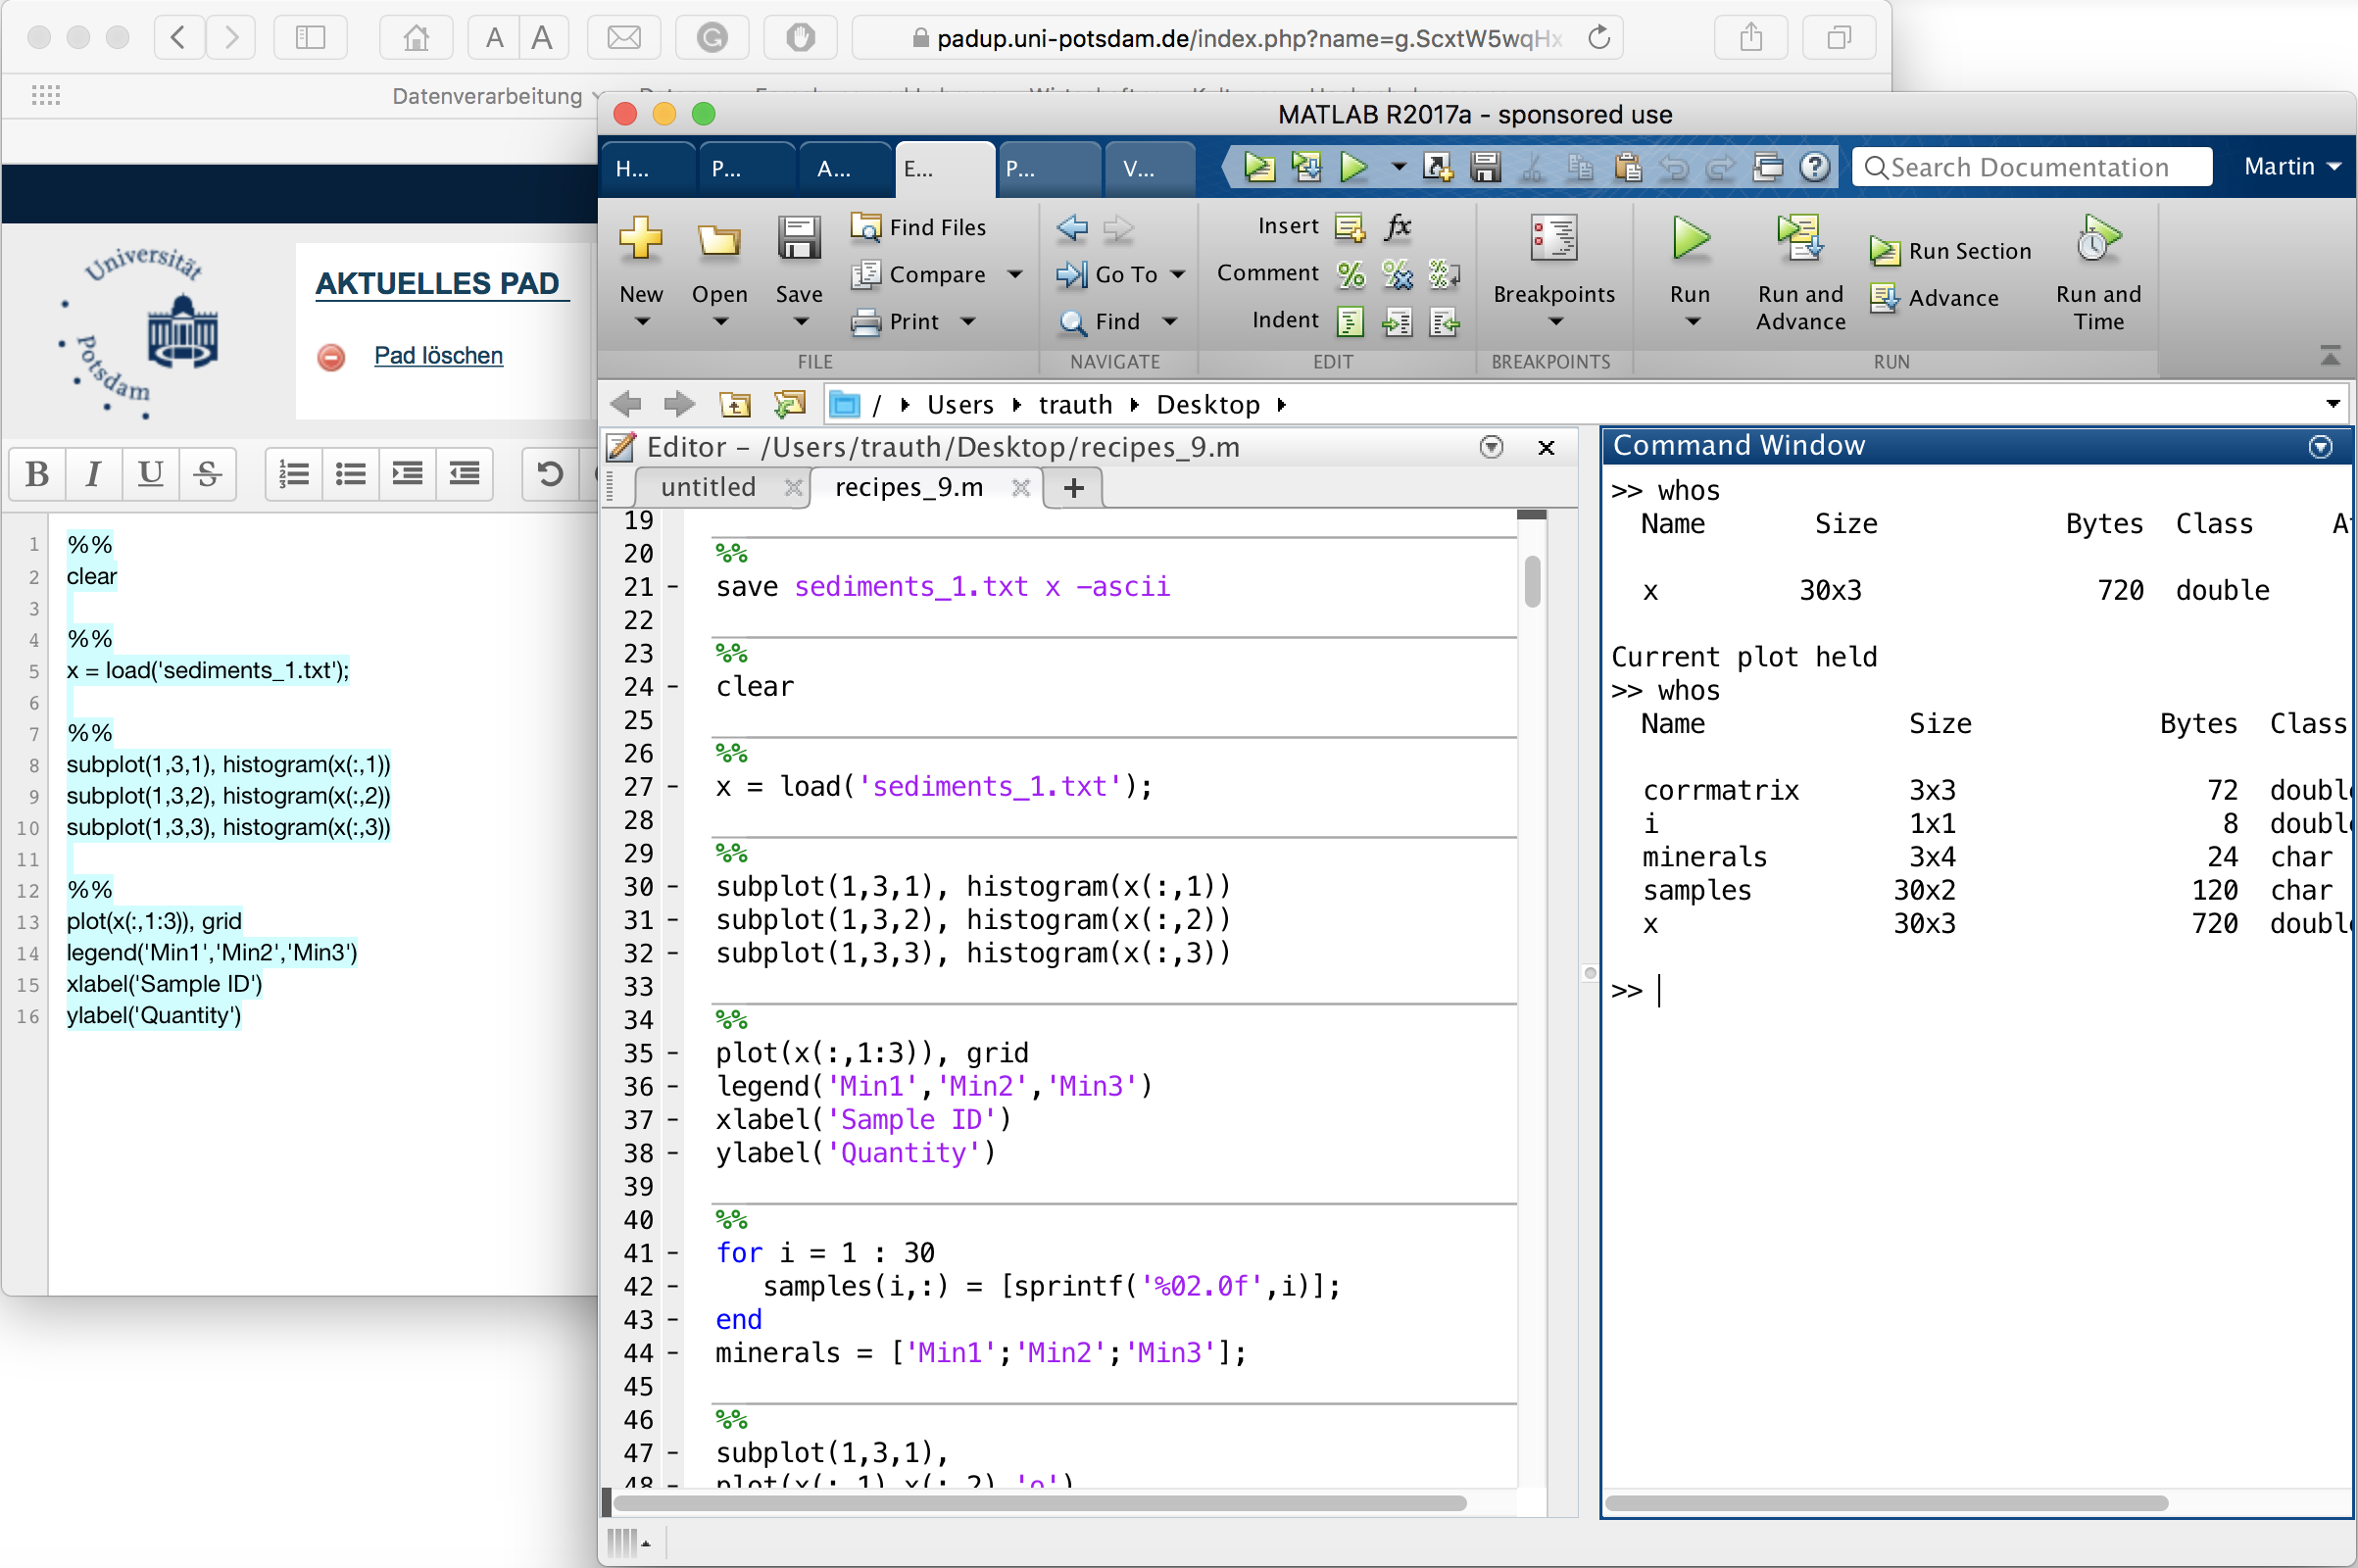

In a series of blog posts, I will tell you a little about how I teach computational geosciences with MATLAB. After the work environment is set up and resources are presented with information about MATLAB, I show a very simple example of the typical workflow with MATLAB. The main goal of this is to show beginners how easy it is to get into this huge software.
Continue reading “Teaching Computational Geosciences with MATLAB, Part 3: Intro to MATLAB”