
We wanted to display pulsating circles on a map and save the result in a video. Here is part one, the pulsating circles. The map will come in the next post.
The idea is to show climate time series of different stations on a map, where the value of the climate variable defines the diameter and color of filled circles. We first tried it with geobubbles, but there the use of color is a bit tricky. Since we are working on the equator, therefore do not need projections, and already have a script to create the map from our recent publications, we switched to bubblechart.
First choose the number of circles n, the number of frames m and the maximum size of the circles s.
n = 5;
m = 50;
s = 10;
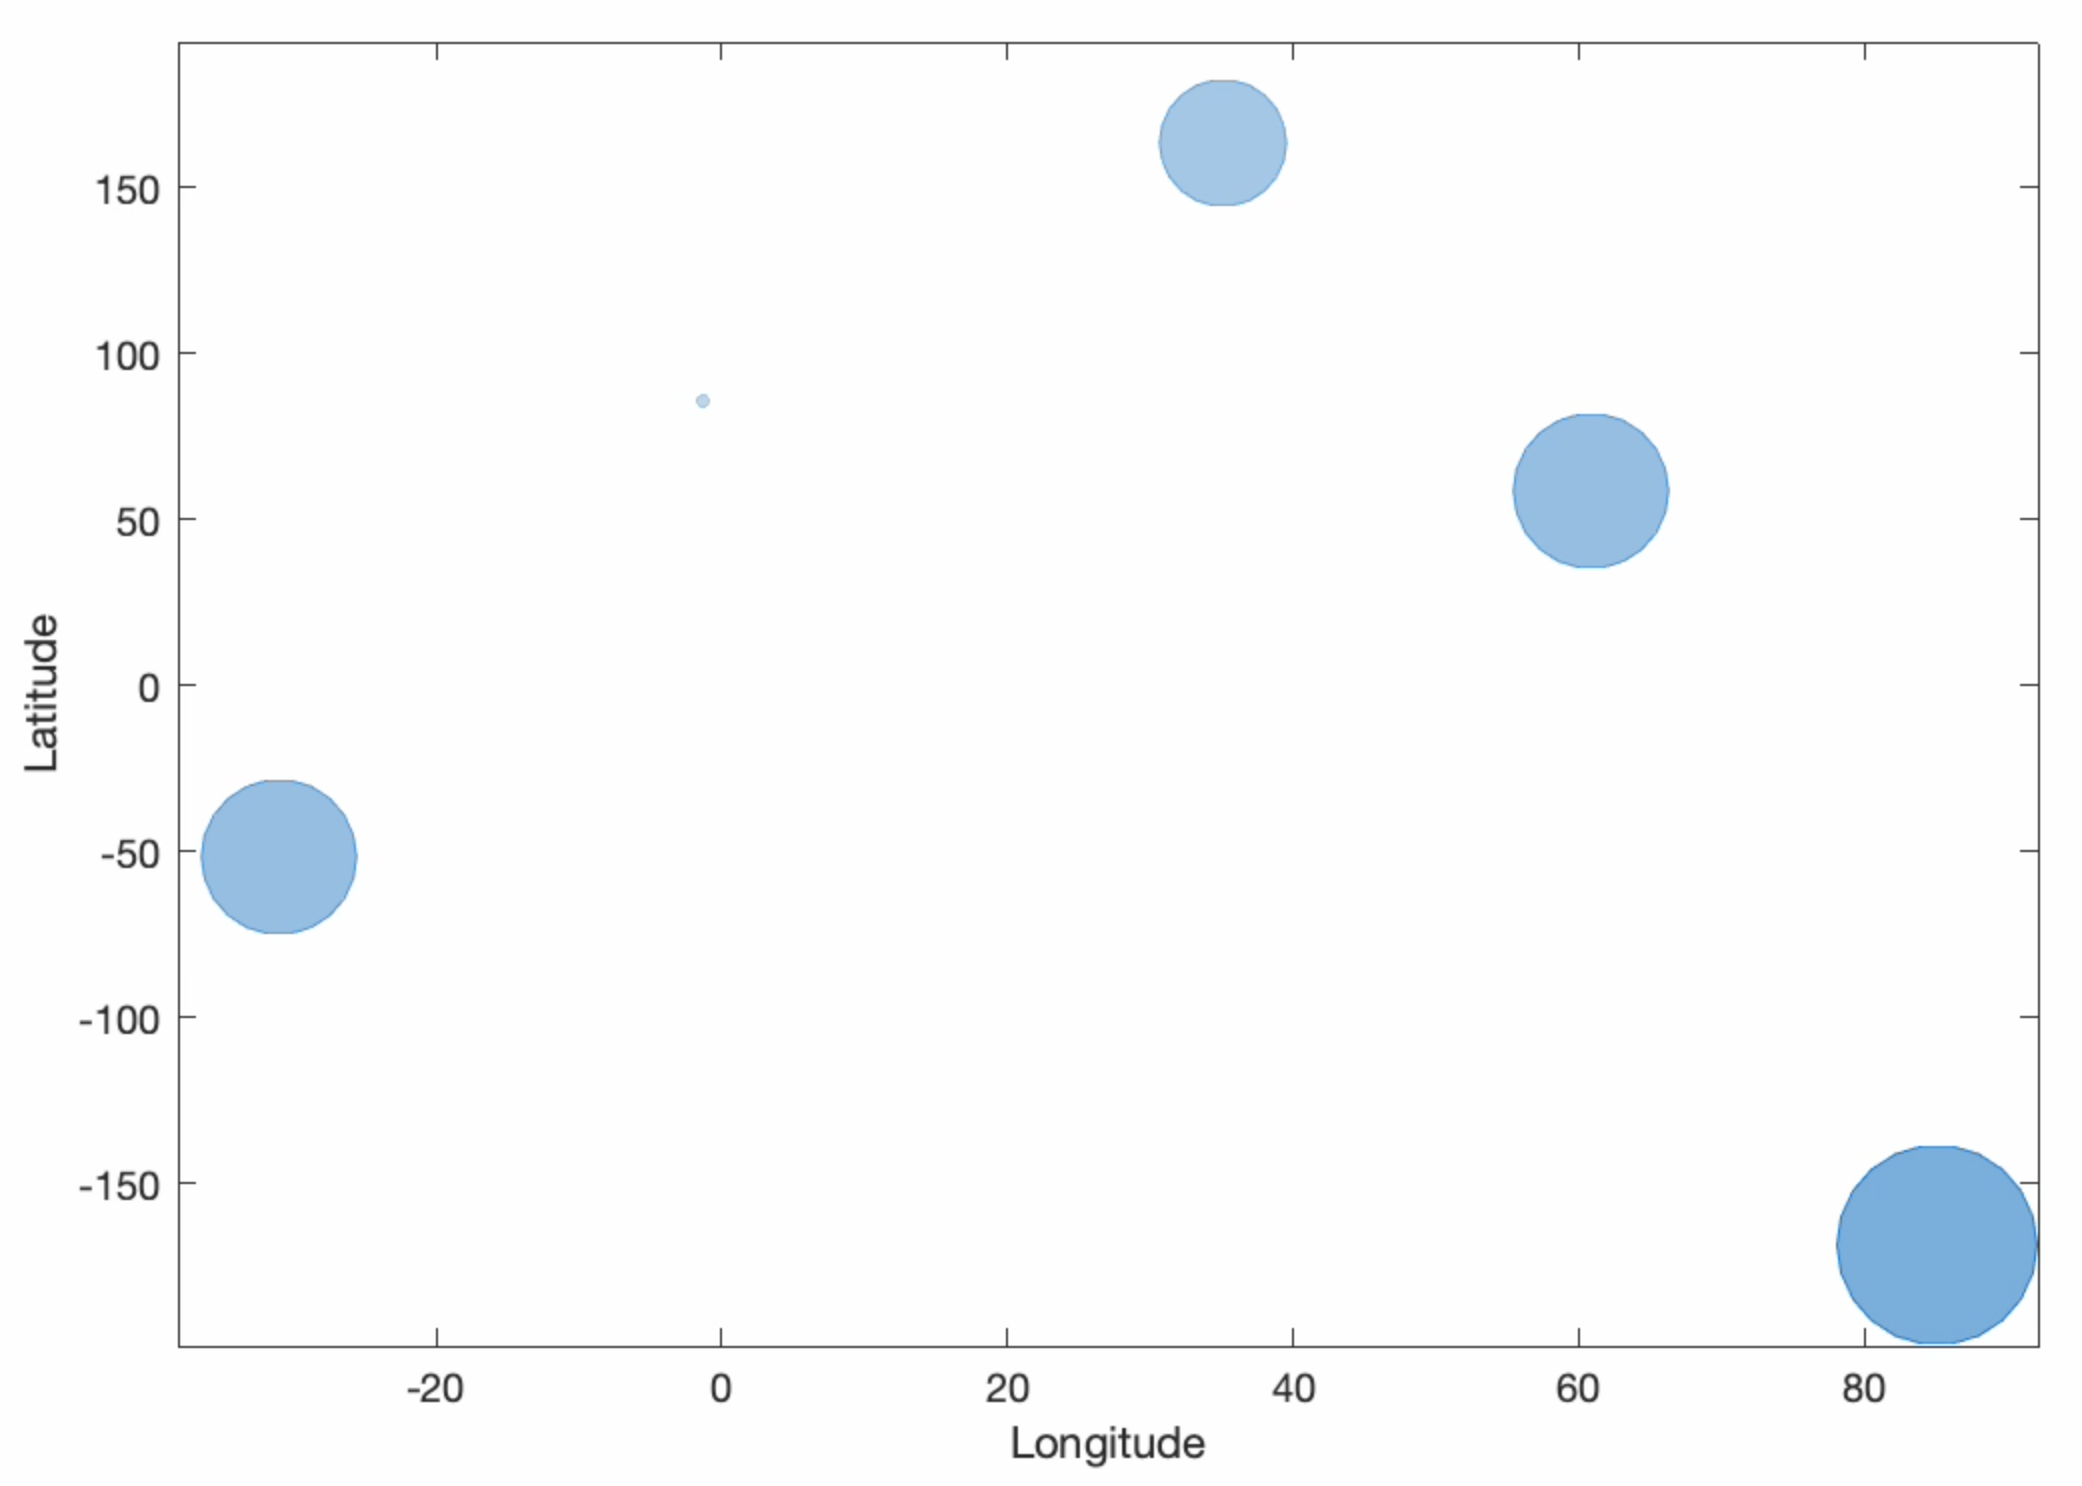
Then, we create example data for longitude, latitude and size of the bubbles, e.g., the value of the climate variable. In your example, these are of course the actual coordinates of your climate stations and the values of your time series.
lon = 180*rand(n,1)-90;
lat = 360*rand(n,1)-180;
bsize = ceil(s*rand(n,m));
We also need colors, for example, 10 color levels using the new MATLAB colormap sky.
colors = sky(10);
Next, we prepare the video file bubblesvideo.mp4 using VideoWriter, define the frame rate of 5 frame per second, the video quality of 100%, and then we open the file.
v = VideoWriter('bubblesvideo.mp4','MPEG-4');
v.FrameRate = 5;
v.Quality = 100;
open(v)
Then we run the animation and record the video by typing
for i = 1 : m
   bcolor = colors(bsize(:,i),:);
   figure('Position',[100 100 600 400],...
      'Color',[1 1 1])
   bubblechart(lon,lat,bsize(:,i),bcolor)
   xlabel('Longitude')
   ylabel('Latitude')
   frame = getframe(gcf);
   writeVideo(v,frame);
end
Finally we close the video file and the Figure Windows by typing
close(v)
close all
The function writeVideo exports the animation in the MPEG-4 format. We can view, edit and convert the video by using the QuickTime Player, for computers running macOS, the VLC Media Player, available for macOS, Windows and Linux, or any other video player. More advanced video editors are available both for free download (e.g., Lightworks for macOS, Windows and Linux, iMovie for macOS) or for purchase (e.g., Adobe Premiere Pro CC for macOS and Windows).
References
Trauth, M.H., Sillmann, E. (2018) Collecting, Processing and Presenting Geoscientific Information, MATLAB® and Design Recipes for Earth Sciences – Second Edition. Springer International Publishing, 274 p., ISBN 978-3-662-56202-4.