
My blog post “Create Publishable Graphics with MATLAB, Part 1” goes viral! Matt Hank, subsurface data scientist and founder of Subsurface Underground, and Maurizio Petrelli, professor at U Perugia and author of the Introduction to Python in Earth Science Data Analysis book (Springer 2021), took up the challenge and converted my MATLAB code to Python! The result doesn’t look too bad I have admit!
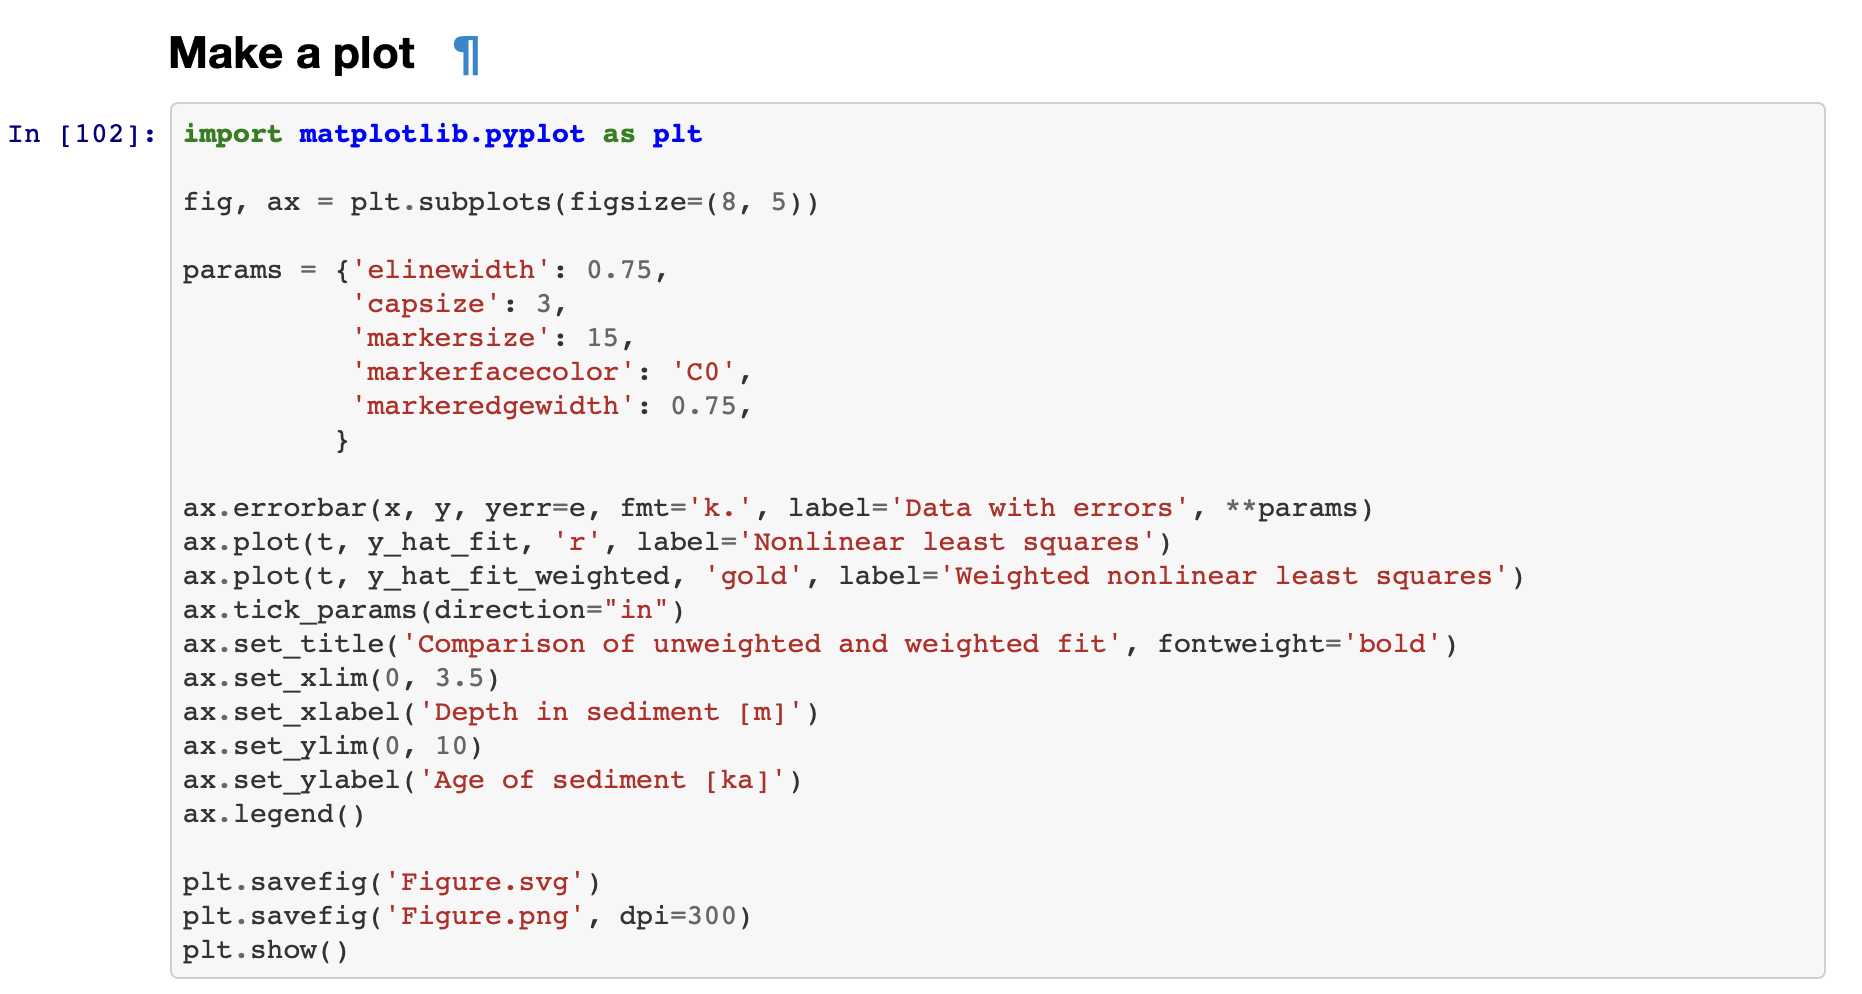
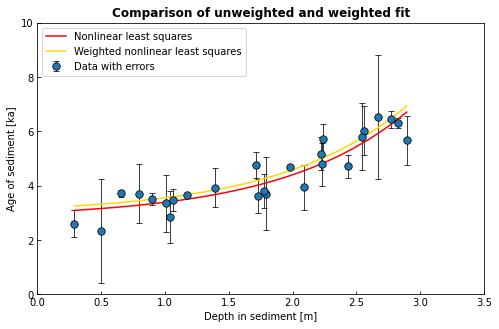
This is Matt’s Python result
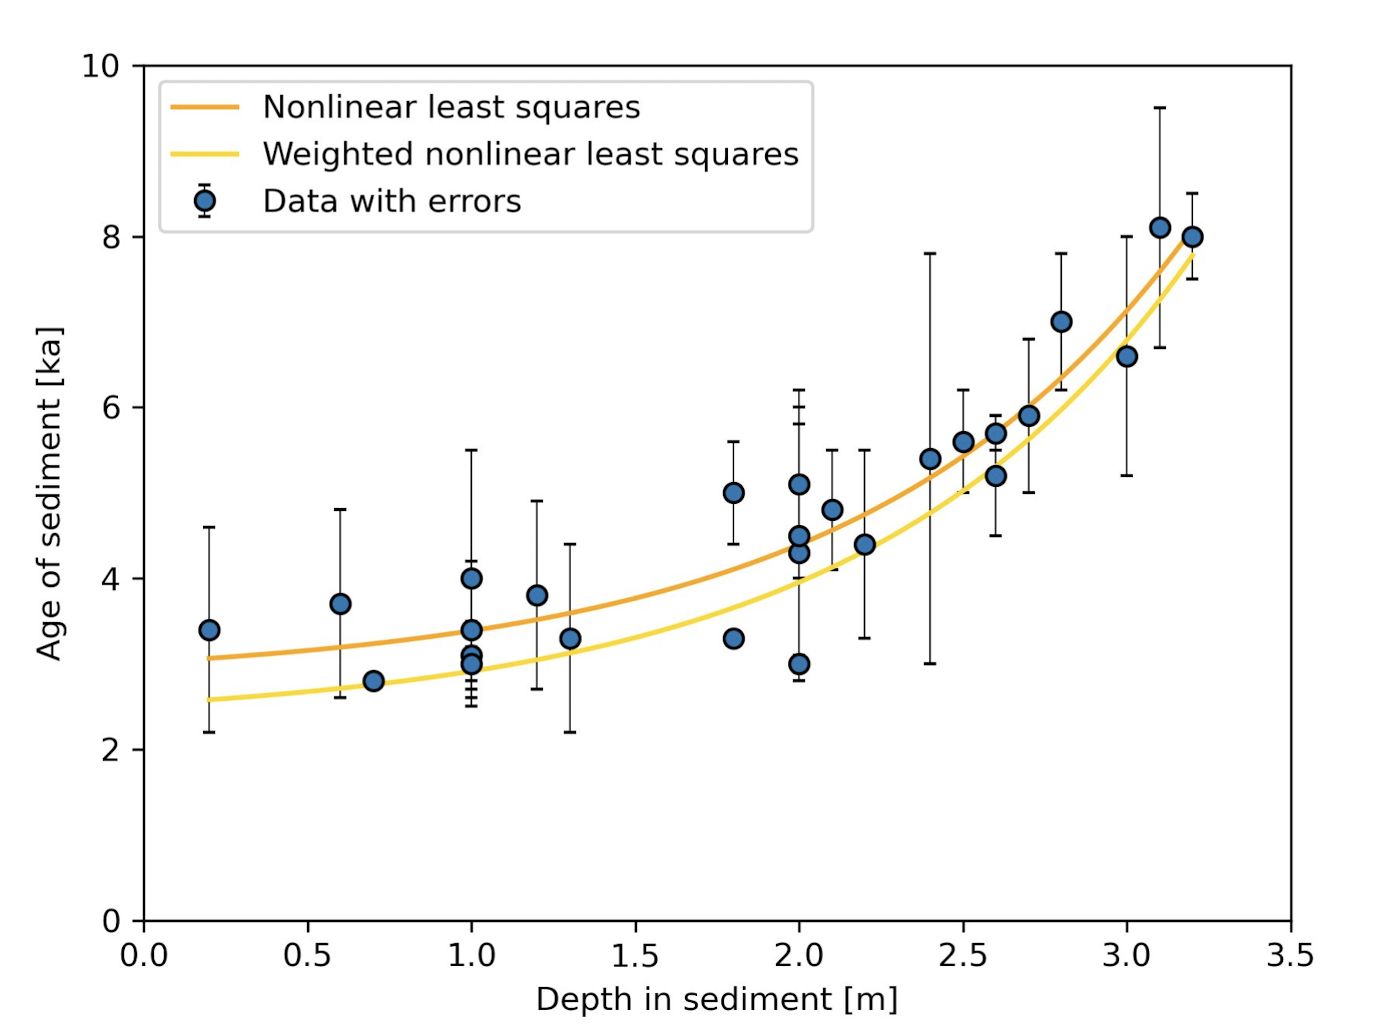
and the one by Maurizio’s
and was my MATLAB solution:
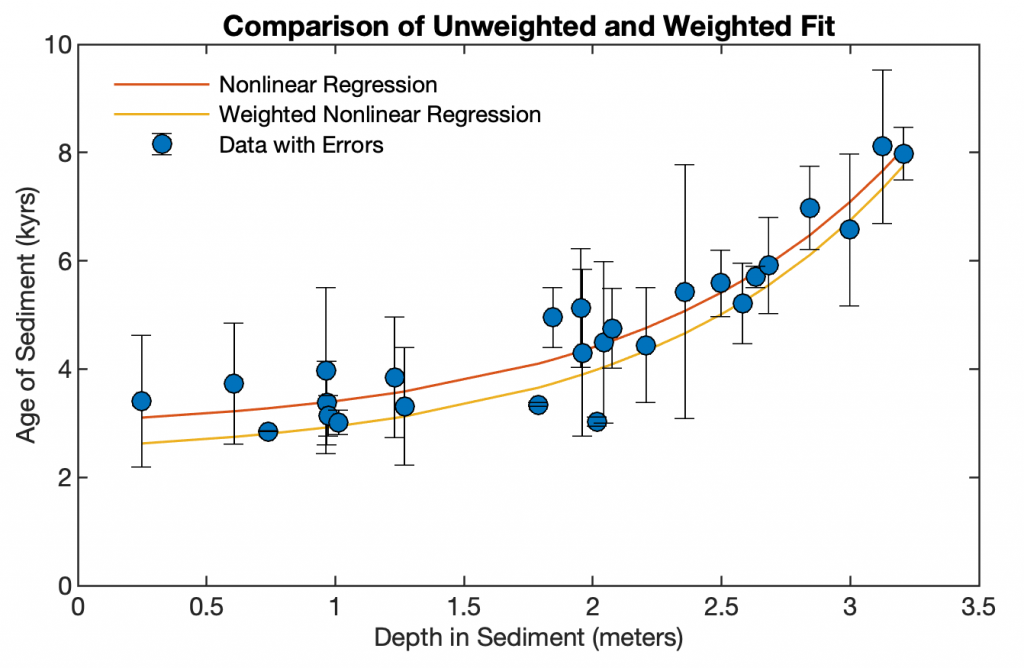
Maybe Matt and Maurizio need to work a little on the colors, but otherwise it’s really good! Very interesting is that Python seems to go in the opposite direction when defining graphic attributes / properties, defining axes and then changing the graphics properties. In my example, using the new MATLAB graphics introduced with R2014b, is defining the properties when defining the axes. Of course, you can do both in both languages. Thanks, Matt and Maurizio, I really enjoyed this MATLAB vs. Python challenge!