
MathWorks has removed the hdftool function which was a graphical user interface (GUI) based import tool for importing certain parts of hierarchical data format (HDF). Here is a workaround for the removed feature.
The hdftool function, used in Chapter 8.5 of the MRES book, was used to view and import parts of files in the hierarchical data format (HDF). The function opened a GUI that allowed us to browse the content of a HDF-file, obtains all information on the contents, and imported certain frequency bands of the satellite image. Since MATLAB R2020b typing
filename = 'naivasha.hdf'

hdftool(filename)
causes the error message while using the file included in the electronic supplement of the book.
Error using hdftool
HDFTOOL has been removed. Use HDFREAD instead to
programmatically import data from HDF4 or HDF-EOS
files.
MathWorks Support helped me develop a workaround for the function, unfortunately without explaining why the function was actually removed. Instead of hdftool it is recommended to use hdfinfo to find about the structure of the HDF file.
info = hdfinfo(filename)
which yields
info =

   struct with fields:

     Filename: 'naivasha.hdf'
   Attributes: [1×10 struct]
       Vgroup: [1×4 struct]
          SDS: [1×1 struct]
We can then use the series of commands
info.Vgroup
info.Vgroup.Name
info.Vgroup(2).Vgroup.Name
info.Vgroup(2).Vgroup(1).Vgroup.Name
info.Vgroup(2).Vgroup(1).Vgroup(2).SDS.Name
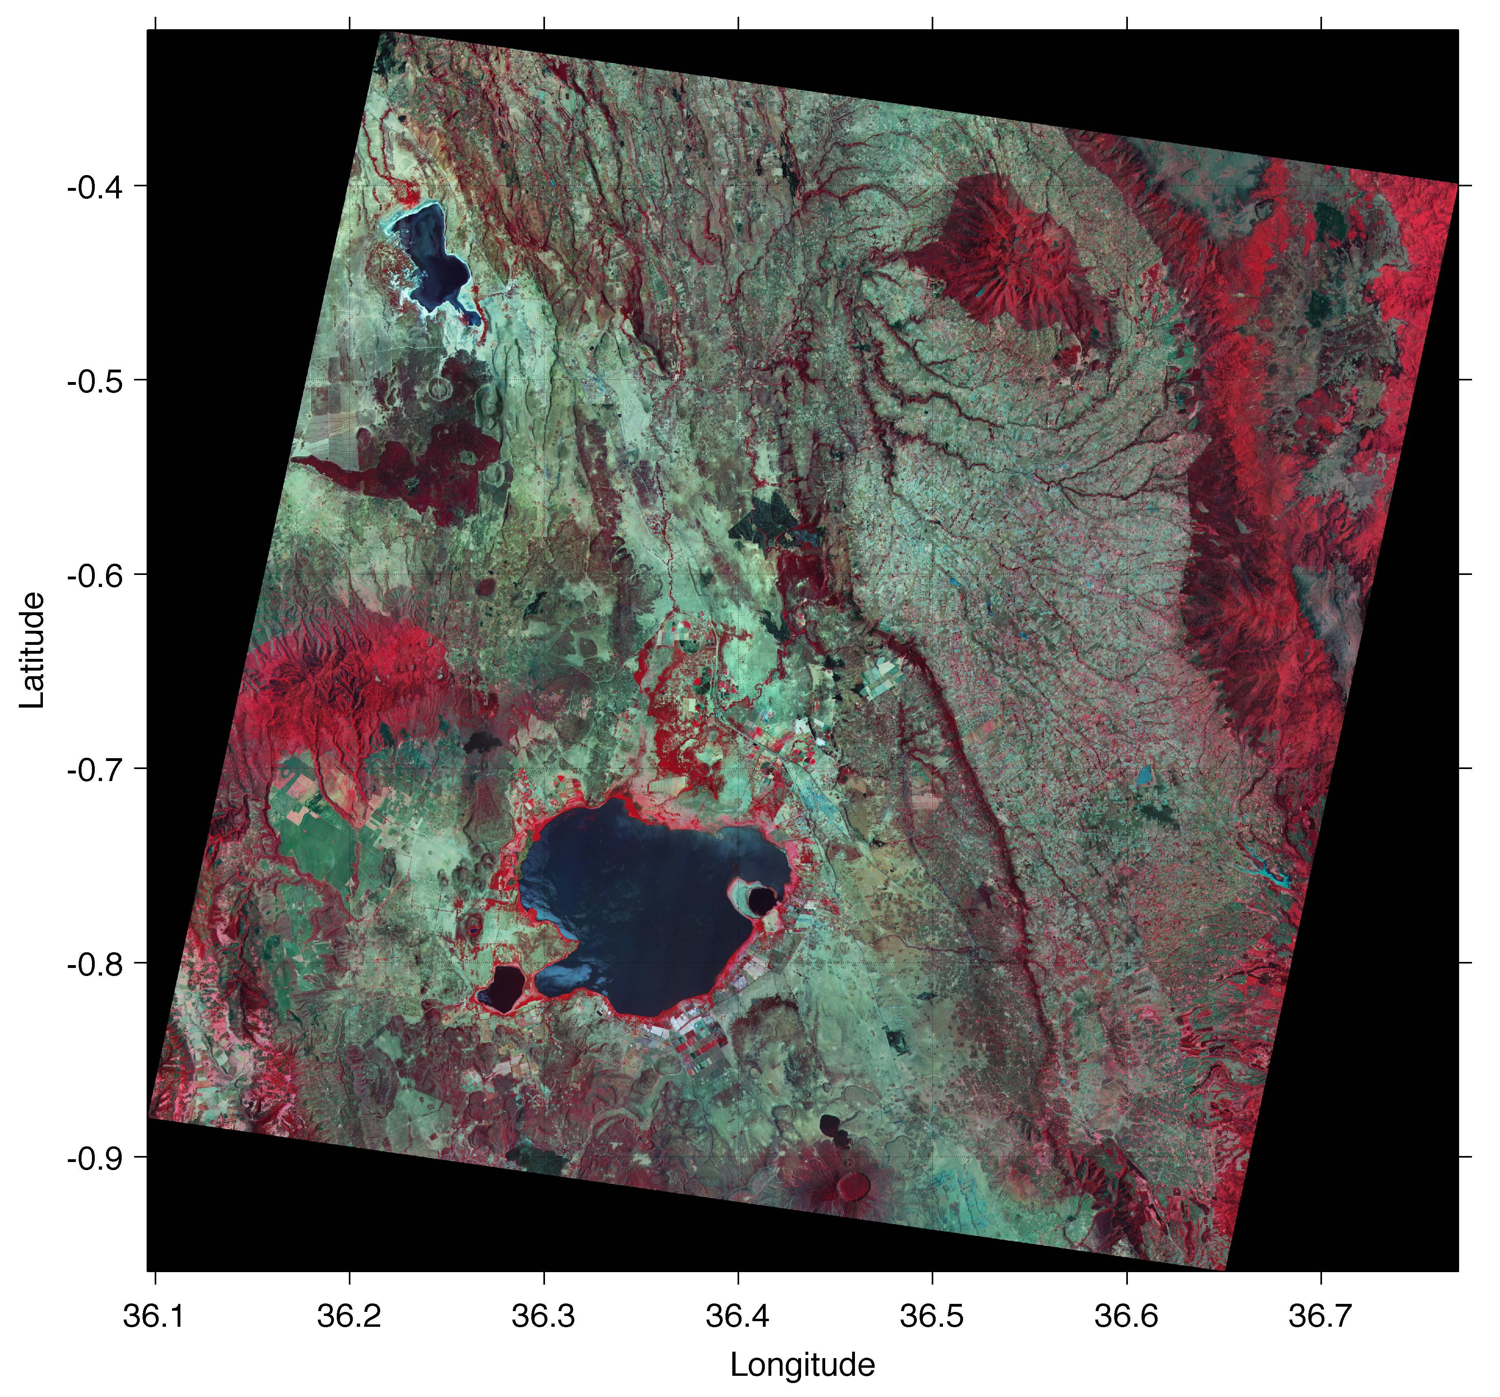
to dive into the hierarchical structure of the file to find out the names of the data fields that we want to import. We then use the command hdfread to access the image data. The vnir_Band3n, vnir_Band2, and vnir_Band1 typically contain much information about lithology (including soils), vegetation, and surface water on the Earth’s surface. These bands are therefore usually combined into 24-bit RGB images. We first read the data
I1 = hdfread(filename,'VNIR_Band3N',...
   'Fields','ImageData');
I2 = hdfread(filename,'VNIR_Band2',...
   'Fields','ImageData');
I3 = hdfread(filename,'VNIR_Band1',...
   'Fields','ImageData');
These commands generate three 8-bit image arrays, each representing the intensity within a certain infrared (IR) frequency band of a 4200-by-4100 pixel image. Then we concatenate the result to a 24-bit RGB image using cat.
naivasha_rgb = cat(3,I1,I2,I3);
The 4200-by-4100-by-3 array can now be displayed using
imshow(naivasha_rgb)