Unfortunately, the graphical output of the function spectrogram has changed in a way that it can no longer be used by geoscientists. Here is a way around the problem.
The amplitude of spectral peaks usually varies with time. This is particularly true for paleoclimate time series. Paleoclimate records usually show trends, not only in the mean and variance but also in the relative contributions of rhythmic components such as the Milankovitch cycles in marine oxygen-isotope records. Evolutionary power spectra have the ability to map such changes in the frequency domain.
The evolutionary or windowed power spectrum is a modification of the method introduced in Section 5.3 of the MRES book, which computes the spectrum of overlapping segments of the time series. These overlapping segments are relatively short compared to the windowed segments used by the Welch method (Section 5.3), which is used to increase the signal-to-noise ratio of power spectra. The evolutionary power spectrum method therefore uses the Short-Time Fourier Transform (STFT) instead of the Fast Fourier Transformation (FFT). The output from the evolutionary power spectrum is the short-term, time-localized frequency content of the signal. There are various methods that can be used to display the results. For instance, time and frequency can be plotted on the x– and y-axes, respectively, or vice versa, with the color of the plot being dependent on the height of the spectral peaks.
As an example we use a data set that is similar to those used in Section 5.5. The data series contains three main periodicities of 100, 40 and 20 kyrs and additive Gaussian noise. The amplitudes, however, change through time and this example can therefore be used to illustrate the advantage of the evolutionary power spectrum method. In our example the 40 kyr cycle appears only after ca. 450 kyrs, whereas the 100 and 20 kyr cycles are present throughout the time series. We first load from the file series3.txt and display the data.
clear, close all, clc
series3 = load('series3.txt');
plot(series3(:,1),series3(:,2))
xlabel('Time (kyr)')
ylabel('d18O (permille)')
title('Signal with Varying Cyclicities')
Since both the standard and the evolutionary power spectrum methods require evenly-spaced data, we interpolate the data to an evenly-spaced time vector t, as demonstrated in Section 5.5.
t = 0 : 3 : 1000;
series3L = interp1(series3(:,1),series3(:,2),t,'linear');
We now use the function spectrogram to map the changes in the power spectrum with time. By default, the time series is divided into eight segments with a 50% overlap. Each segment is windowed with a Hamming window to suppress spectral leakage (Section 5.3). The function spectrogram uses similar input parameters to those used in periodogram in Section 5.3. We then compute the evolutionary power spectrum for a window of 64 data points with a 50 data point overlap. The STFT is computed for nfft=256. Since the spacing of the interpolated time vector is 3 kyrs, the sampling frequency is 1/3 kyr–1.
spectrogram(series3L,64,50,256,1/3);
title('Evolutionary Power Spectrum')
xlabel('Frequency (1/kyr)')
ylabel('Time (kyr)')
The old version of the plot looks like this, as presented in the 4th edition of the MRES book:
Unfortunately, the display of the spectrogram has now changed and we no longer get the display as shown above with MATLAB R2019b:
The display of the spectrogram now seems to scale the x and y axes as well as the color scale. The indicated numbers on the x- and y-axis together with the units kyr and 1/kyr make no sense. In other words, the figure is simply wrong! If we avoid the x- and y-labels, we see what the problem is:
spectrogram(series3L,64,50,256,1/3);
title('Evolutionary Power Spectrum')
The function assumes that the time values are in seconds and the frequency values are in Hz. The values of the frequency axis are then scaled by factors of ten, assuming that values are in Hz and display the values in mHz. The values of the time axis are converted to minutes or hours, by dividing the seconds by 60 or 3600, which is even worse because of the hexa system. The spectral density values are displayed on a log scale (dB).
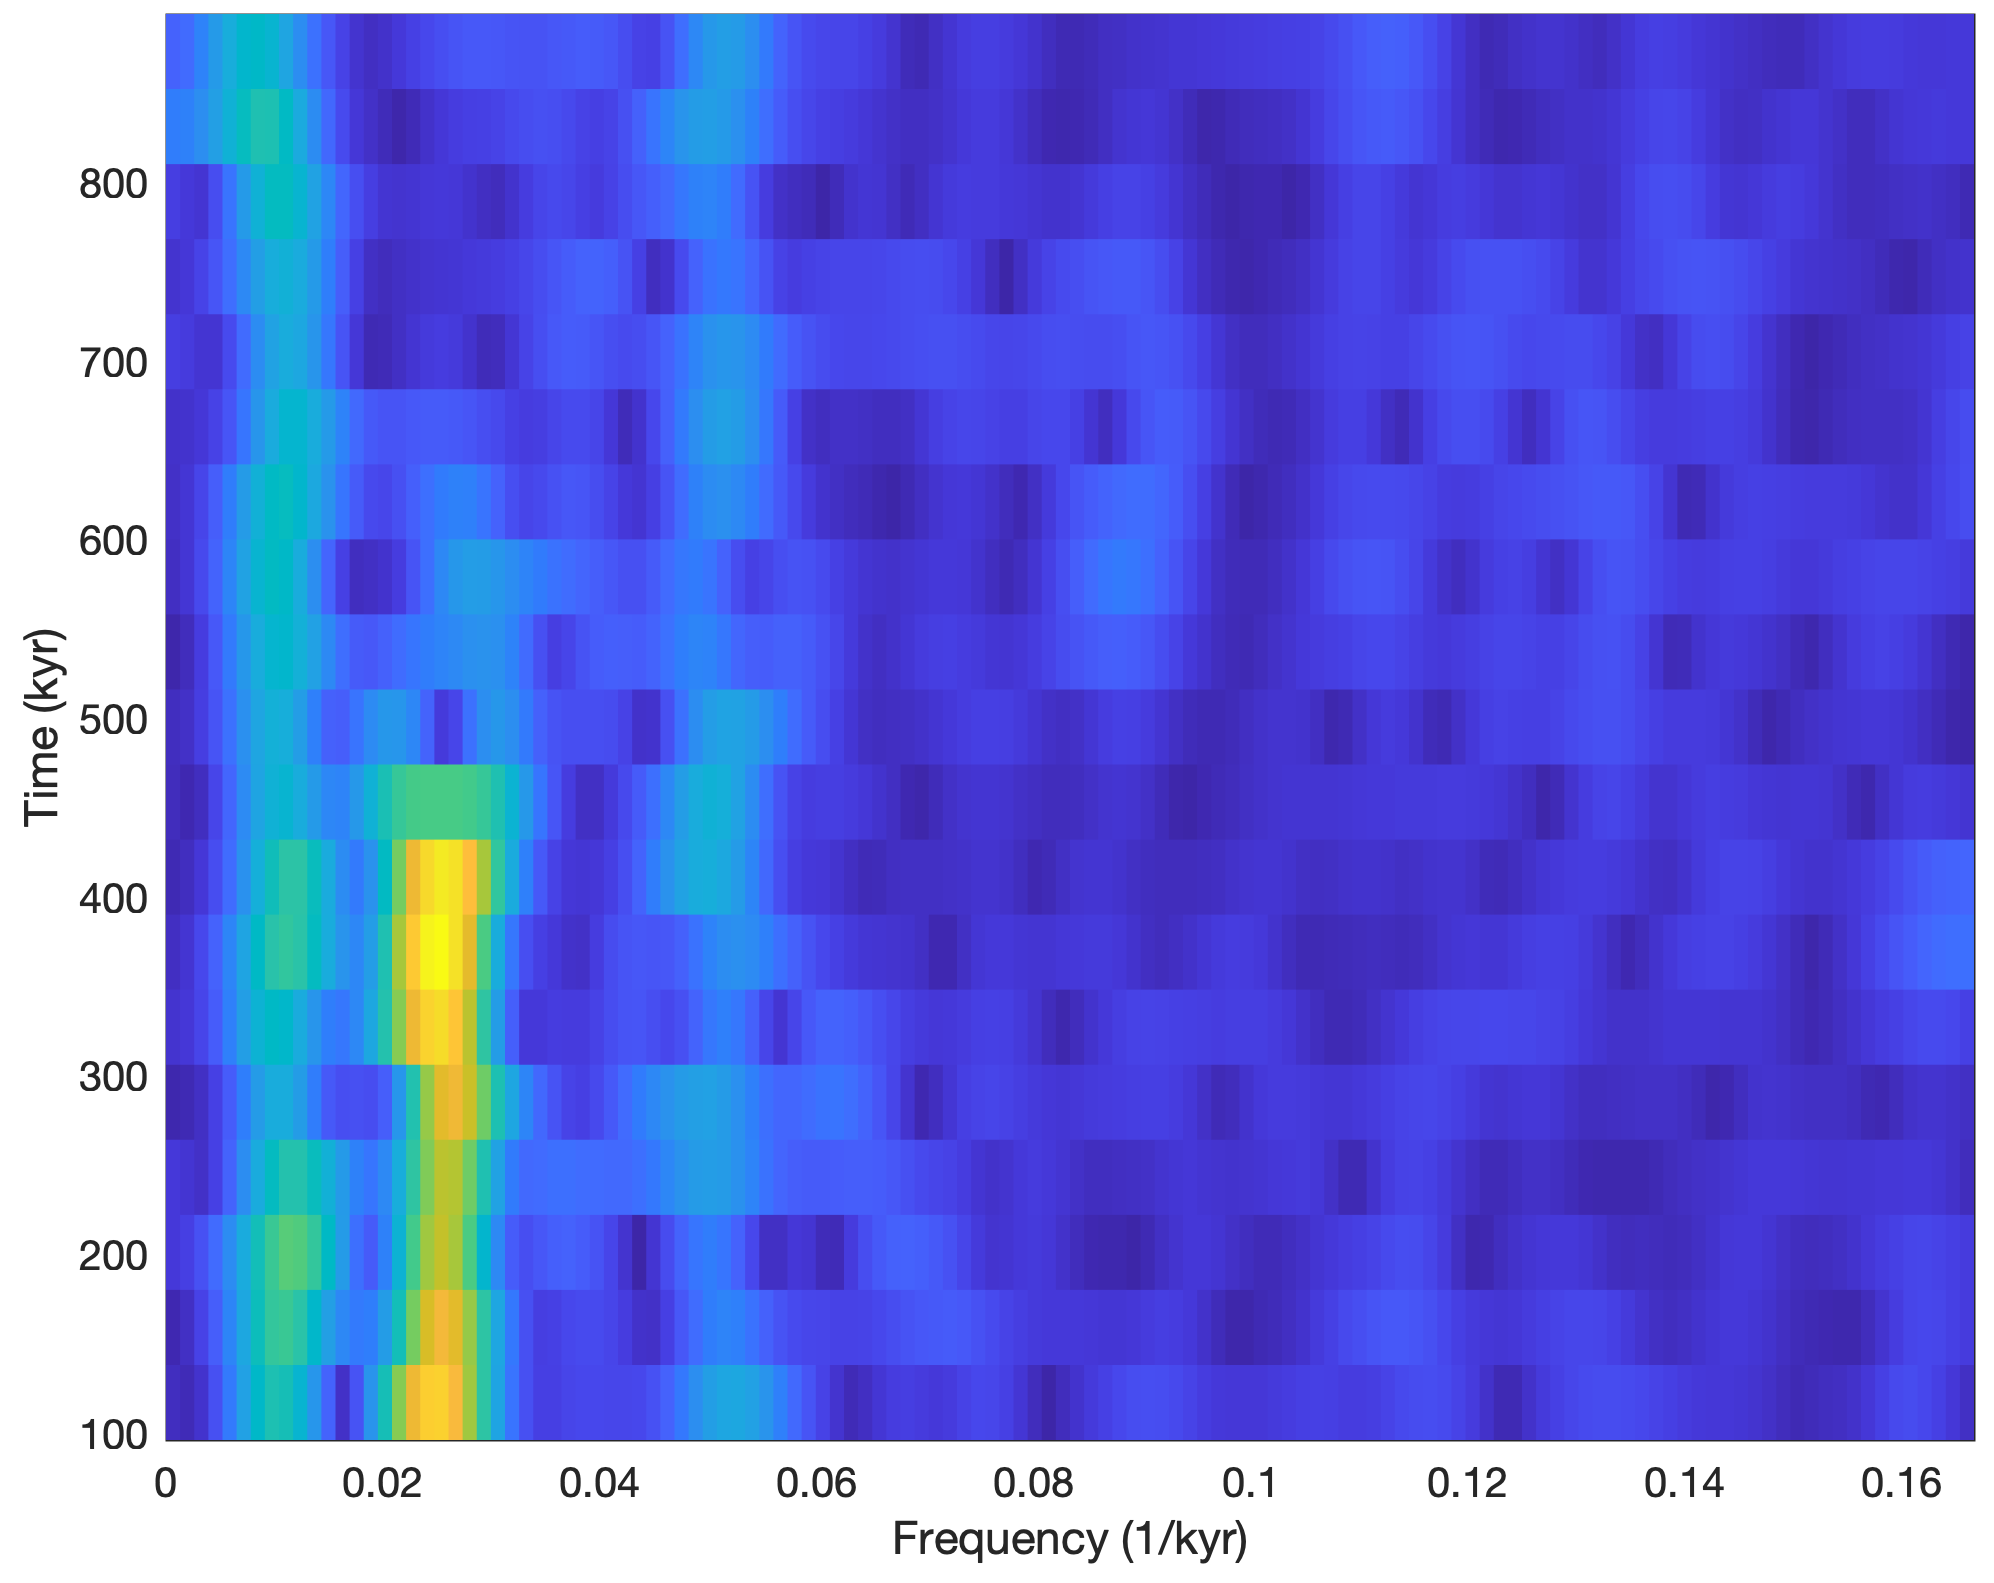
However we can display the spectrogram in the previous way by avoiding the graphical output of the function. Instead we use the output [s,f,t] of the function and use pcolor instead to display the data:
[s,f,t] = spectrogram(series3L,64,50,256,1/3);
pcolor(f,t,(abs(s))'), shading flat
title('Evolutionary Power Spectrum')
xlabel('Frequency (1/kyr)')
ylabel('Time (kyr)')
Using pcolor displays the output of spectrogram in a color plot that displays yellow vertical stripes representing significant maxima at frequencies of 0.01 and 0.05 kyr–1 (i.e. every 100 and 20 kyrs). There is also a 40 kyr cycle (corresponding to a frequency of 0.025 kyr–1), but this only occurs after ca. 450 kyrs, as documented by the vertical red stripe in the lower half of the graph.


