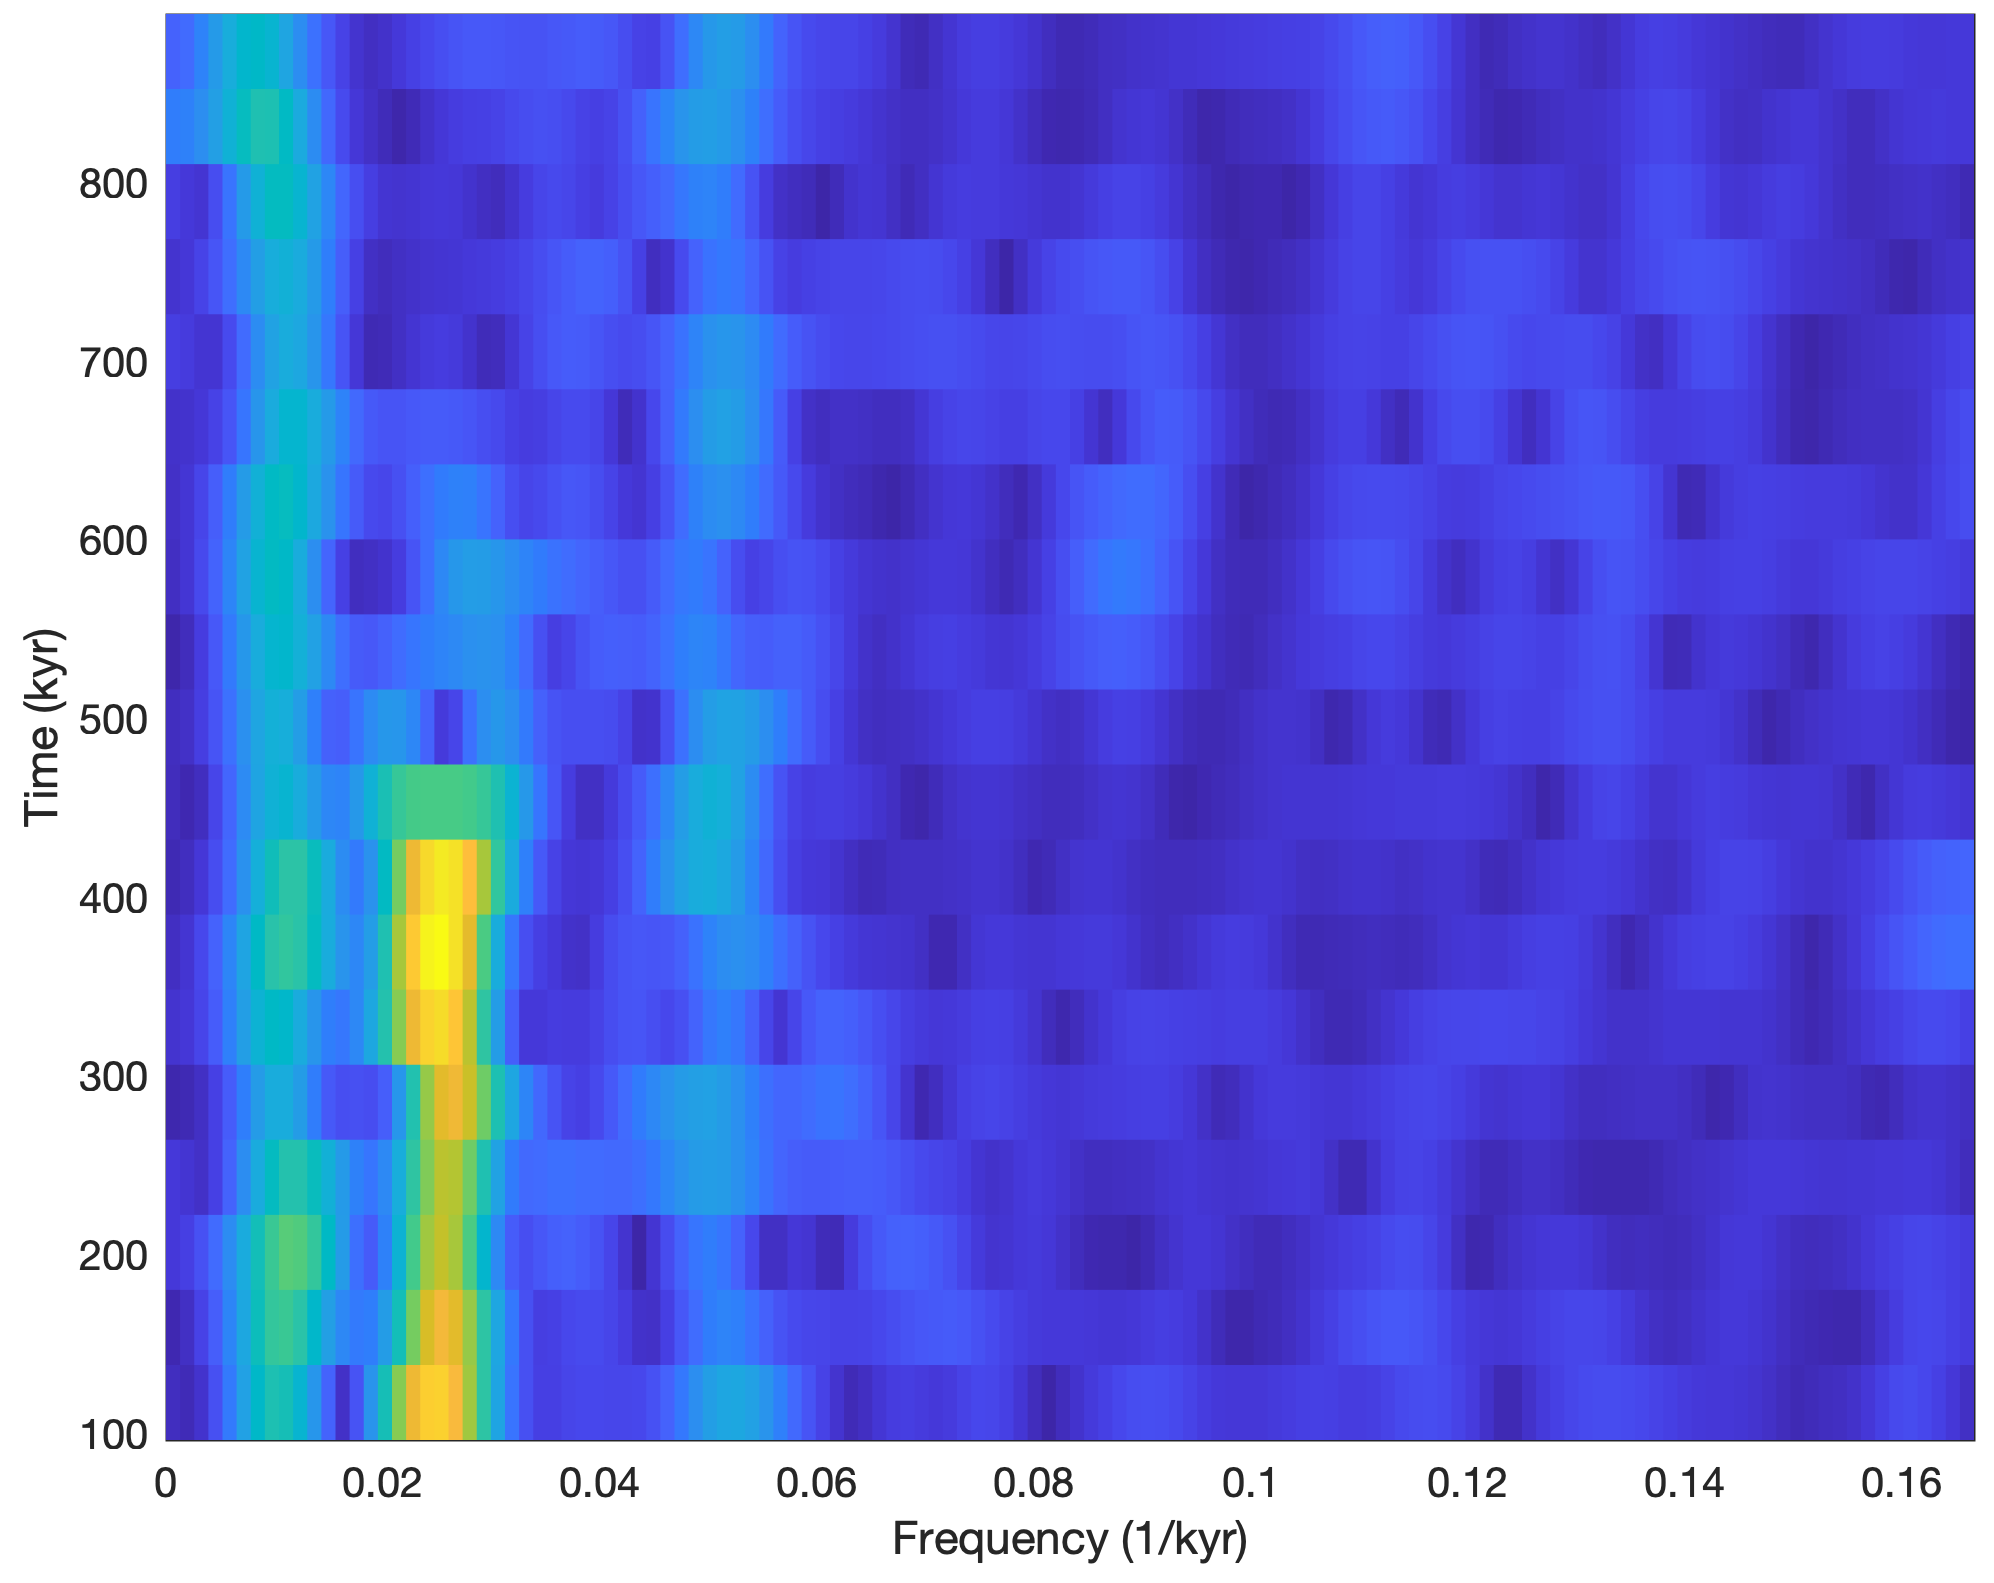
Unfortunately, the graphical output of the function spectrogram has changed in a way that it can no longer be used by geoscientists. Here is a way around the problem. Continue reading “Change of Behaviour: spectrogram”

MATLAB and Python Recipes for Earth Sciences
Martin H. Trauth, University of Potsdam, Germany
Unfortunately, the graphical output of the function spectrogram has changed in a way that it can no longer be used by geoscientists. Here is a way around the problem. Continue reading “Change of Behaviour: spectrogram”
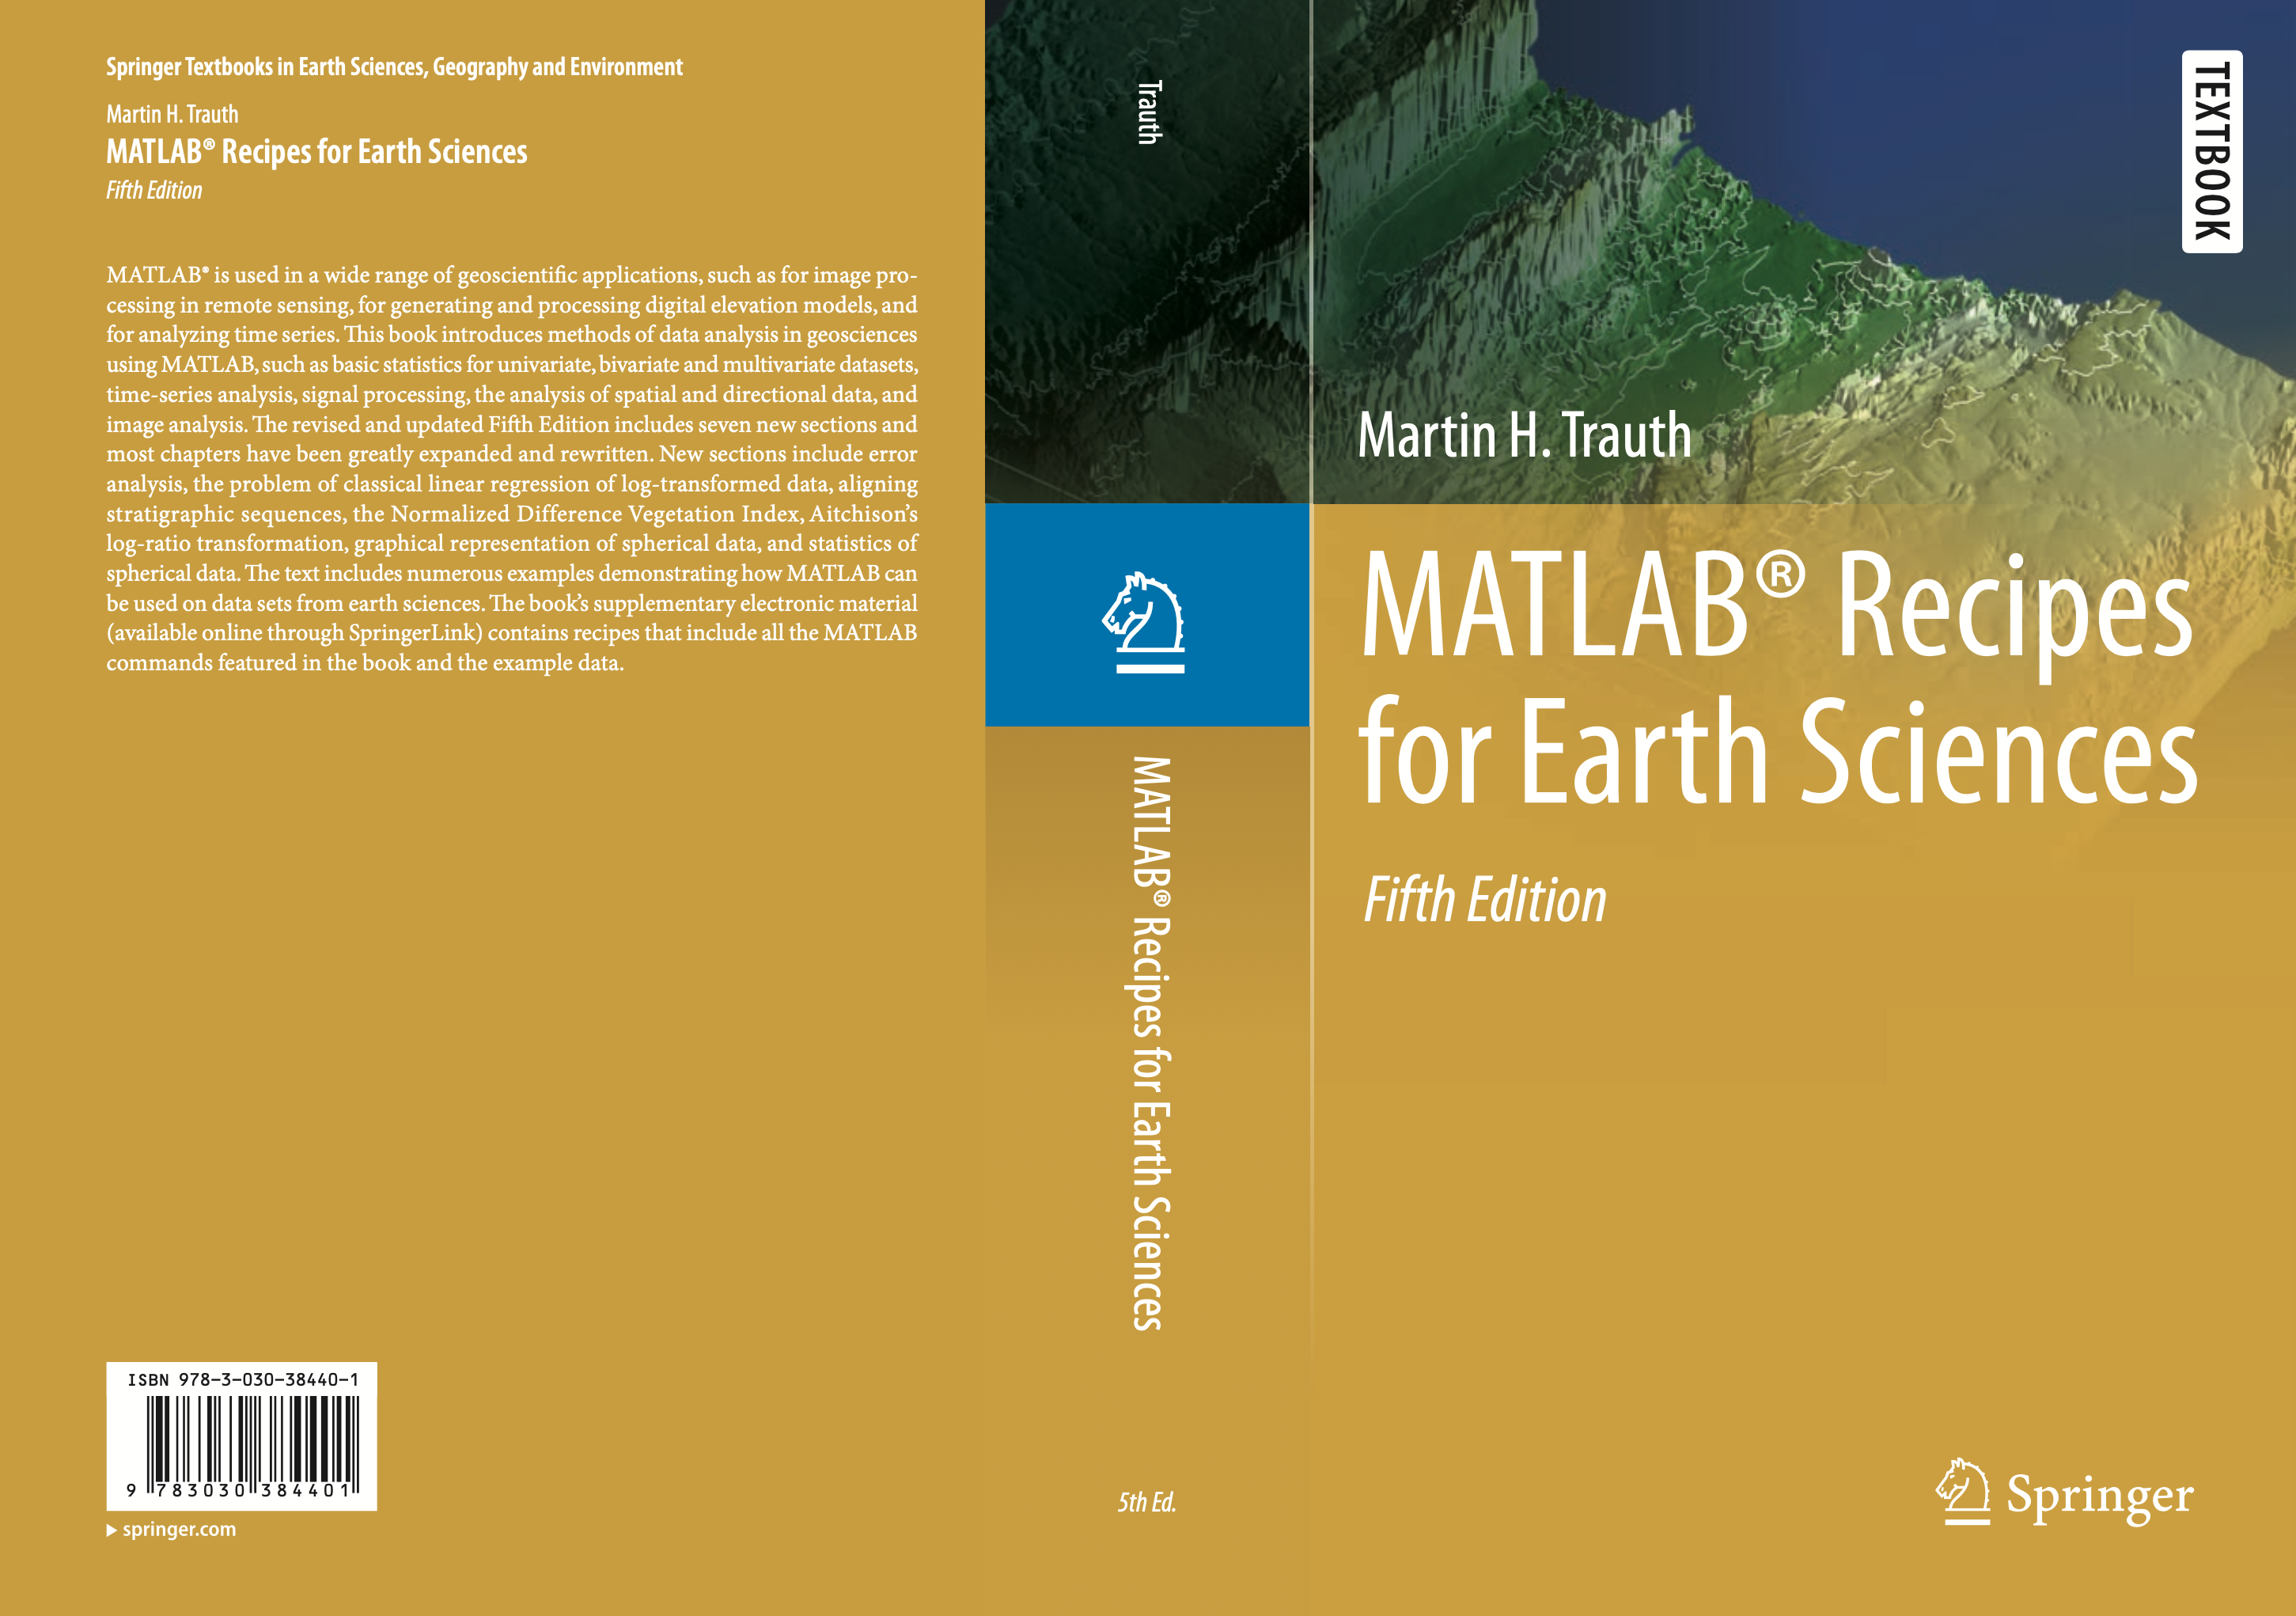
The 5th edition of MATLAB Recipes for Earth Sciences now has a book cover and can already be pre-ordered on the publisher’s webpage. The picture on the top is a 3D display of a filtered SRTM elevation data set of the Baringo area in Kenya, showing fault escarpments and lake basins. The function surfl has been used to generate a shaded-relief map with simulated lighting, contour3 to create white elevation contours and the demcmap colormap from the Mapping Toolbox.