The spring courses on MATLAB Recipes for Earth Sciences in Potsdam will be held on 17–21 Februar 2020 (in English language) and 30 March–3 April 2020 (in German language).
The courses have been held in their current form since 2002, but I have been teaching MATLAB-based courses on geoscientific data analysis since 1994. I have been using MATLAB since late 1992 and are currently writing my third MATLAB-based textbook.
Although we use MATLAB as a tool, the courses are not MATLAB courses, but data analysis courses with MATLAB. In fact, users of Python, R and other higher programming languages also attend my courses. In our masters courses here at U Potsdam, we mostly use MATLAB, but also Python and a little bit of R. Students should not only get to know a single tool, but as many as possible that complement each other. The courses, as well as the books, are therefore largely independent of MATLAB. This is because I mostly use simple computer code to explain a method of data analysis, for example in Chapter 5 of the book. We use
t = 1 : 1000;
x = 2*sin(2*pi*t/50);
to create a synthetic time series and
Xxx = fft(x,1024);
Pxx2 = abs(Xxx).^2/1000;
Pxx = [Pxx2(1); 2*Pxx2(2:512)];
f = 0 : 1/(1024-1) : 1/2;
plot(f,Pxx), grid
to calculate and display a periodogram. Since there is professional support for MATLAB, I had this code tested by a MathWorks engineer. This computer code can very easily be translated into another language such as Python or R, as it only requires a routine for the Fast Fourier Transform (FFT), which is identical in all languages. We then use a MATLAB-specific function to calculate a periodogram:
[Pxx,f] = periodogram(x,[],1024,1);
plot(f,Pxx), grid
You get exactly the same result if you use this function. You can also check this on the code of periodogram, because it is open source, with
edit periogram
On the first day we will indeed start with MATLAB because we use it as a tool during the week. But even here, it’s very basic things how higher level programming languages work, not just MATLAB.
On the second day there will be an introduction to the basics of uni- and bivariate statistics. We start with very simple things like histograms, descriptive statistics and end with hypothesis testing and distribution fitting. In the afternoon we look at different correlation coefficients and regression methods to end with a weighted, nonlinear regression. So it is always a very steep learning curve along which we will walk, but most of the participants in my courses have some experience in dealing with data.
The third day we dive deep into the frequency domain, get to know methods of time series analysis and signal processing. This is usually a challenge for many of the participants, but we always wait a bit until everyone follows. Spectral analysis is widely used in many applications such as climate research and seismology. Filters are also used in digital image processing, but also for smoothing digital terrain models.
The courses introduce methods of data analysis in earth and environmental sciences using MATLAB, one of the leading software packages for the solution of mathematical problems. The content of the course includes basic statistics for univariate, bivariate and multivariate datasets, time-series analysis and signal processing, processing and displaying digital elevation models, gridding and contouring, and image processing and analysis.
Already on the fourth day it becomes a bit easier if we deal with multivariate statistics. Here we will look at the principal component analysis as an example – the blog post “Principal Component Analysis in 6 Steps” has already been visited more than 20,000 times! In the afternoon we will deal with digital terrain models, gridding and contouring methods. Then it will be very colorful, we will even create animated 3D models, which can be inserted into PDF documents!
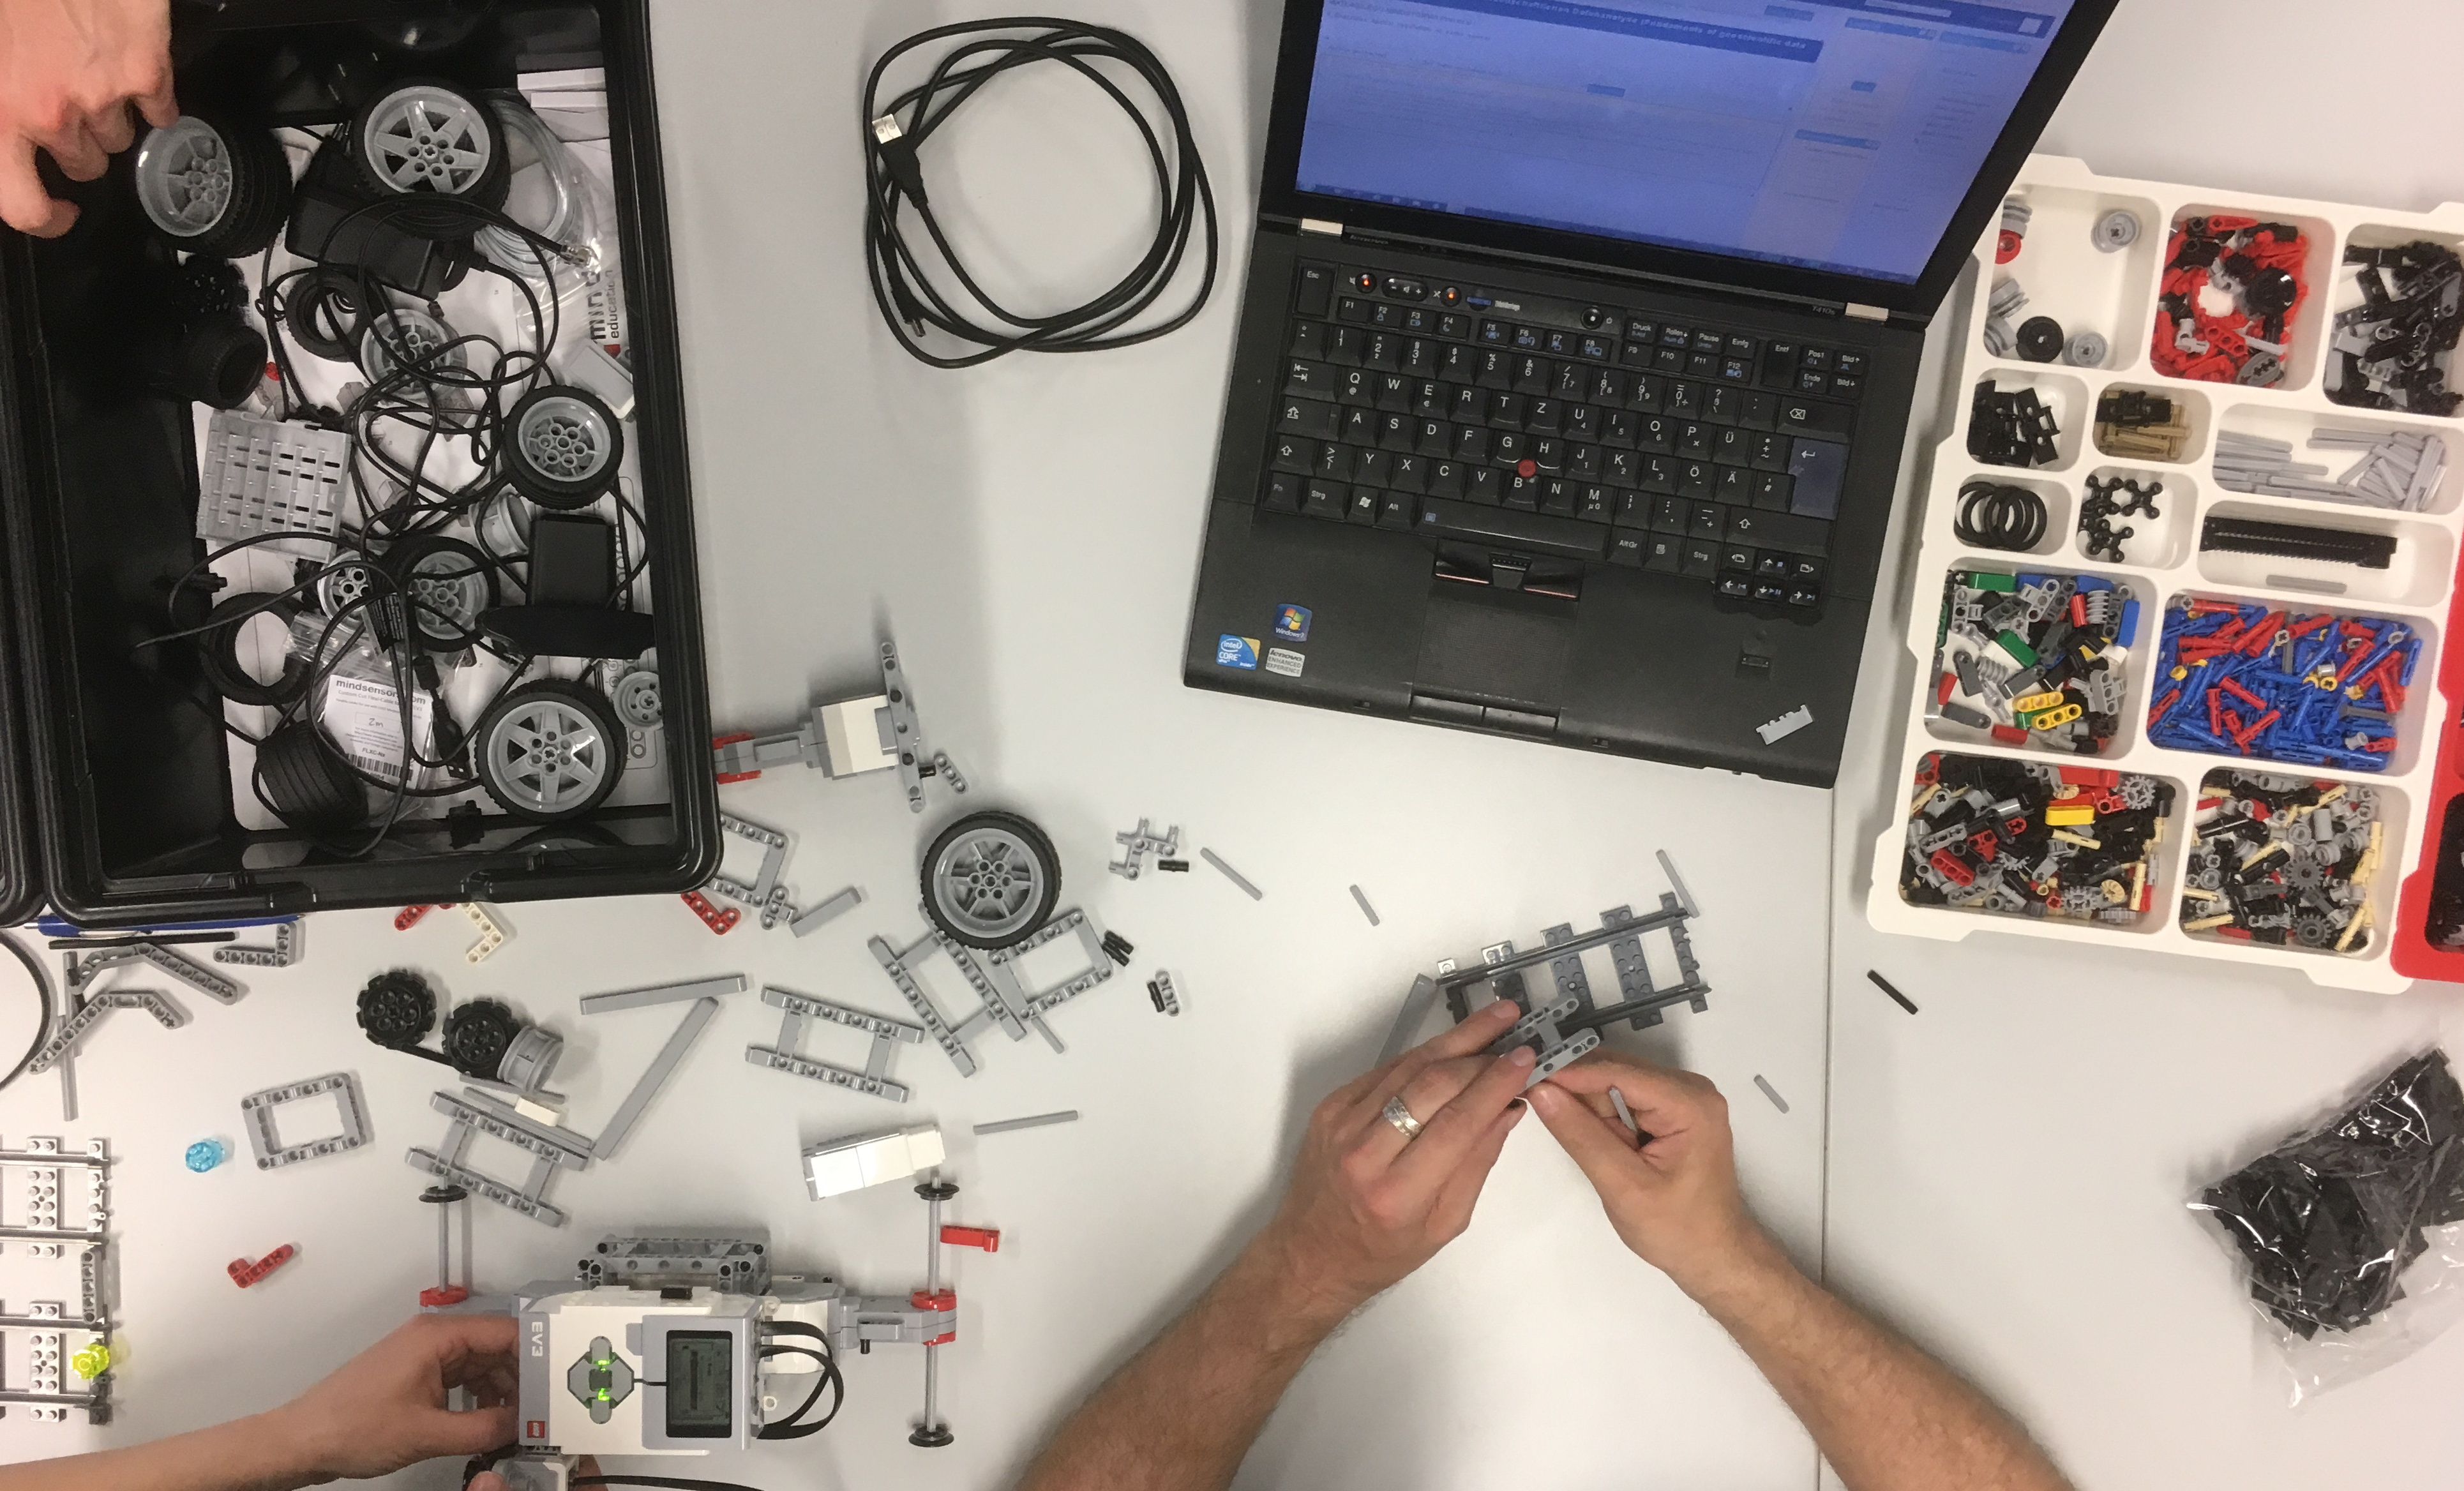
On Friday morning, the focus will be on image processing and analysis, for example using satellite images. We will also look at methods of detecting objects using color or shape in microscopic images. So we do a little Photoshop with MATLAB! If you’re still there on Friday afternoon, you can finally play with LEGO! We will try to program a LEGO car with MATLAB and use one of the LEGO sensors with MATLAB to control the car.
Please send me a mail (trauth@uni-potsdam.de) if you have any questions or suggestions regarding the courses! The course was taught at the U Aberystwyth, U Addis Ababa, U Bremen, U Bratislava, U Ghent, UA Barcelona, BGR Hannover, U Kiel, UC London, LMU München, BGI Bayreuth, U Nairobi, U Köln, U Stockholm, U Amsterdam, NHM Vienna, GNS Science Wellington, Brown U Providence, U Arizona Tucson and U Potsdam.
Course Fees: students including doctoral students 300 €, university Employees 400 €, others 500 €. For more information about the courses and registration formalities, please refer to the flyers of the English course (17–21 Februar 2020) and German course (30 March–3 April 2020). The course fee includes a printed copy of the 5th edition of the MATLAB Recipes for Earth Sciences Book that is currently in press at SpringerNature.