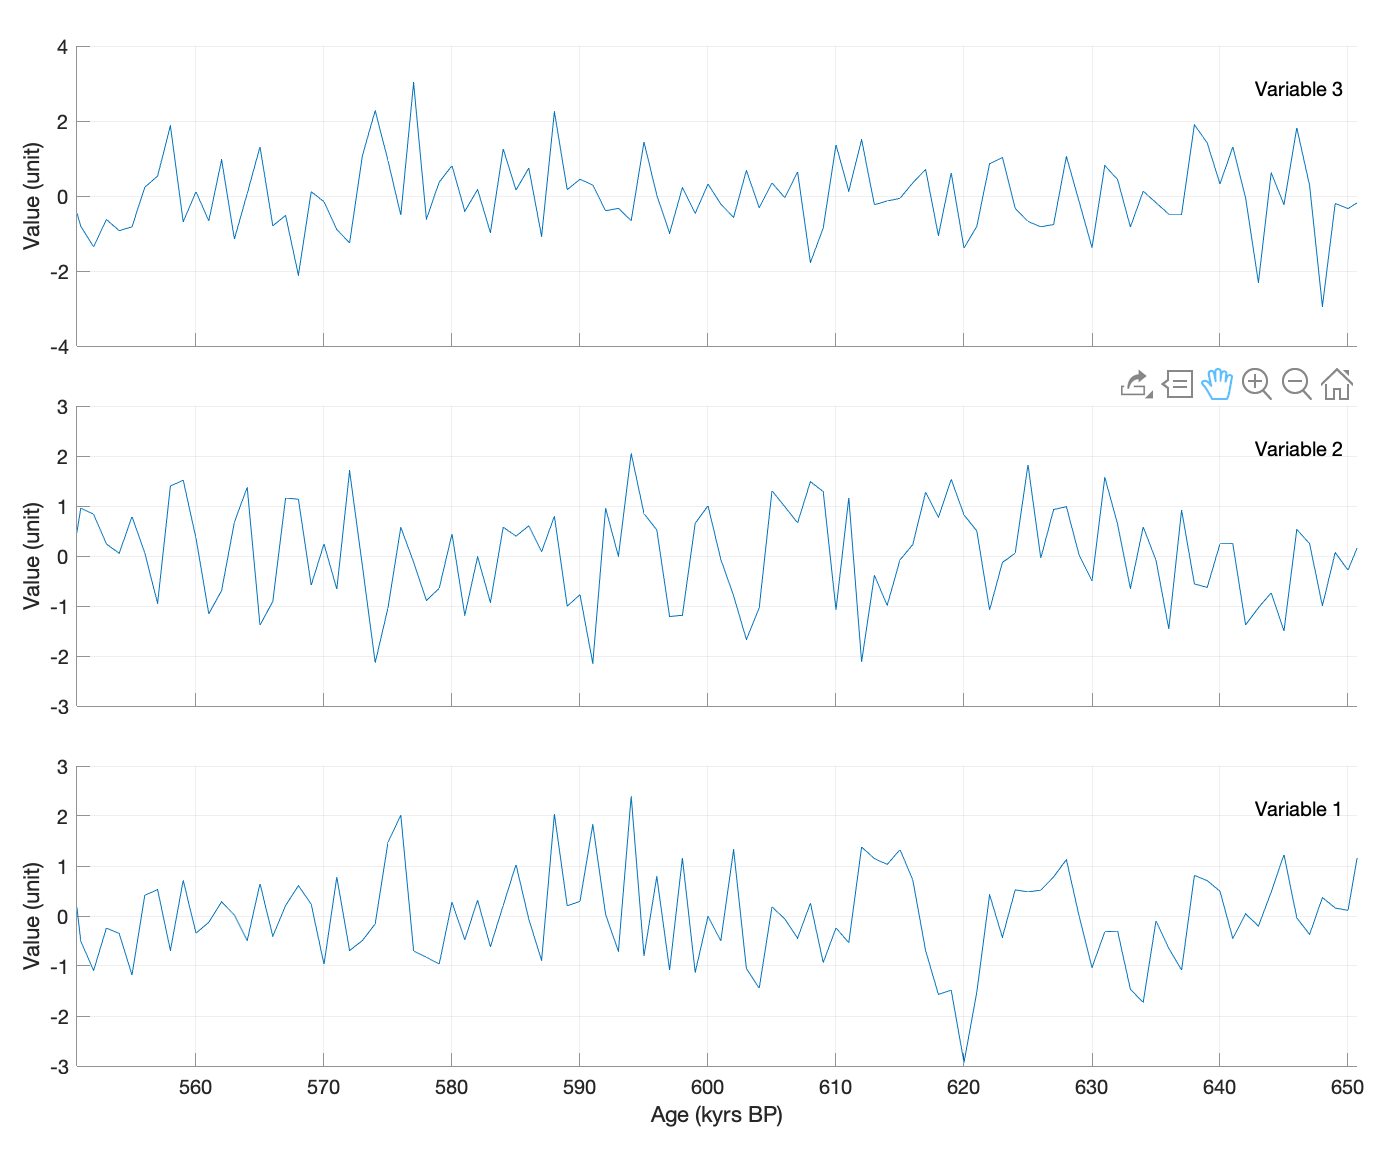
When paleoclimatologists work with multiproxy data, they often have to display many variables in multiple axes, and then to zoom and browse through individual sections of the data series. Here is a MATLAB script that demonstrates how to link axes for zooming and paning. Continue reading “Synchronizing Axes of Multiproxy Data”
Creating Better Scientific Posters, Part 1
Industrial-organizational psychologist Mike Morrison is currently attracting a lot of attention on Twitter (#betterposters) and on YouTube where he suggests to create better science posters. He also provides templates for posters OSF. He basically complains about wall-of-text posters that he finds at conferences and suggests to use most of the poster area to include a colored rectangle with a central statement or conclusion. Here are my thoughts on the better poster movement. Continue reading “Creating Better Scientific Posters, Part 1”