
During my 30 years of teaching data analysis courses in earth sciences, I became increasingly aware that teaching troubleshooting is much more important than the actual application of data analysis methods.
When you are at the beginning of your career as a university teacher, you are very busy designing and teaching a course. It is always very stressful when something goes wrong, for example, while live coding of MATLAB scripts during lessons. You get nervous, start sweating and hope to find the mistake quickly and continue with the lessons. Students find this moment particularly exciting and interesting, firstly because they want to see how the teacher saves him/herself from the situation. And secondly, because they all find themselves quite often in the same situation and want to learn from the teacher who to solve the problem.
Here are two examples of problems that can occur during live coding in MATLAB and how to solve them. The first example can be found in Chapter 5 of the MRES book. We load an unevenly-spaced time series from the file series1.txt, create an evenly-spaced t-axis with a similar range and average spacing of the original data series and interpolate the data by linear interpolation.
clear
series1 = load('series1.txt');

t = 0 : 3 : 1000;
series1L = interp1(series1(:,1),series1(:,2),...
   t,'linear');
series1L = series1L';
We then calculate the periodogram of the time series series1L and display the result.
Fs = 1/3;
nfft = 2^nextpow2(length(t));
Xxx = fft(series1L,nfft);
Pxx2 = abs(Xxx).^2 /Fs /length(series1L);
Pxx = [Pxx2(1); 2*Pxx2(2:nfft/2)];
f = 0 : Fs/(nfft-1) : Fs/2;
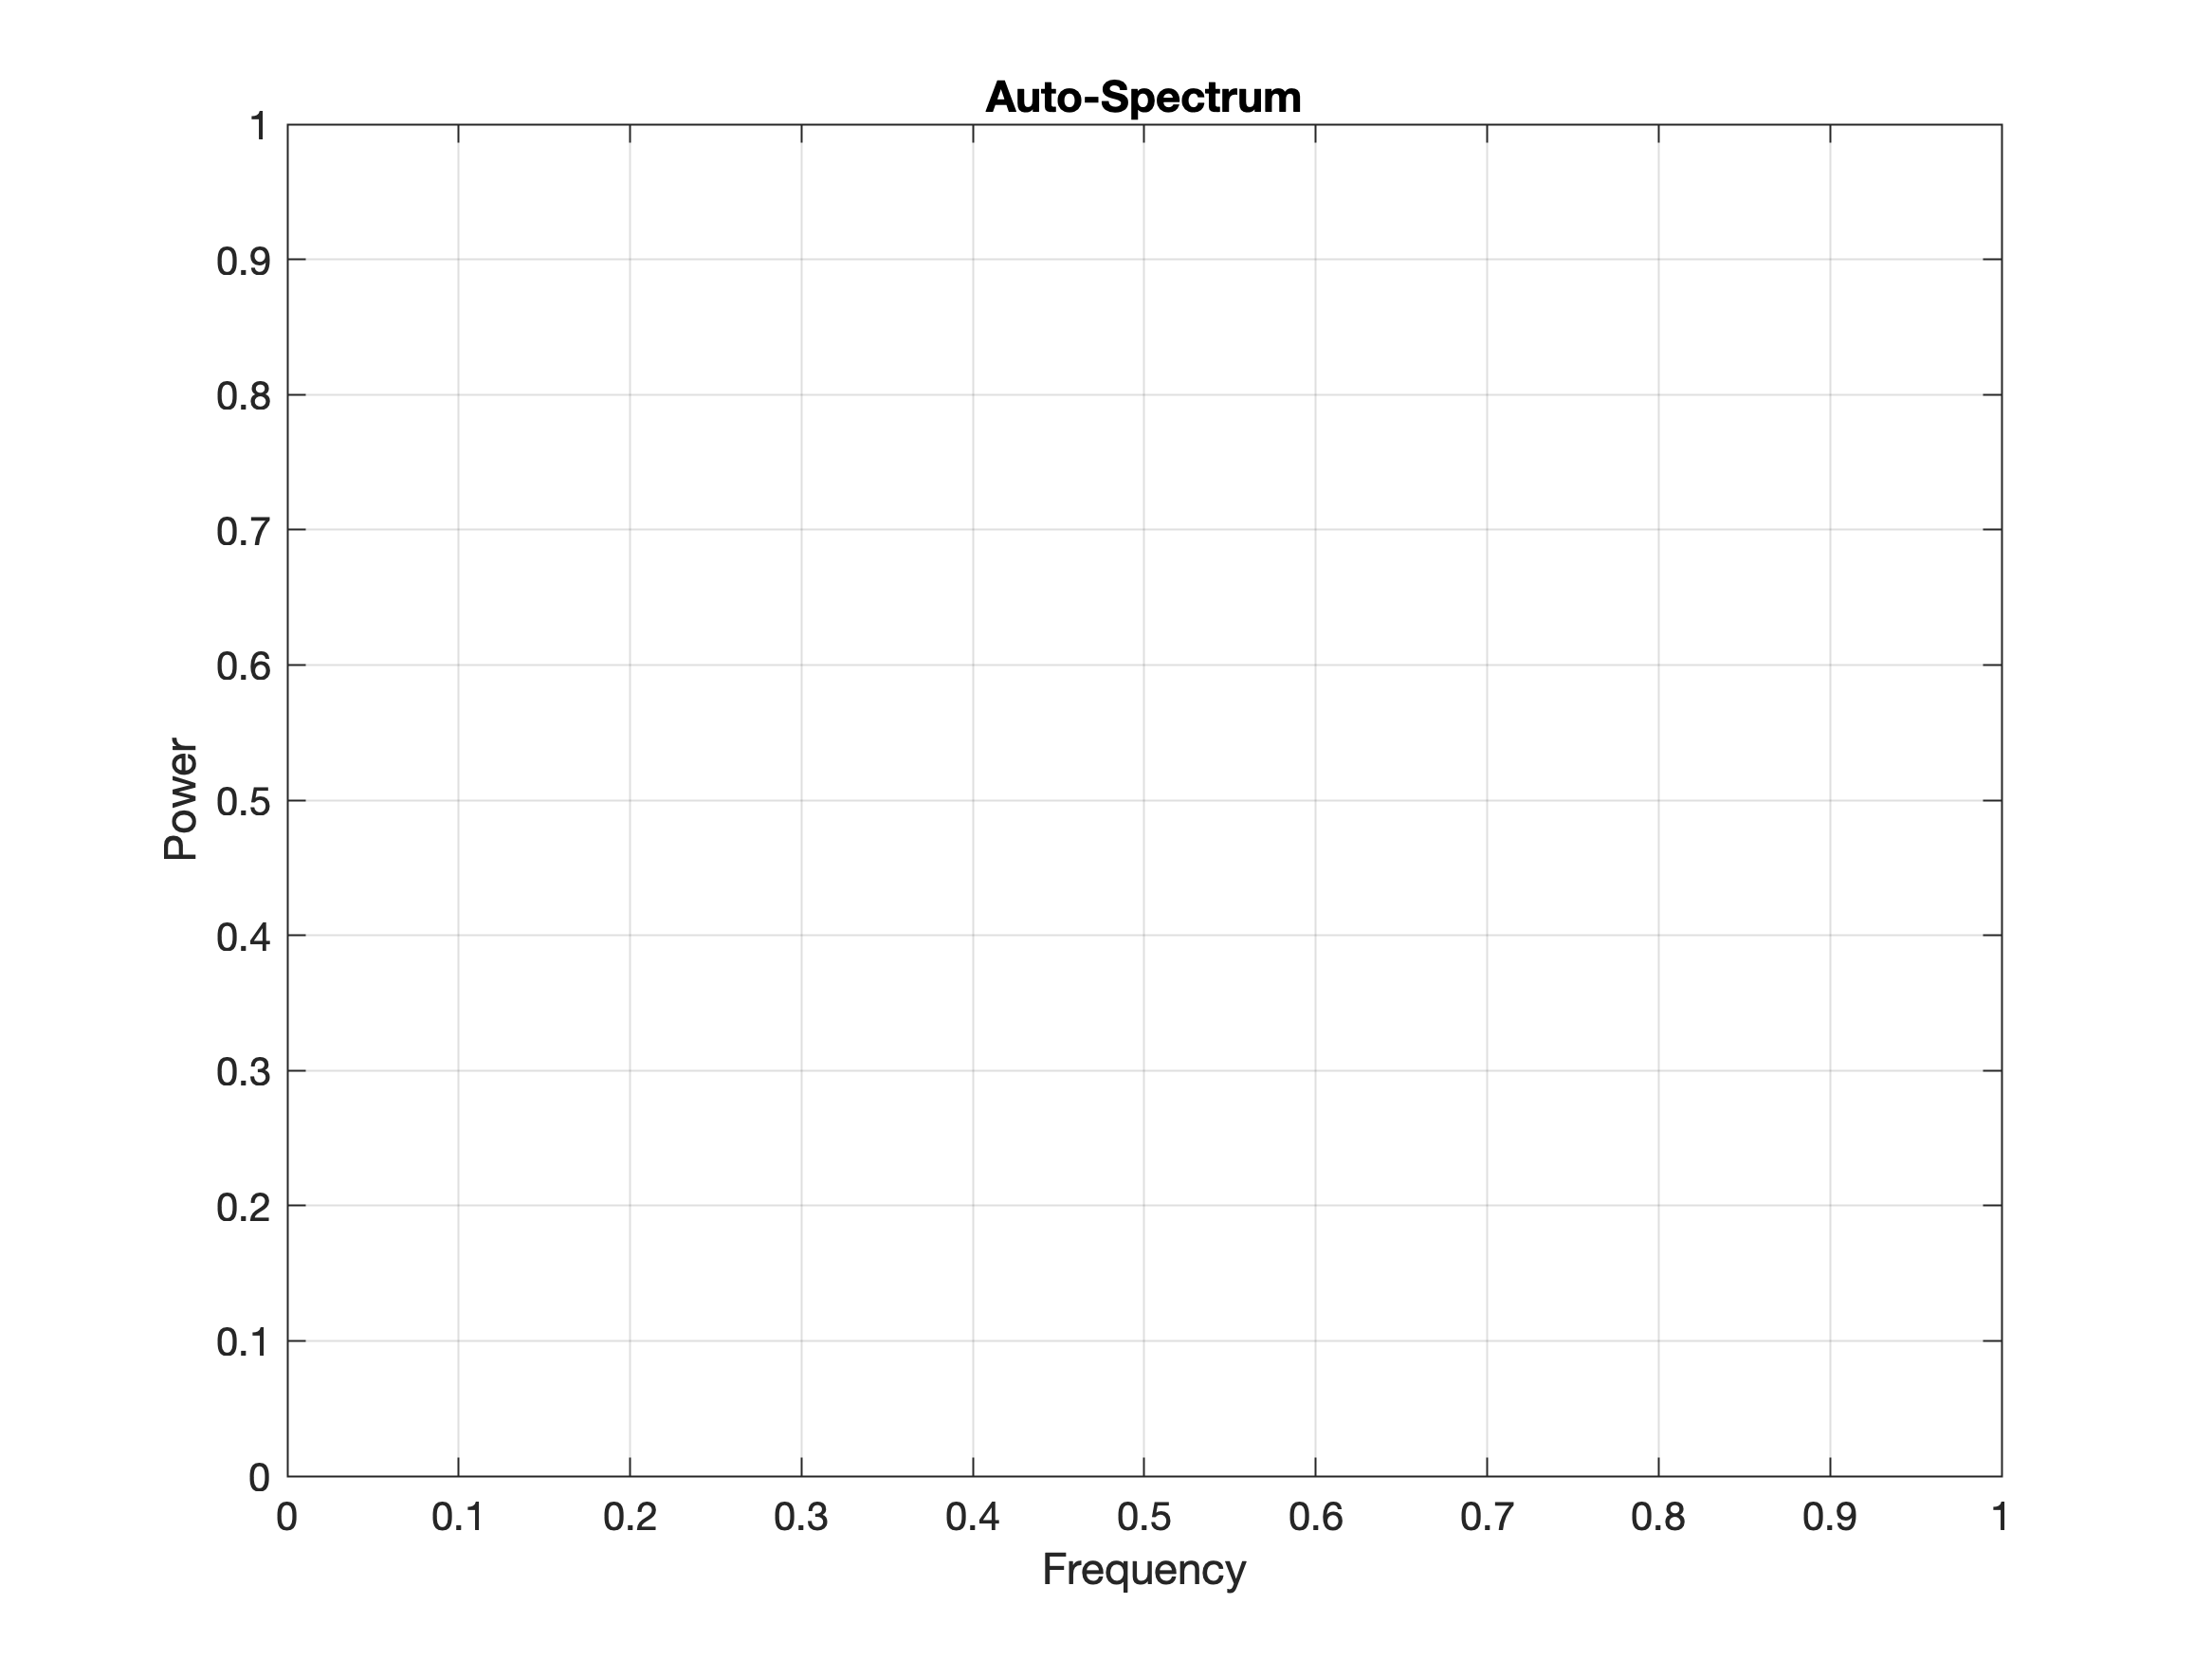
plot(f,Pxx), grid
xlabel('Frequency')
ylabel('Power')
title('Auto-Spectrum')
The graphic is empty, i.e. no power spectrum can be seen. It’s a surprise for a beginner. There is no noticeable bug in the MATLAB code. So how do you track down the error in this example? We can use a variation of Toyota’s 5 Whys technique to gradually get to the heart of the problem. If a graph does not show the expected result, in our example no result at all, then you first have to look at the numbers that are to be displayed by typing
Pxx
which yields
Pxx =
   NaN
   NaN
   NaN
   NaN
   NaN
   NaN
   NaN
   cont'd
So it is really no surprise at all that nothing is to be seen, because NaNs are not displayed by definition. In fact, they are even used to create gaps in line plots, as can be seen in the coastal line (GSHHS) dataset example. We have to keep searching for the error, looking at what Pxx is calculated from, namely series1L, by typing
series1L
which yields
series1L =
    0.0195
    1.3685
    3.3465
    2.1005
    1.8805
    ...
    -1.6128
    -2.5171
    -1.1585
    NaN
As you can see, the very last value of series1L is an NaN. Any calculation including NaNs, however, results in NaNs. But where does this one single NaN come from? It is the result of linear interpolation, which does not extrapolate. We forced the interpolation to calculate values for t=0:3:1000 but the original time axis in series1.txt ranges from
min(series1(:,1))
max(series1(:,1))
which yields
ans =
    0
ans =
    997.4654
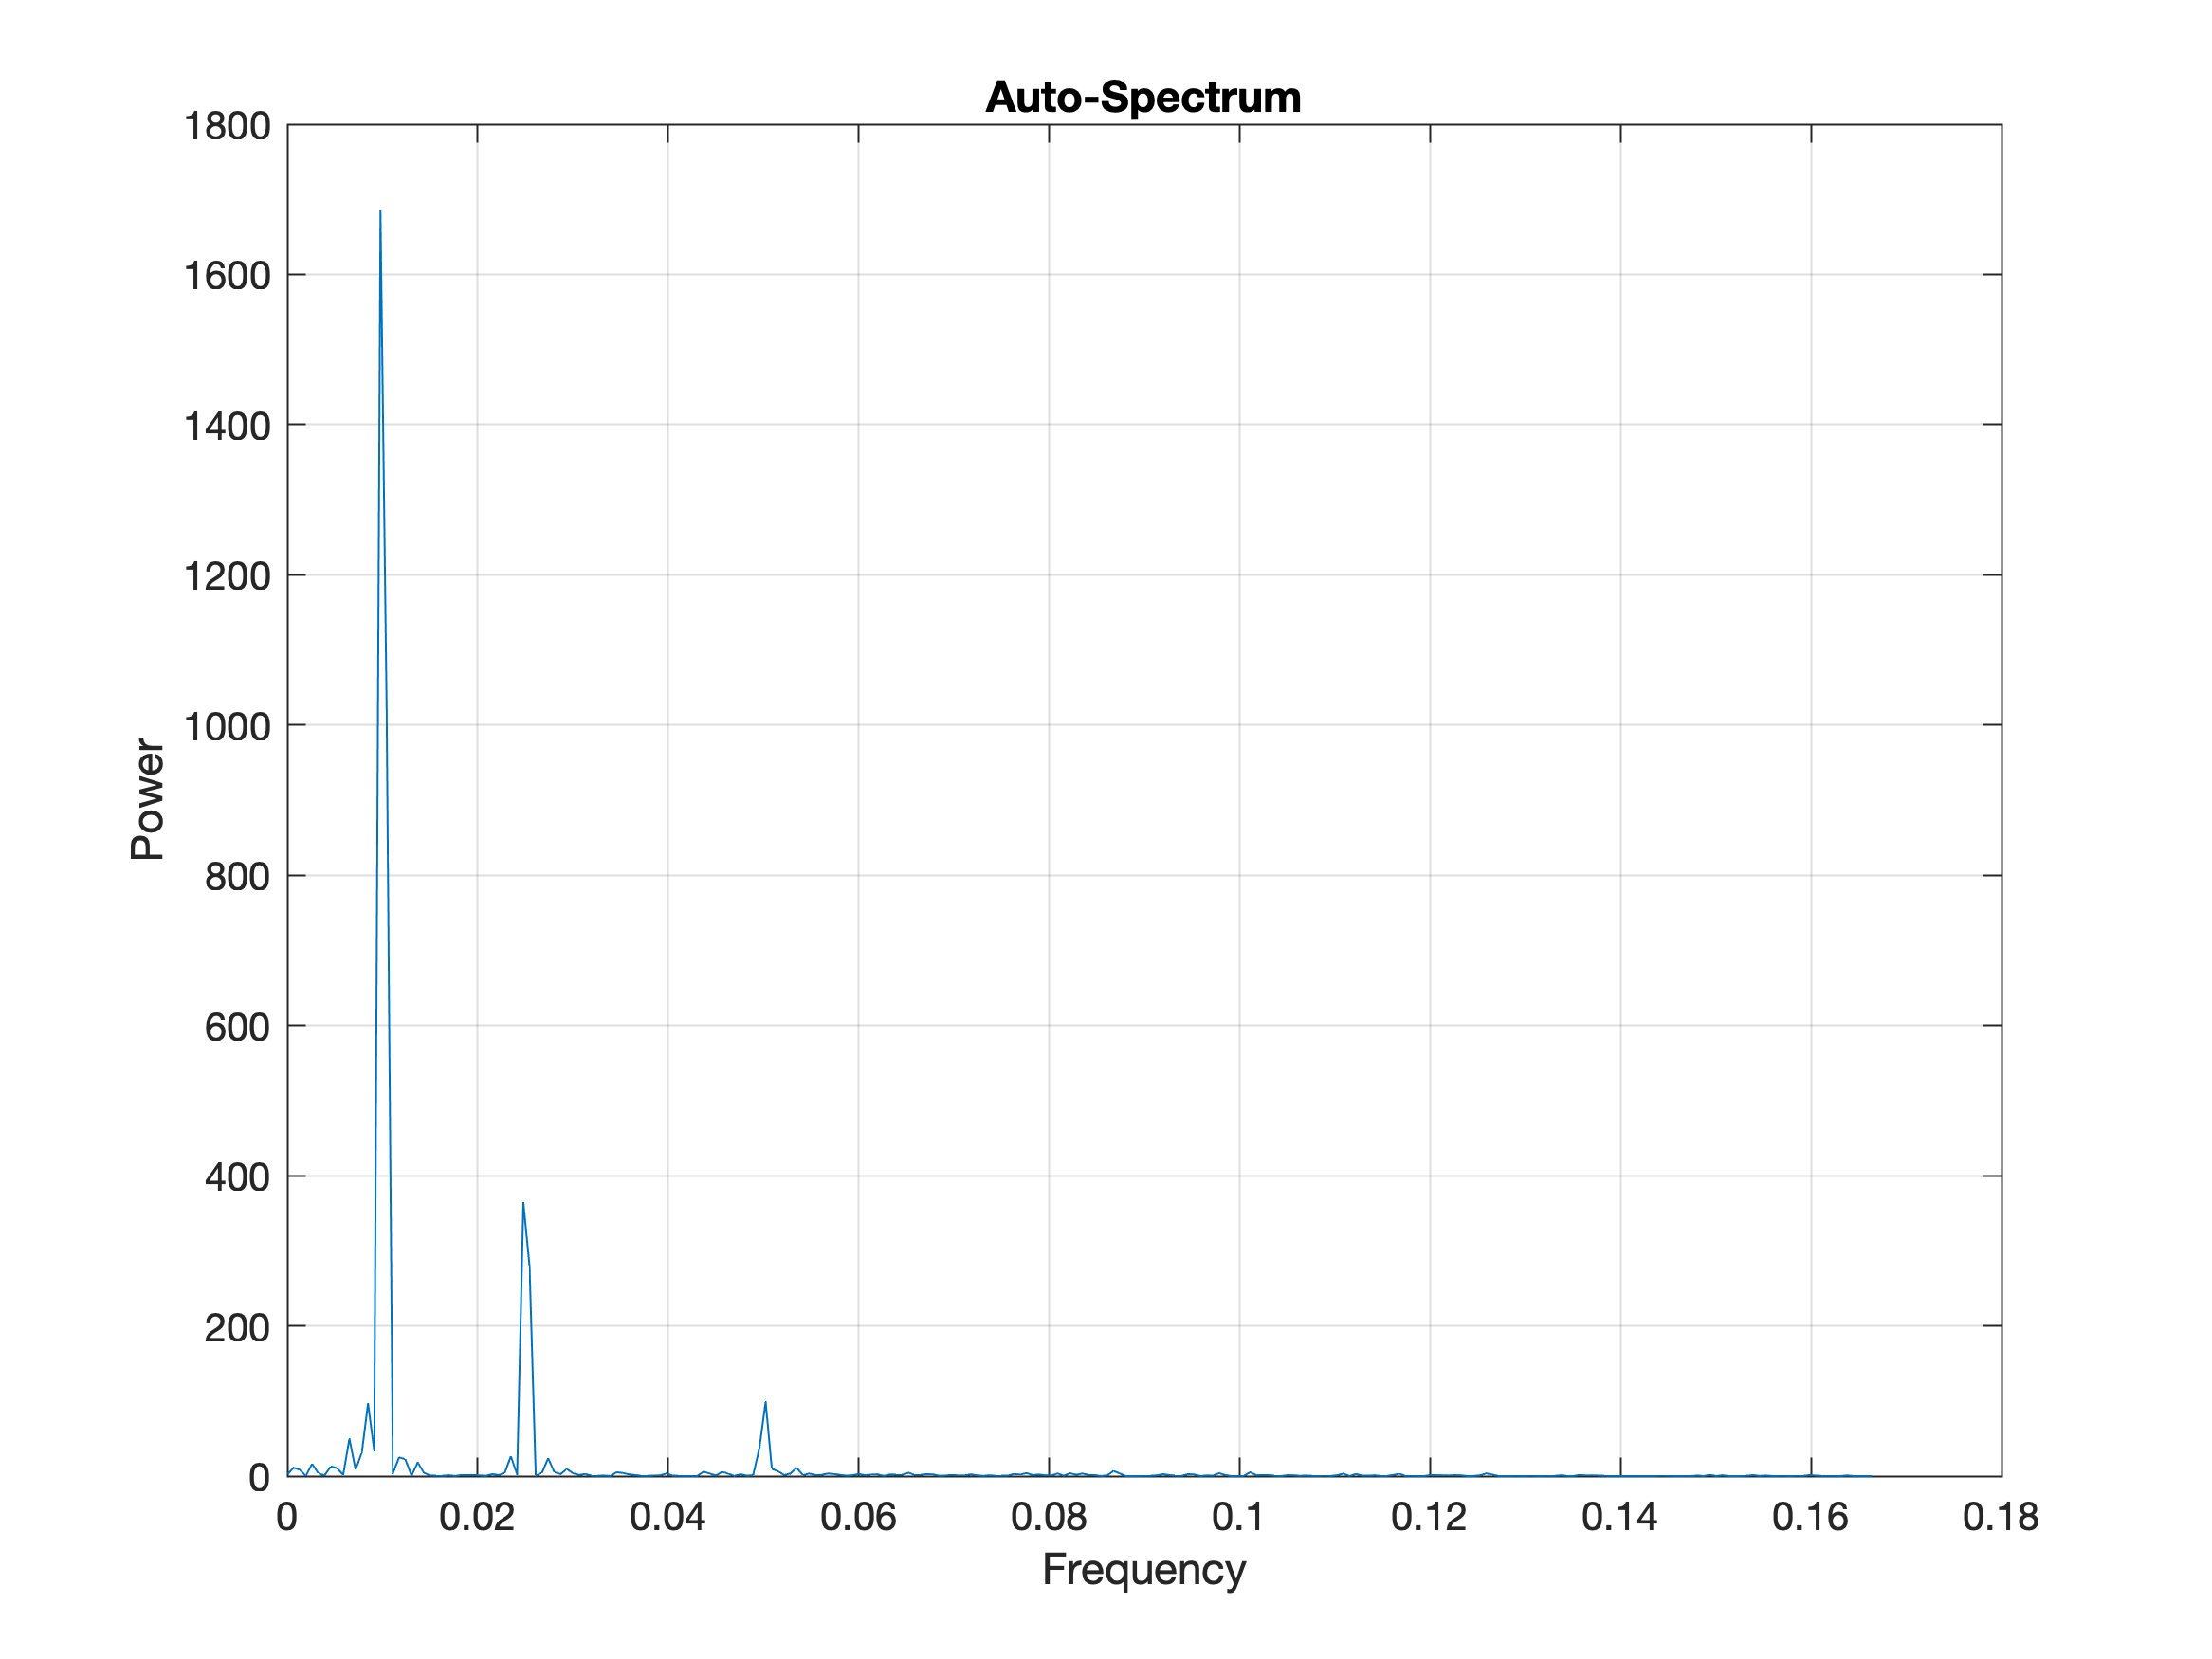
Hence, there is no reference data point for t=1000 and consequently the last value in series1L is an NaN. We can solve the problem by either using
t = 0 : 3 : 996;
or by allowing the linear interpolation to extrapolate
series1L = interp1(series1(:,1),series1(:,2),t,...
    'linear','extrap');
which both results the powerspectrum in a plot as expected.
The second example is even more tricky and almost impossible to solve for beginners, except for simply re-typing the entire line of code causing an error message. It happens to me again and again that I accidentally create hidden characters in the MATLAB editor. This happens when you accidentally press several keys at the same time while typing fast. This often results in error messages that cannot be explained at all, for instance in a simple line of code such as
t = 0 : 3 : 996;
I have tried to create such an example artificially after it often happens in class. I didn’t succeed, maybe because MATLAB now detects such problems and displays them as correct error messages? As an example, I added a small extra character in the code
t = 0¨ : 3 : 996;
which is not actually a hidden character. However, MATLAB yields the error message
Error: File: untitled.m Line: 33 Column: 6
Invalid text character. Check for unsupported
symbol, invisible character, or pasting of
non-ASCII characters.
indeed suggesting that there may be an invisible character within the code. If you suspect that such a problem is the reason for an inexplicable (unlike in the example above) error message, then it is actually recommended to rewrite the line. Alternatively, you can copy the line to another editor (not the MATLAB editor), such as CotEditor, which might display the hidden character.
If one of these two examples, or any other example, appears during the course, the students are actually very interested in how the teacher solves the problem. If you’ve been teaching for several years, you’ll be collecting problem-solving strategies that will benefit the students during the course. Troubleshooting is therefore not an annoying mishap in the course, but a valuable contribution to teaching. Sometimes this part is more exciting than the regular lessons.
We can now go even further, especially in times when AI helps us to shorten the process of collecting and processing information, giving us more time to develop new creative ideas. Troubleshooting in projects, the failures and their solutions, should be part of the documentation of project results much more often. Often, experiments are repeated unnecessarily because failures were not published years before.
When assessing student performance, the documentation should include the solution process with all failures, as well as the documentation of the use of prompts and the correction of AI results. Student performance should be measured not only by the end result, but also by the solution process. What failures have you encountered and how have you dealt with them? What failures have they encountered and how have they processed these failures? That is a creative process that should be appreciated, not just the end result.