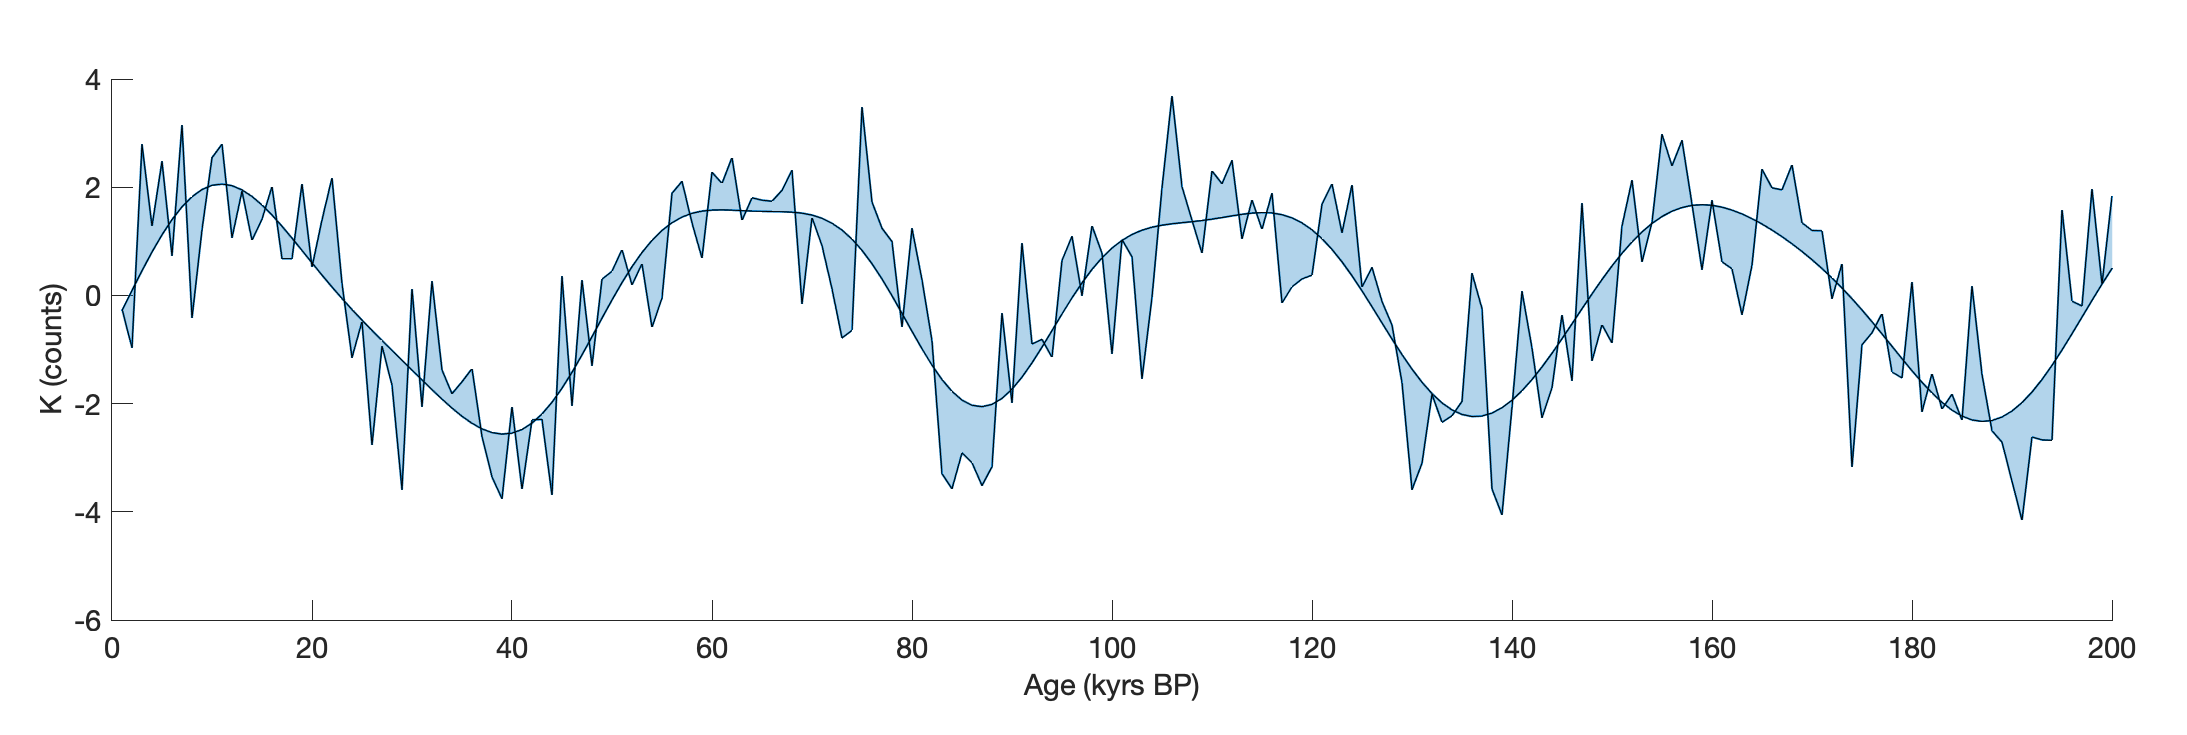
Our paleoclimate time series often contain too much detail, i.e. they have a high variance in the high frequency range. Of course, this can be true climate variability, but it usually contains a lot of noise. Therefore we like to plot a filtered variant of the curve together with the original curve and fill the area between the two. Here I show you how it works with MATLAB. Continue reading “Shading Areas Between Two Curves With MATLAB”
Classifying past climate change in the Chew Bahir basin, southern Ethiopia, using recurrence quantification analysis
Article accepted on 45 kyr climate change classification in the ChewBahir, S Ethiopia, using recurrence plots. Springer journal Climate Dynamics is my favorite journal for papers on paleoclimate, lakes, archaeology … and lots of maths and ~1,000 lines of MATLAB code! This work is part of the Hominin Sites and Paleolakes Drilling Project.
Playing Around with Floating Point Numbers with MATLAB
Computers do not work with real numbers, of which there are infinitely many, but with a finite number of floating point numbers. Most real numbers do not exist in computers because they fall between two floating point numbers. Everything we calculate with a computer may therefore have a finite accuracy. Here are some MATLAB examples. Continue reading “Playing Around with Floating Point Numbers with MATLAB”