When editing the images of the MAPIR Survey 2 NDVI camera, I learned a lot about how cameras actually capture and store images. The knowledge was important in order to properly import the images into MATLAB, process them and compute an NDVI image of them. If you do not do it right, you can see it immediately: You do not get a nice picture!
Taking an image with the MAPIR Survey 2 NDVI camera is easy. The company that makes the cameras, Peau Productions Inc. in San Diego CA, uses a GoPro sized and shaped camera system, manufactured by another company. They do not touch the software, but add new lenses and filters to the camera. According to the camera specification page the MAPIR Survey 2 NDVI camera uses a Sony Exmor IMX206 16MP (Bayer RGB), which is an important information to properly load the images into MATLAB.
According to the webpage of MAPIR about “Calibrating Images in QGIS with MAPIR Plugin” the Survey2 cameras capture 16 bit RAW photos, which means there are 16 bits (65,536) pixels and a pixel value range from 0 to 65,535. When the camera saves a JPG it compresses (removes) the pixels leaving a range of only 0 to 255. Since we are capturing a reflectance of light and not trying to make a “pretty picture” we want to always use the RAW format. Define file name and size of the image.
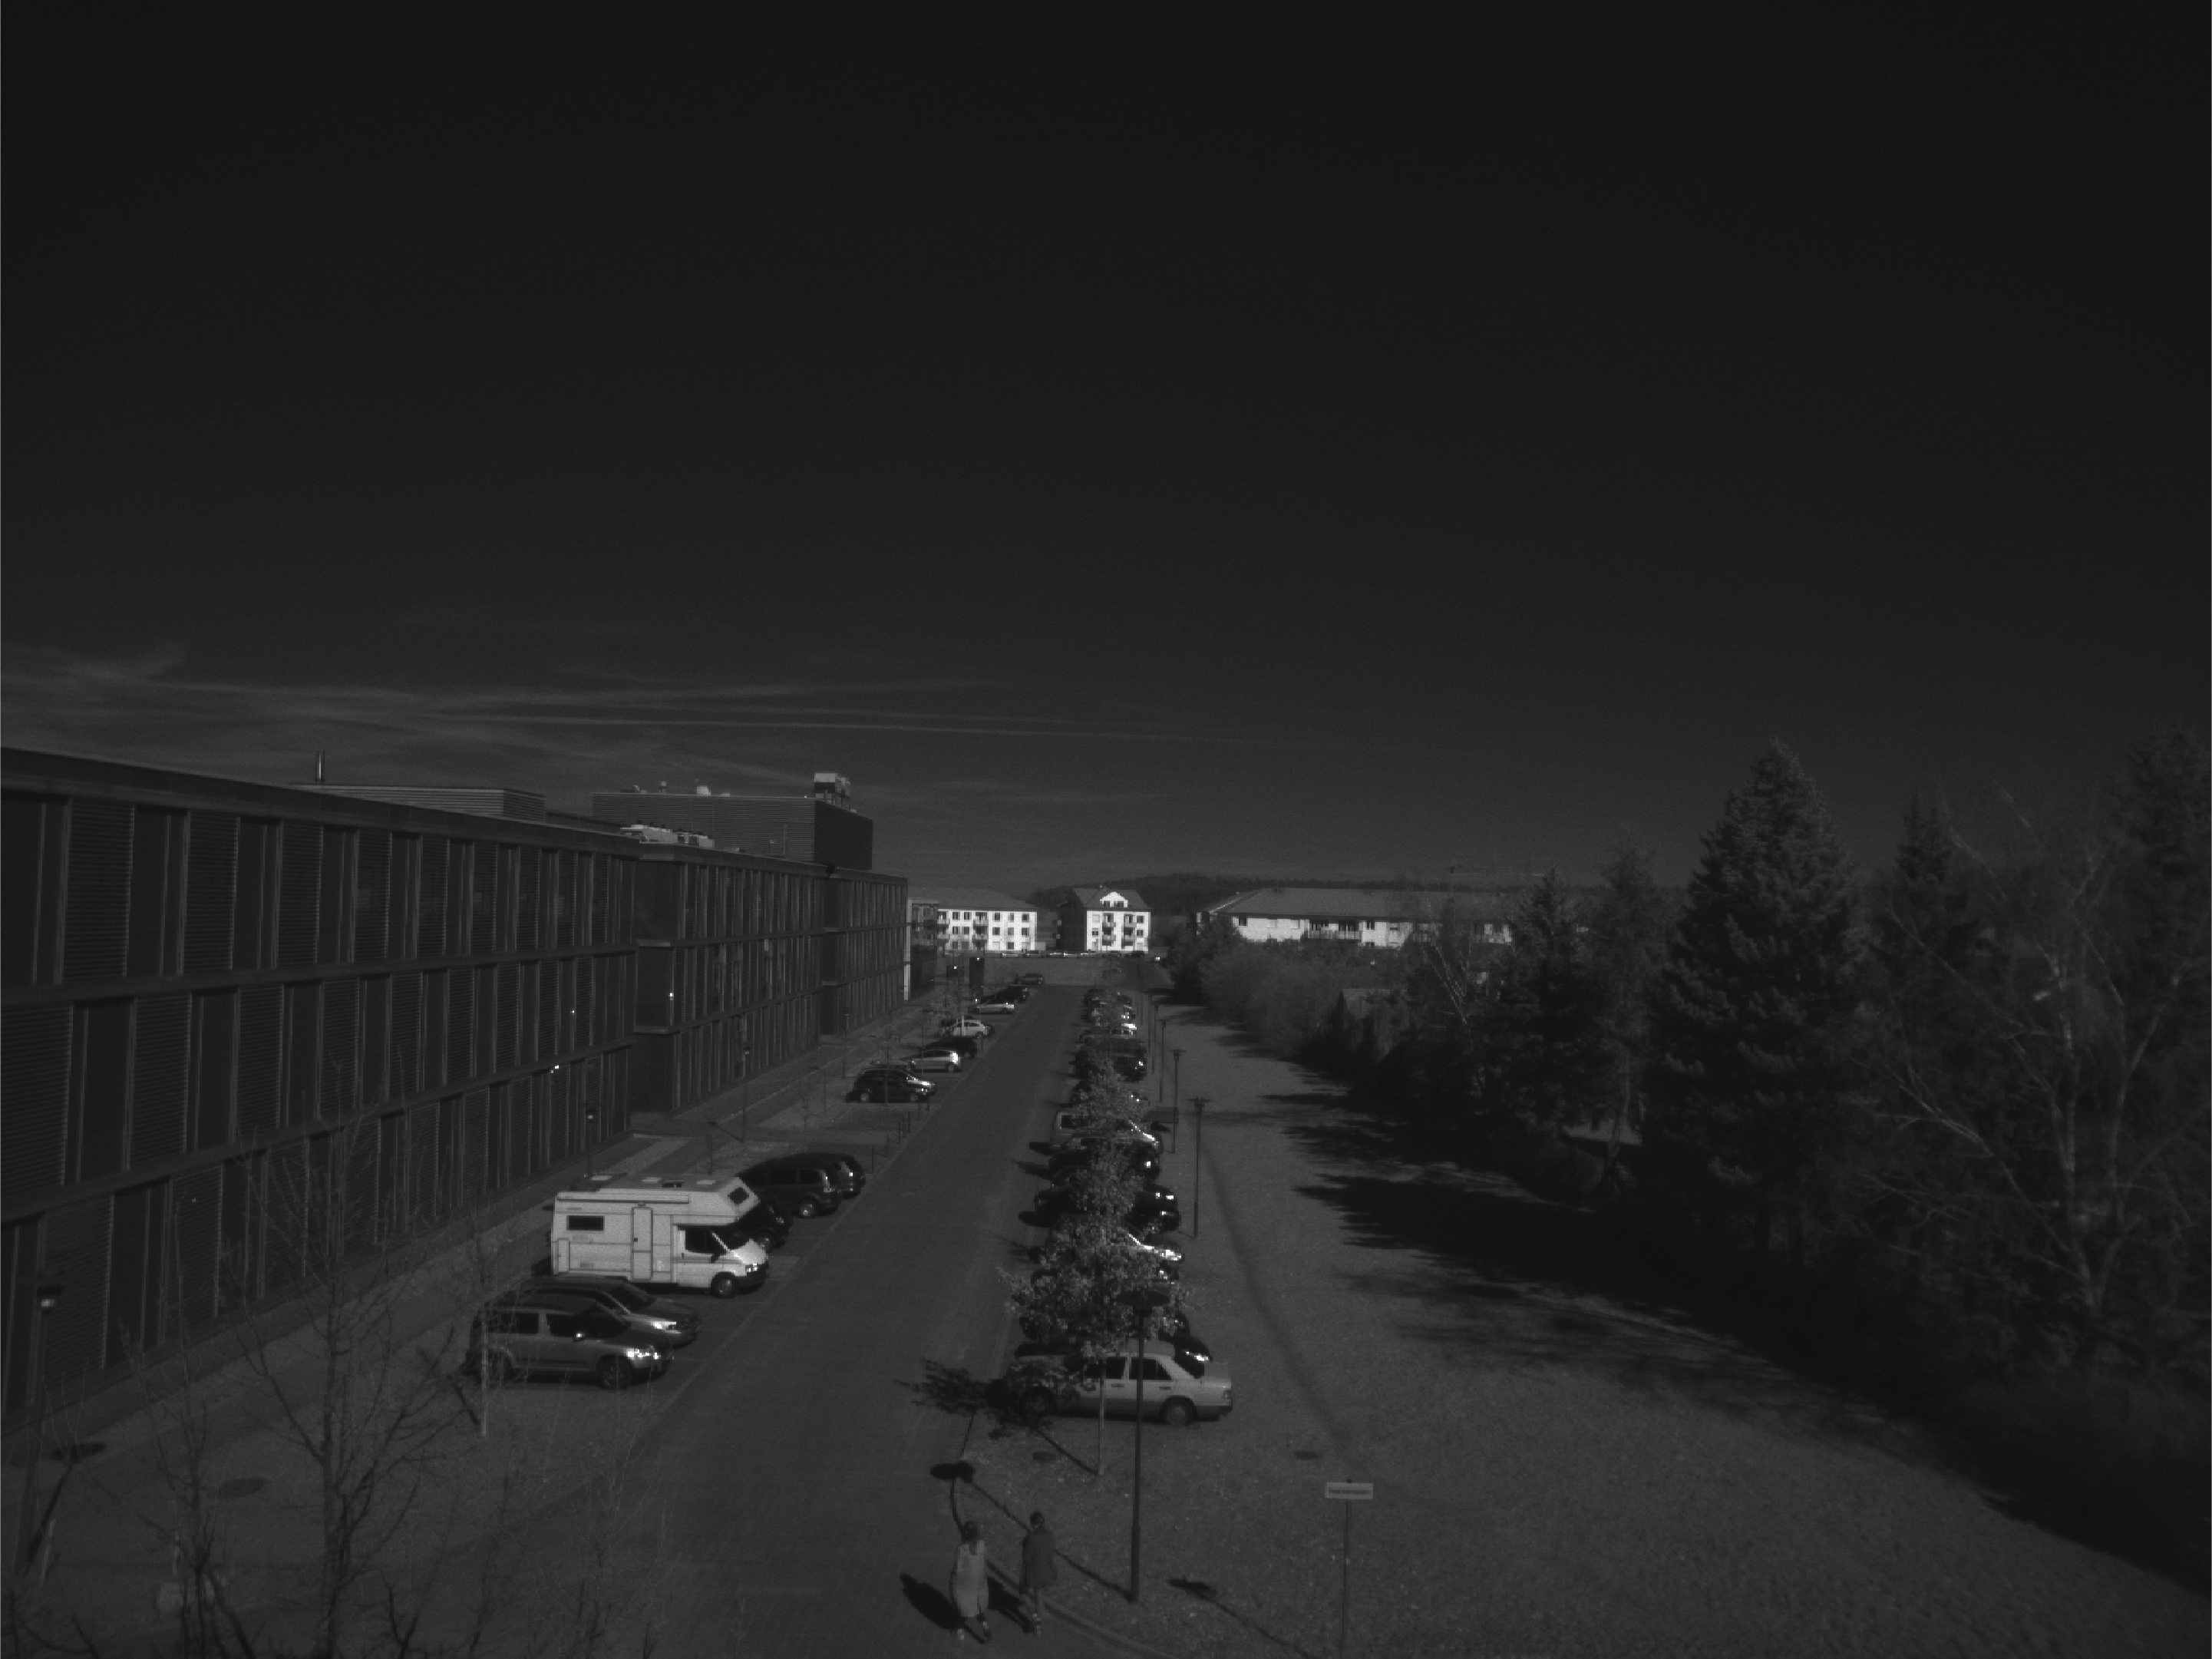
The sensor specification page at Sony Inc., however, says that the sensor actually acquires 12 bit images, which is in agreement with the information I received by email from the software engineer at Peau Productions Inc. in March 2017, but not with what is said on their webpage. With support from this engineer, our own research on the problem and some support from readers of Stackoverflow we solved the problem. We read the data in a uint16 array in MATLAB and displaying the image suggests that we did it right:
clear, clc, close all
filename = '2017_0328_110031_007.RAW';
row = 3456;
col = 4608;

id = fopen(filename);
I1 = fread(id, [col, row],'*uint16','ieee-le');
I1 = I1';

imshow(I1,'InitialMagnification',30)
The NDVI is an index to map live green vegetation. The index is based on the ratio of the difference of the red and infrared radiances. The pigments of plants strongly absorb visible light (400–700 nm) for the use in photosynthesis, whereas it reflects near-infrared light (700–1100 nm). The MAPIR Survey2 NDVI Camera measures red (660 nm) and infrared (850 nm) to calculate the NDVI – but where in the grayscale image above are our red and infrared data?
The Sony sensor is a single-chip sensor, storing the three colors red, green, blue in a single array I1, displayed as a grayscale image using the default gray colormap in MATLAB. Most cameras have single-chip sensors, even SLRs, which can store images in RAW format – in addition to the JPEG format using lossy compression. More expensive three-sensor cameras also exist, using separate sensors for the filtered red, green, blue color ranges.
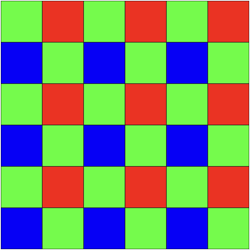
The way single-chip cameras store RGB images on a single chip is using the Bayer mosaic, named after Bryce Bayer (1929–2012), a research scientist at Eastman Kodak. Bayer’s idea was to use filters and direct the individual colors red, green, blue onto individual pixels on the sensor, usually in an RGGB arrangement, because the human eye reacts more sensitively to green than to red or blue. Due to the Bayer mosaic SLRs with 16 MP resolution, as with our Sony chip not really take 16 MP, but only 4 MP with red and blue (25% each) and 8 MP with green (50%), and then interpolate the three colors each at 16 MP.
The RAW format provided by SLRs does not mean that the colors are stored in full resolution, but that the images are not (for example, using the JPEG algorithm) compressed. Instead, using MATLAB we can import and process the image in its original resolution, i.e. 4 MPs with red and blue, and 8 MPs in green.
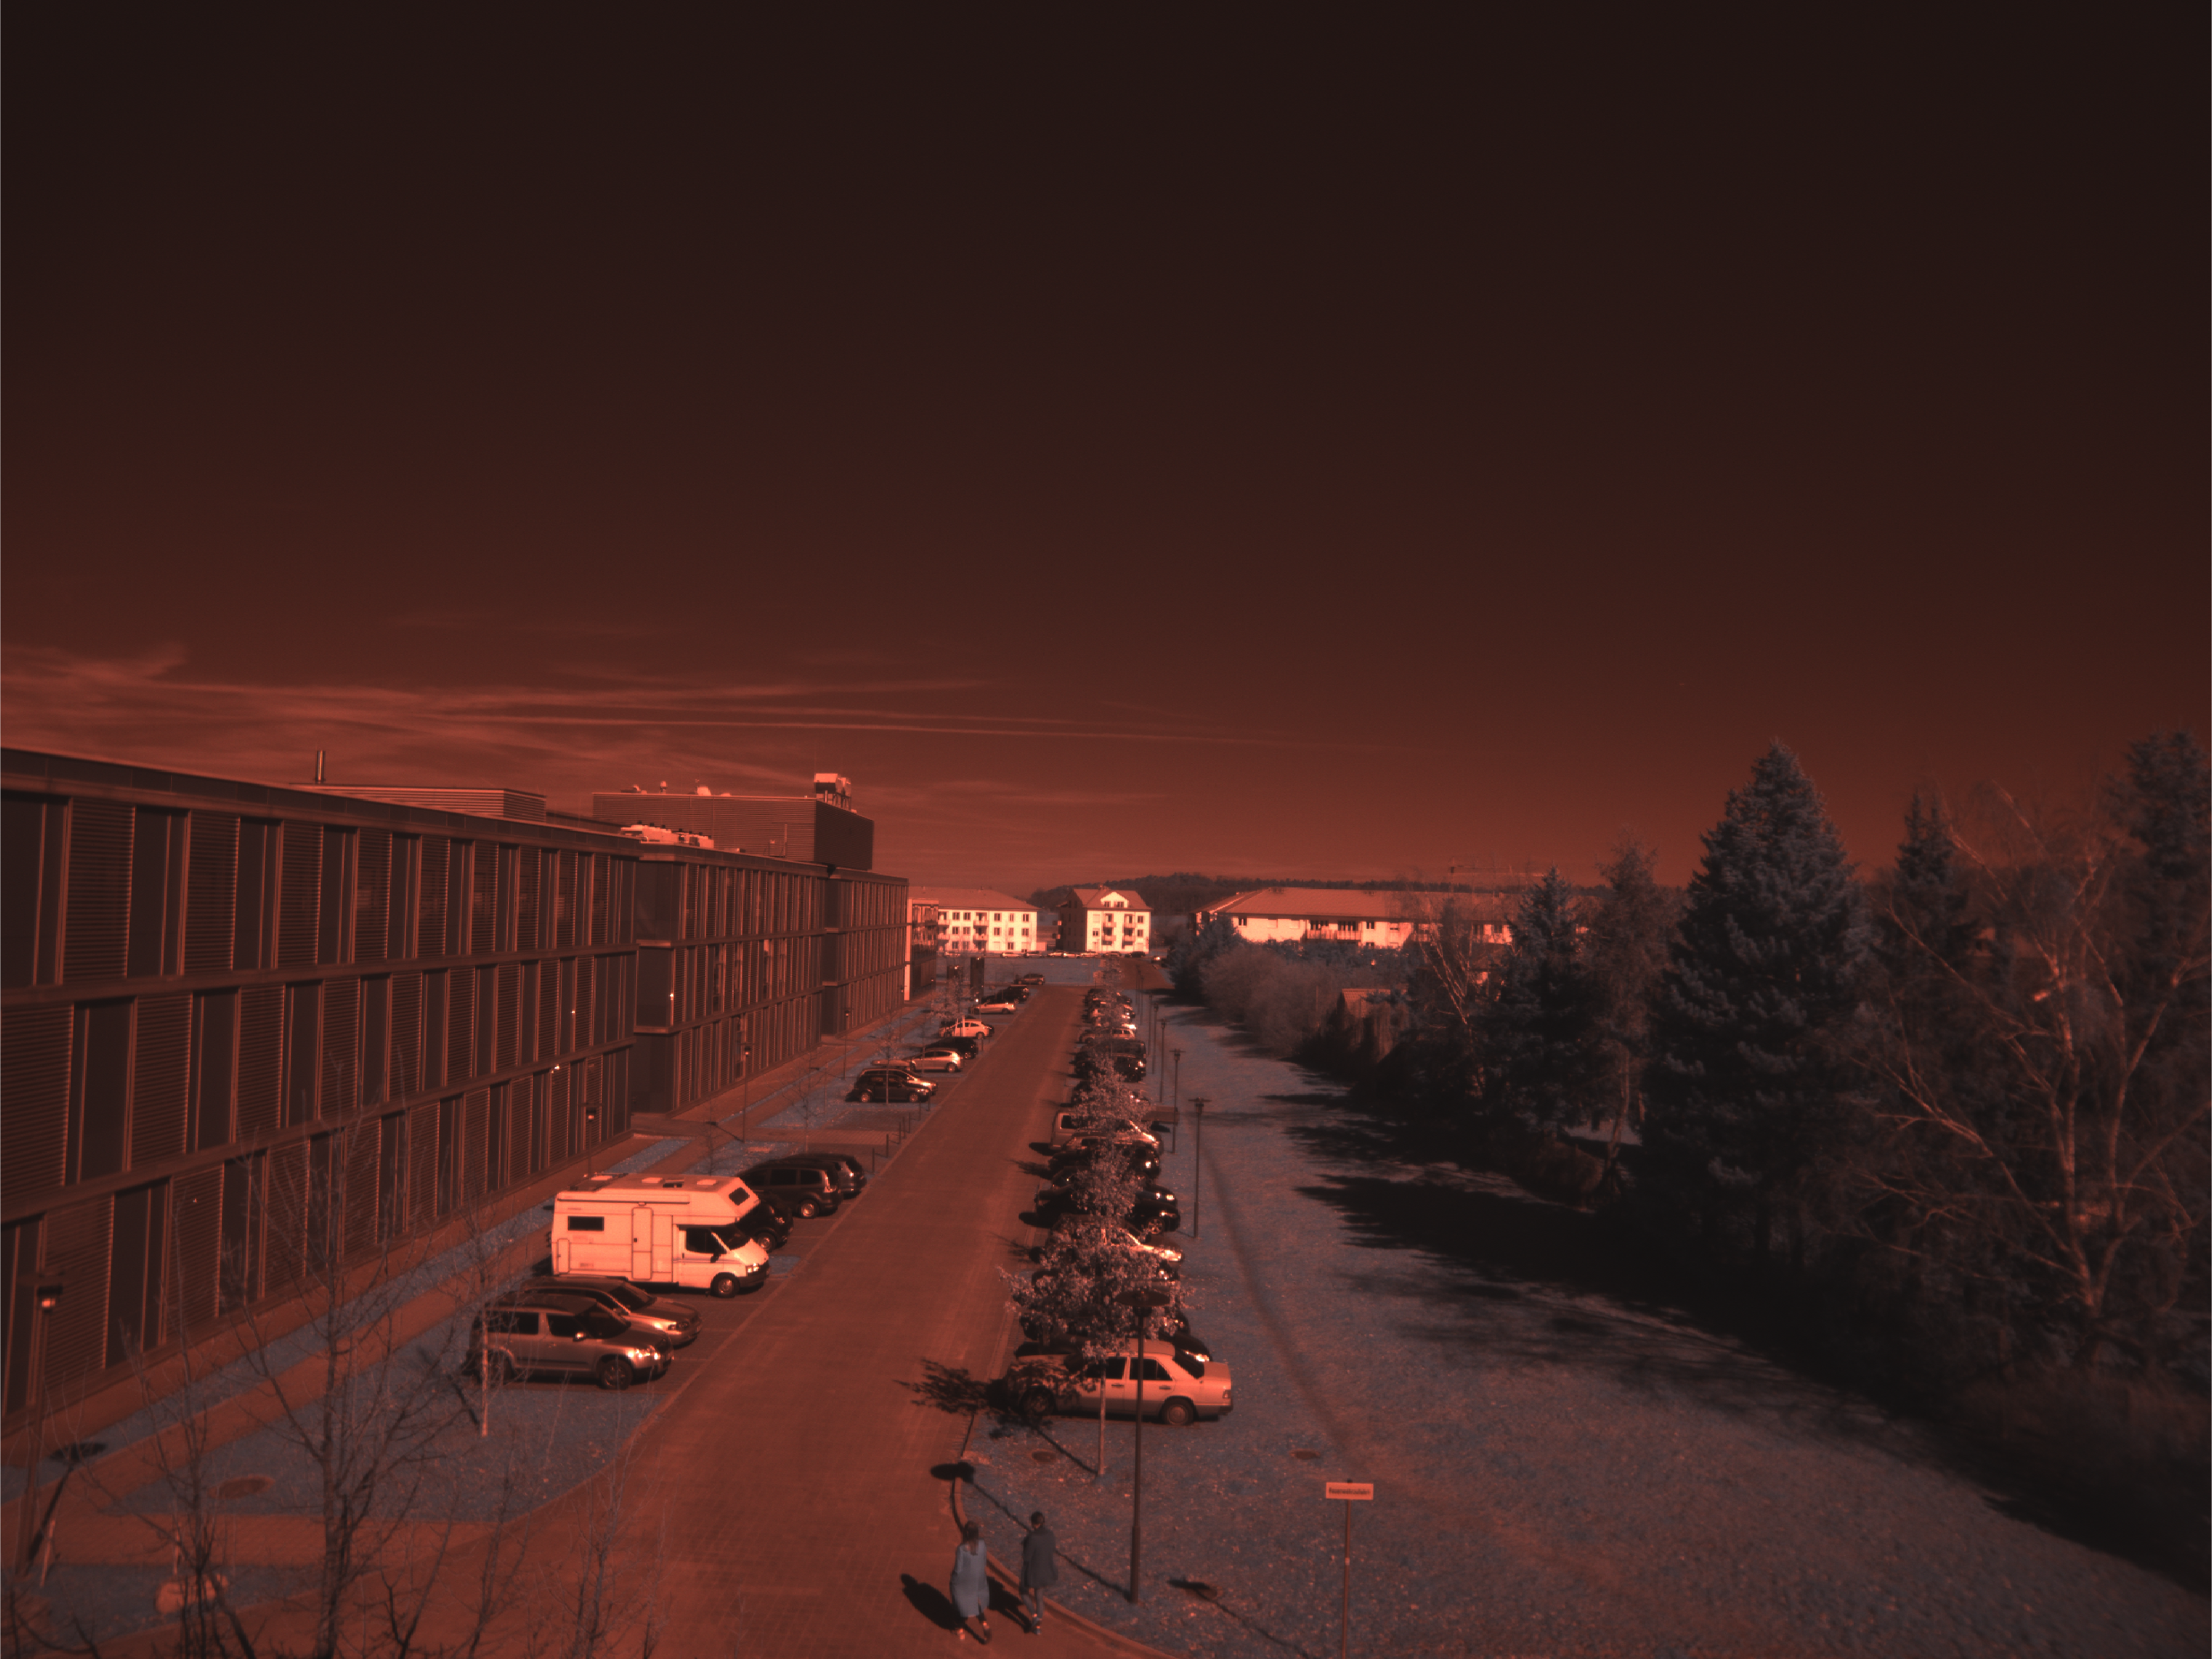
Alternatively, we can demosaic the image, like an SLR does, for instance using the MATLAB function demosaic. Demosaicing the image, according to Help, converts a Bayer pattern encoded image to a truecolor (RGB) image using gradient-corrected linear interpolation:
I2 = demosaic(I1,'rggb');
imshow(I2,'InitialMagnification',30)
The image can then be processed and analyzed according to the concept presented elsewhere on the MRES blog.
Recommended reading
Gonzalez RC, Woods RE, Eddins SL (2009) Digital Image Processing Using MATLAB – 2nd Edition. Gatesmark Publishing, LLC.
Trauth, M.H. (2015) MATLAB Recipes for Earth Sciences – Fourth Edition. Springer, 427 p., Supplementary Electronic Material, Hardcover, ISBN: 978-3-662-46244-7.


