
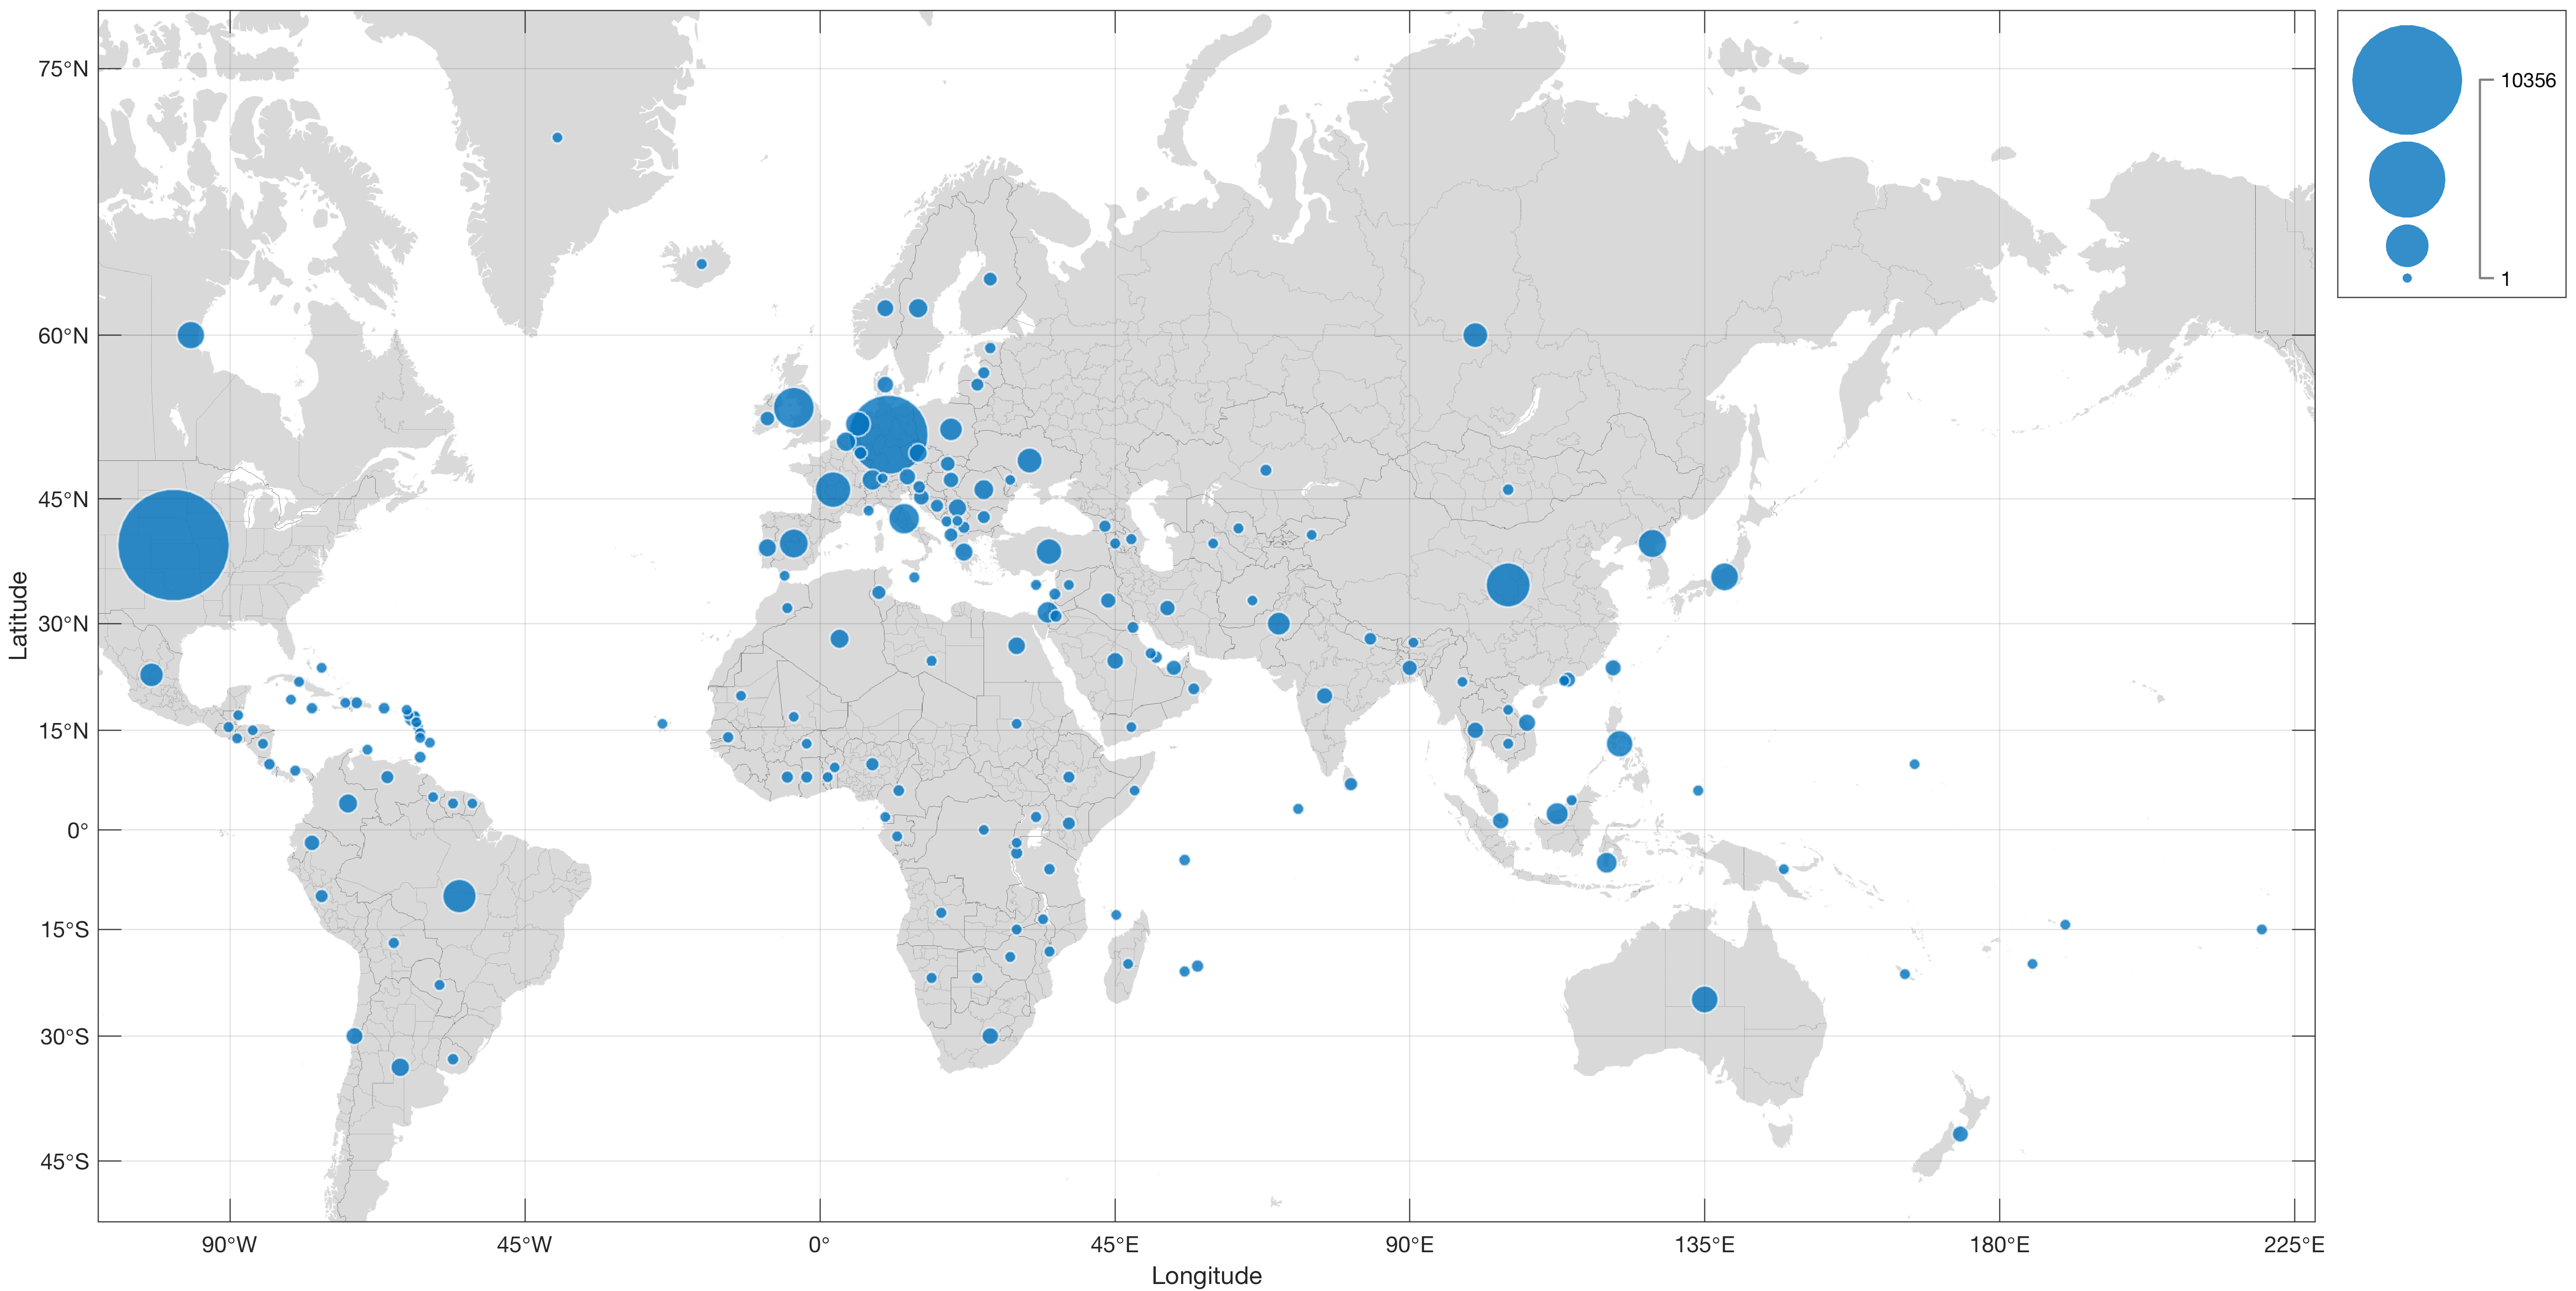
The new release R2017b of MATLAB has a nice way of visualizing data values at specific geographic locations. Here I use the new geobubble function to display the statistics of the MRES blog.
The WP Statistics plugin for WordPress provides a comprehensive site statistics including the number of online users, visits, visitors and page statistics. I used the GeoIP location by country, together with the central coordinates of all countries, to display bubbles on a map with diameters indicating the number of visits for each individual country, stored in a file called countries.txt. We first load the data from the file using
clear, clc, close all
fid = fopen('countries.txt');
C = textscan(fid,'%s %f %f %u',...
    'Delimiter','\t',...
    'CollectOutput',1);
fclose(fid);
and extract the variables country, coord (with latitudes and longitudes of the countries) and counts from the cell array C by typing
country = C{1};
coord = C{2};
counts = C{3};
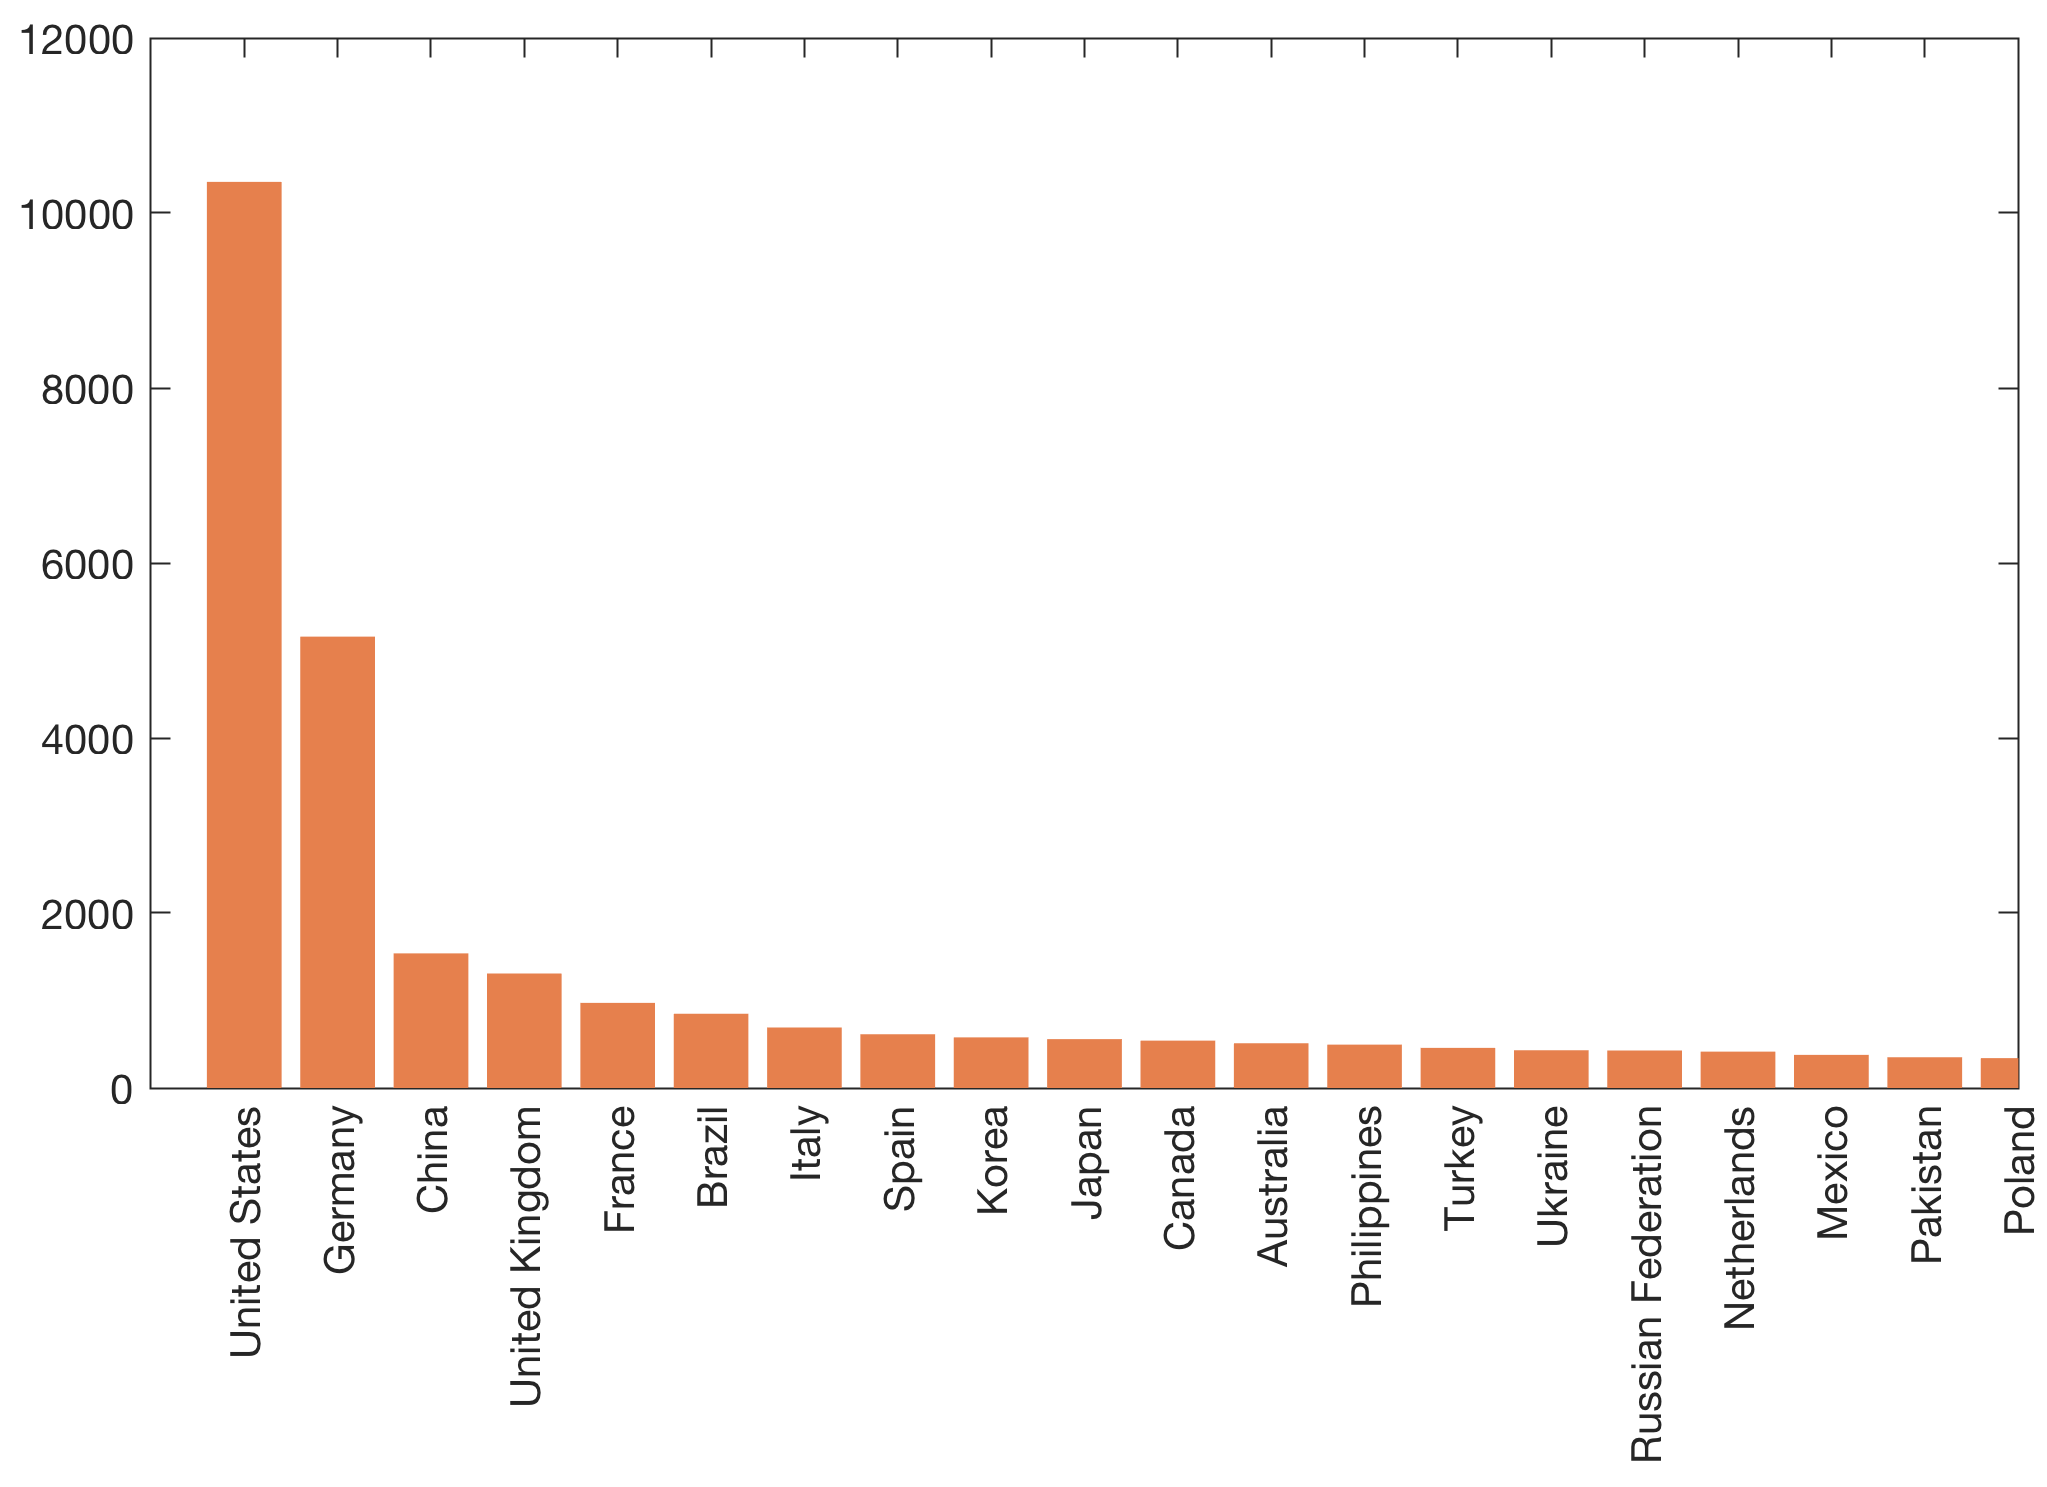
Next we create a simple bar plot displaying the counts for each country, sorted from high to low numbers by typing
XTickN = 1 : length(country);
axes('Position',[0.1 0.3 0.8 0.6],...
   'XLim',[0 20],...
   'XTick',XTickN,...
   'XTickLabel',country,...
   'XTickLabelRotation',90,...
   'Box','On')
hold on
bar(counts,'FaceColor',[0.9 0.5 0.3])
hold off
We then merge the data into a table using the function table:
T = table(country,coord(:,1),coord(:,2),counts)
And then we use the new function geobubble to create a world map with the bubbles showing the number of visits for each country.
figure('Position',[100 100 1200 600])
gb = geobubble(T.Var2,T.Var3,T.counts,...
    'Basemap','grayland',...
    'BubbleWidthRange',[5 50]);