
 In a series of blog posts, I will tell you a little about how I teach computational geosciences with MATLAB. In the morning of the last day I teach image processing and analysis.
The course ends with one of the most attractive topics in the work with MATLAB in Earth Sciences. The result of image processing and analysis is generally a colorful picture. After a week with lots of figures and graphics, this theme is therefore mostly recreation and entertainment at the same time. We start with simple examples of image processing, importing and displaying photos, image enhancement, and saving data.
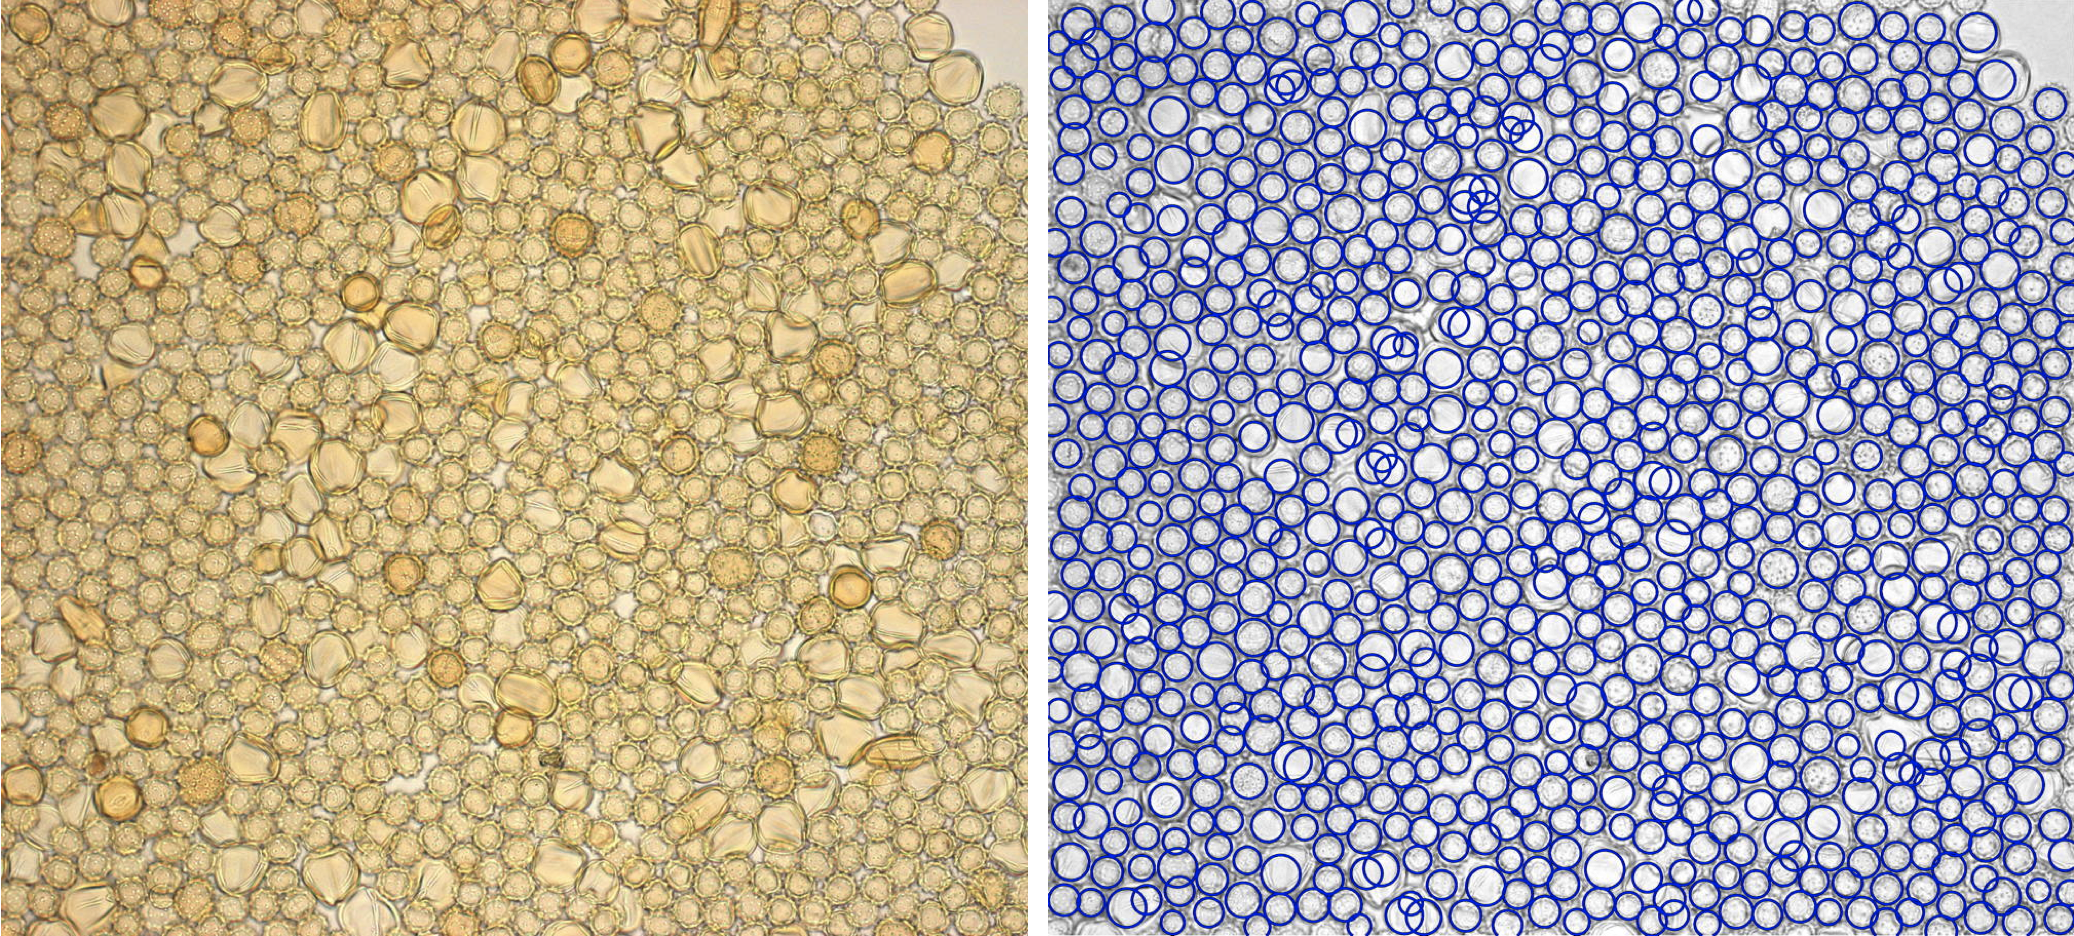
In the second part, satellite images of Landsat, Aster and Hyperion sensors are loaded, improved, referenced and stored. A method of image enhancement or referencing, which is common in remote sensing, is presented here. Finally, some typical examples of image analysis are shown, e.g. color-intensity transects across varved lake sediments, grain size analysis from microcope images, quantification of charcoal in images and shaped-based object detection in images. The last example, counting objects by their shape, uses the Hough transformation. This method has been used to count pollen, as shown in the above image. The algorithm used for grain size analysis is used to count flamingoes, as presented in an earlier post.
A great resource for image analysis with MATLAB is the book by Gonzales et al. (2009) with co-author Steve Eddins, who has developed MATLAB and image processing capabilitities for MathWorks since 1993 and runs an excellent blog on image processing at Mathworks.com.
References
Gonzalez RC, Woods RE, Eddins SL (2009) Digital Image Processing Using MATLAB – 2nd Edition. Gatesmark Publishing, LLC