
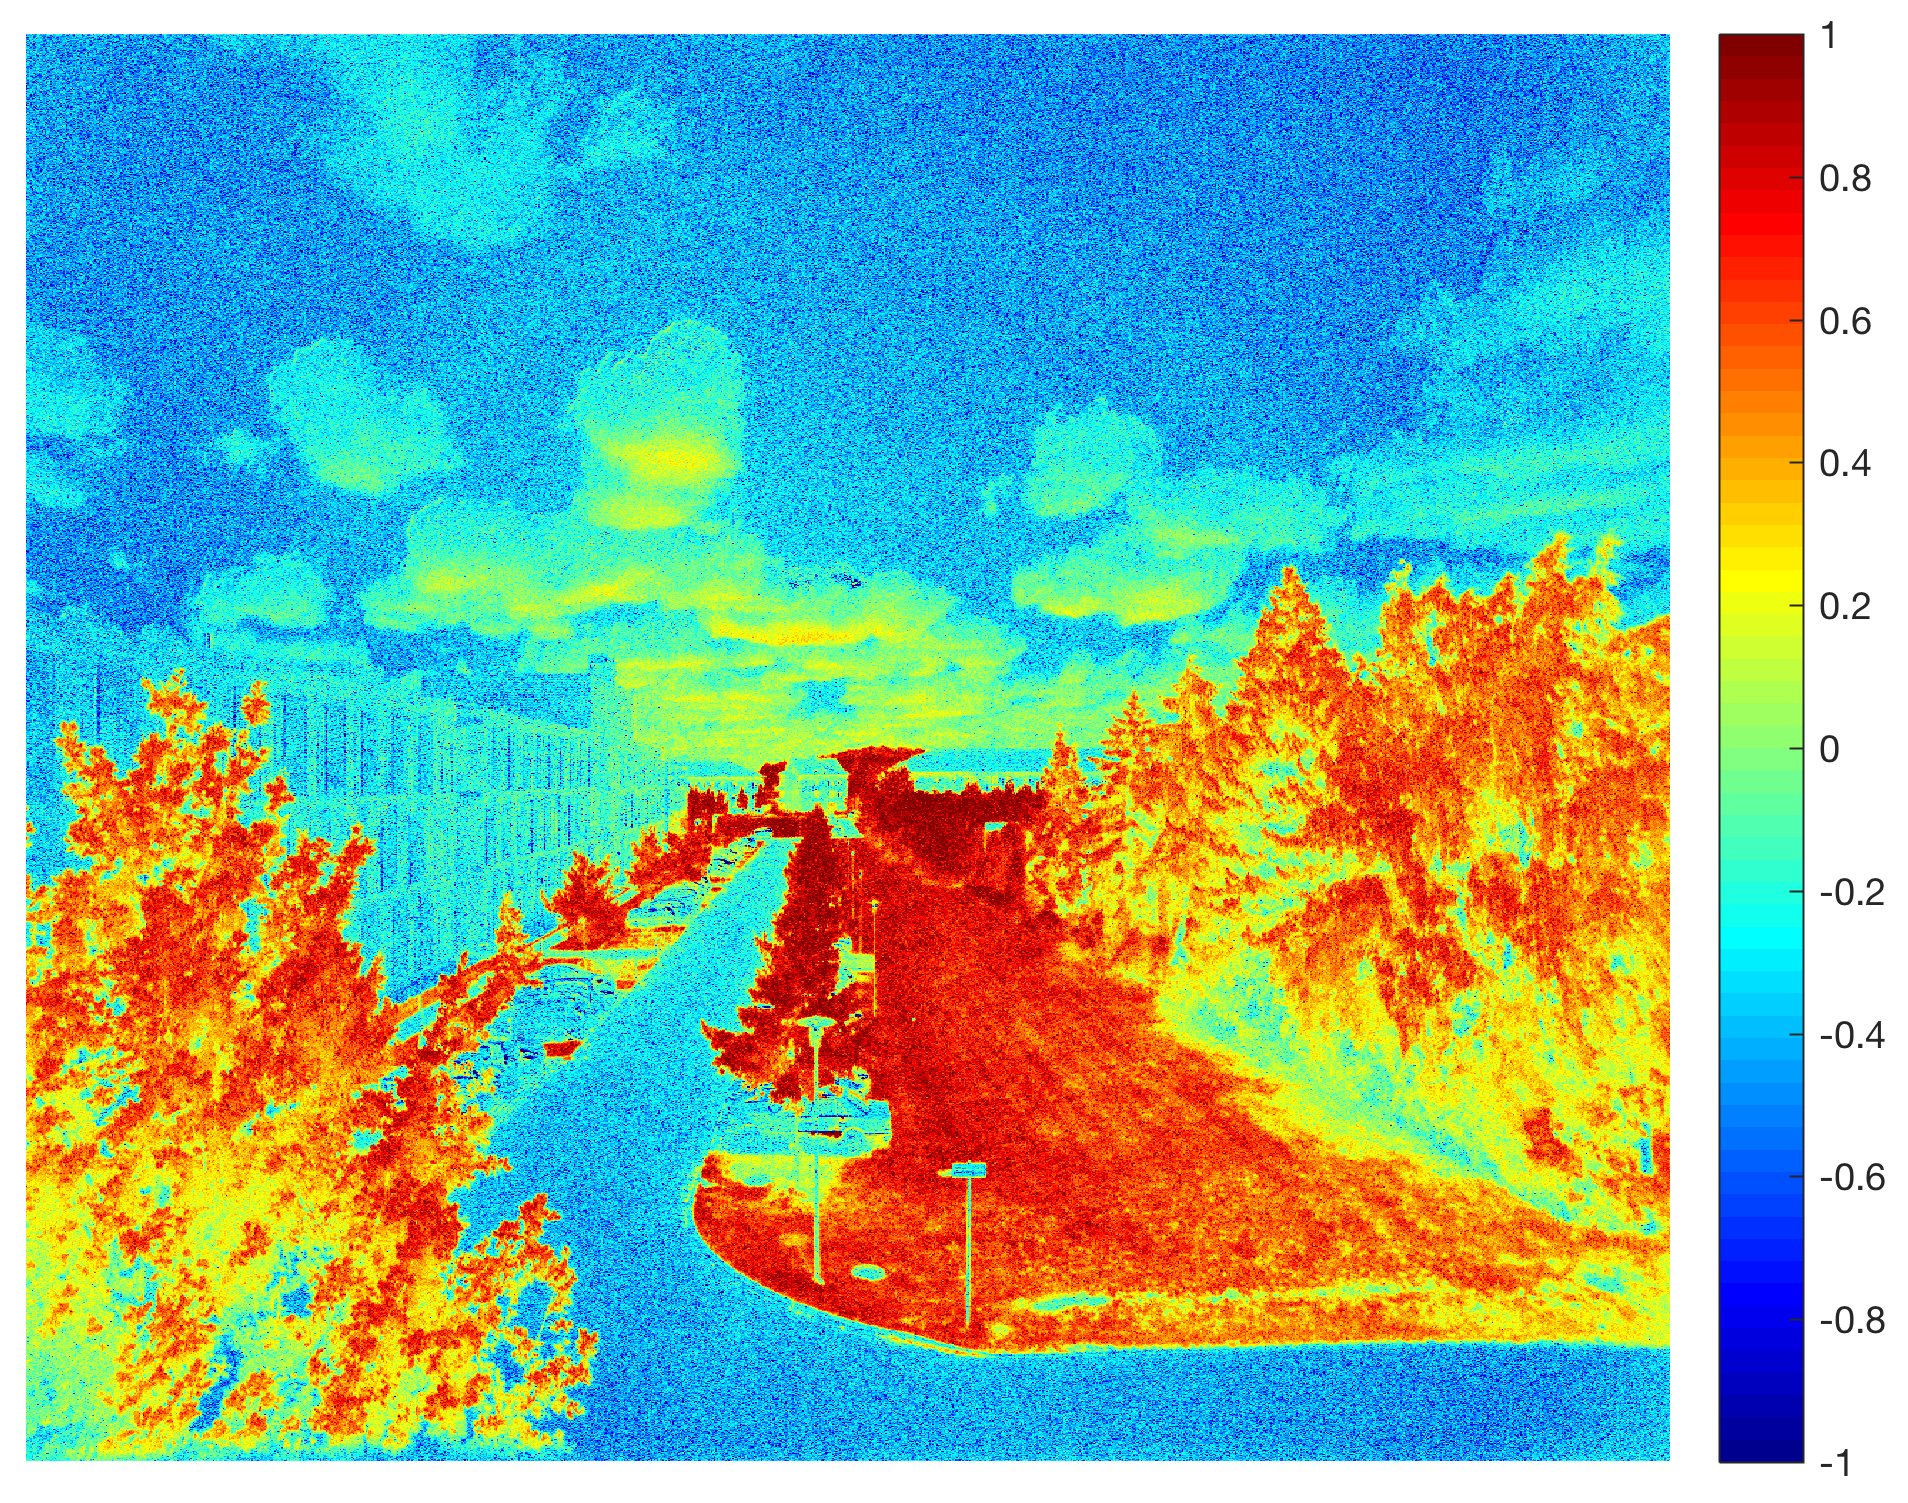
In an earlier post in March 2017 I explained how to capture NDVI Red+NIR images using a MAPIR Survey2 NDVI, to import the images into MATLAB and to calculate the Normalized Difference Vegetation Index. Here is the result of the experiment repeated in June 2017 during the growing season.
The NDVI is an index to map live green vegetation. The index is based on the ratio of the difference of the red and infrared radiances. The pigments of plants strongly absorb visible light (400–700 nm) for the use in photosynthesis, whereas it reflects near-infrared light (700–1100 nm). The MAPIR Survey2 NDVI Camera measures Red (660 nm) and Infrared (850 nm) to calculate the NDVI. The exercise explains how to acquire images with the camera, to import and process the images with MATLAB, and to calculate the NDVI to identify vegetation in an image with MATLAB.
The exercise explains how to acquire images with the camera, to import and process the images with MATLAB, and to calculate the NDVI to identify vegetation in an image with MATLAB. Comparing the two images acquired in March and June clearly shows differences in the vegetation, in particular since deciduous tree have green leaves.