
In a series of blog posts, I will tell you a little about how I teach computational geosciences with MATLAB. On the first half of day 4 of the one-week course I teach multivariate statistics.
Multivariate analysis aims to understand and describe the relationships between an arbitrary number of variables. Earth scientists often deal with multivariate data sets such as microfossil assemblages, geochemical fingerprints of volcanic ash layers, or the clay mineral content of sedimentary sequences.
Most multi-parameter methods simply try to overcome the main difficulty associated with multivariate data sets, which relates to data visualization. Whereas the character of univariate or bivariate data sets can easily be explored by visual inspection of a 2D histogram or an xy plot, the graphical display of a three variable data set requires a projection of the 3D distribution of data points onto a two-dimensional display. It is impossible to imagine or display a higher number of variables.
One solution to the problem of visualization of high-dimensional data sets is to reduce the number of dimensions. A number of methods group together highly-correlated variables contained within the data set and then explore the reduced number of groups. The classic method for reducing the number of dimensions is the principal component analysis (PCA) that I introduce in the first part of the course on multivariate statistics. While using the PCA it is important to remember the purpose of the method to linearly unmix Gaussian data as explained in an earlier post. An example of unmixing the composition of lake sediments was given in a second post about the PCA.
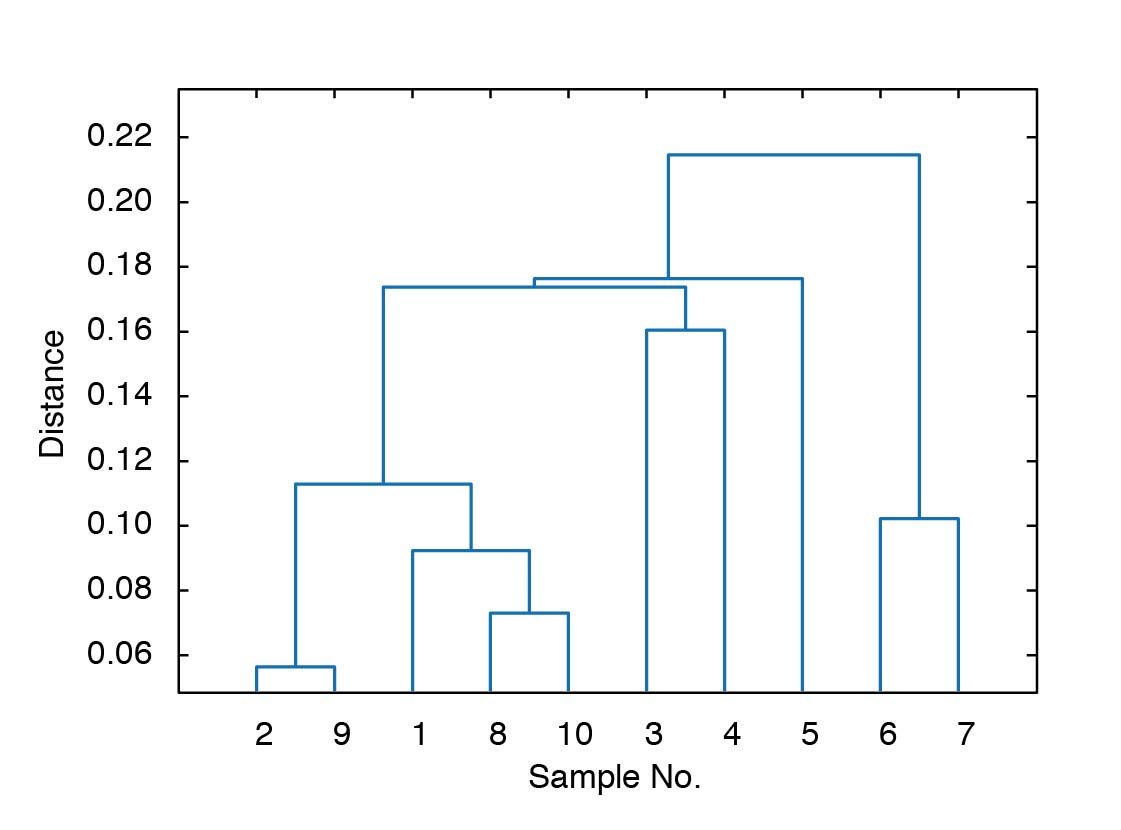
A second important suite of multivariate methods aims to group objects by their similarity. As an example cluster analysis (CA) is often used to correlate volcanic ash layers such as that used in the above example. Tephrochronology attempts to correlate tephra by means of their geochemical fingerprints. When combined with a few radiometric age determinations from the key ash layers this method allows correlation between different sedimentary sequences that contain these ash layers. Cluster analysis is also used in the field of micropaleontology, for example, to compare the pollen, foraminifera, or diatom content of different microfossil assemblages.
The other multivariate methods explained in the MRES book are briefly touched during the course but explained in greater detail.