
In a series of blog posts, I will tell you a little about how I teach computational geosciences with MATLAB. There will be content, didactic and technical aspects of teaching. Of course, I will also tell you about my experiences in the development of the MATLAB/LEGO MINDSTORMS Environmental Remote Sensing Lab, which we have just finished in a first version.
After I started using MATLAB in December 1992, I taught my first course on signal processing in 1994. The participants were a small group of postgraduate students and postdocs at the University of Kiel. At that time, we had no projectors so we were sitting around a computer and looked at a small display. It somehow worked, I can not really remember details anymore. I repeated the course several months later by invitation to the University of Bremen.
When I started teaching regular courses in data analysis at the University of Potsdam in 1996 I used a liquid crystal display on an overhead projector. This was a setup with very low luminous intensity, so we had to darken the room completely in order to see something. The students typed the MATLAB codes from the projector or used text files with the code I had provided. These were already early versions of the later recipes, thus the basis of the two books MRES and MDRES.
In these early years I used lots of other tools in addition to MATLAB. A little bit of FORTRAN77, but then specialized software tools such as ADE, a french software product freely available for download. I just searched the web for the software and indeed it still exists. The old multivariate analysis and graphical display software ADE-4 is still available but a newer version is now available as a package for R.
I used ADE to run multivariate statistical analyses, in addition to another software called ViSta by Forrest W. Young. In yes, also this software still exists and can be downloaded for free. I must admit that I did not try to download and install the software. Therefore I am not sure whether the versions provided on the webpage are compatible with computers running recent versions of macOS, Windows or Unix.
The last software I used was the Image software of the US National Institute of Health. Also this software for image processing and analysis still exists and can be downloaded for free. Again, I did not download and test the latest version of the software. Image analysis was not possible with MATLAB since the software was limited to two-dimensional arrays at that time.
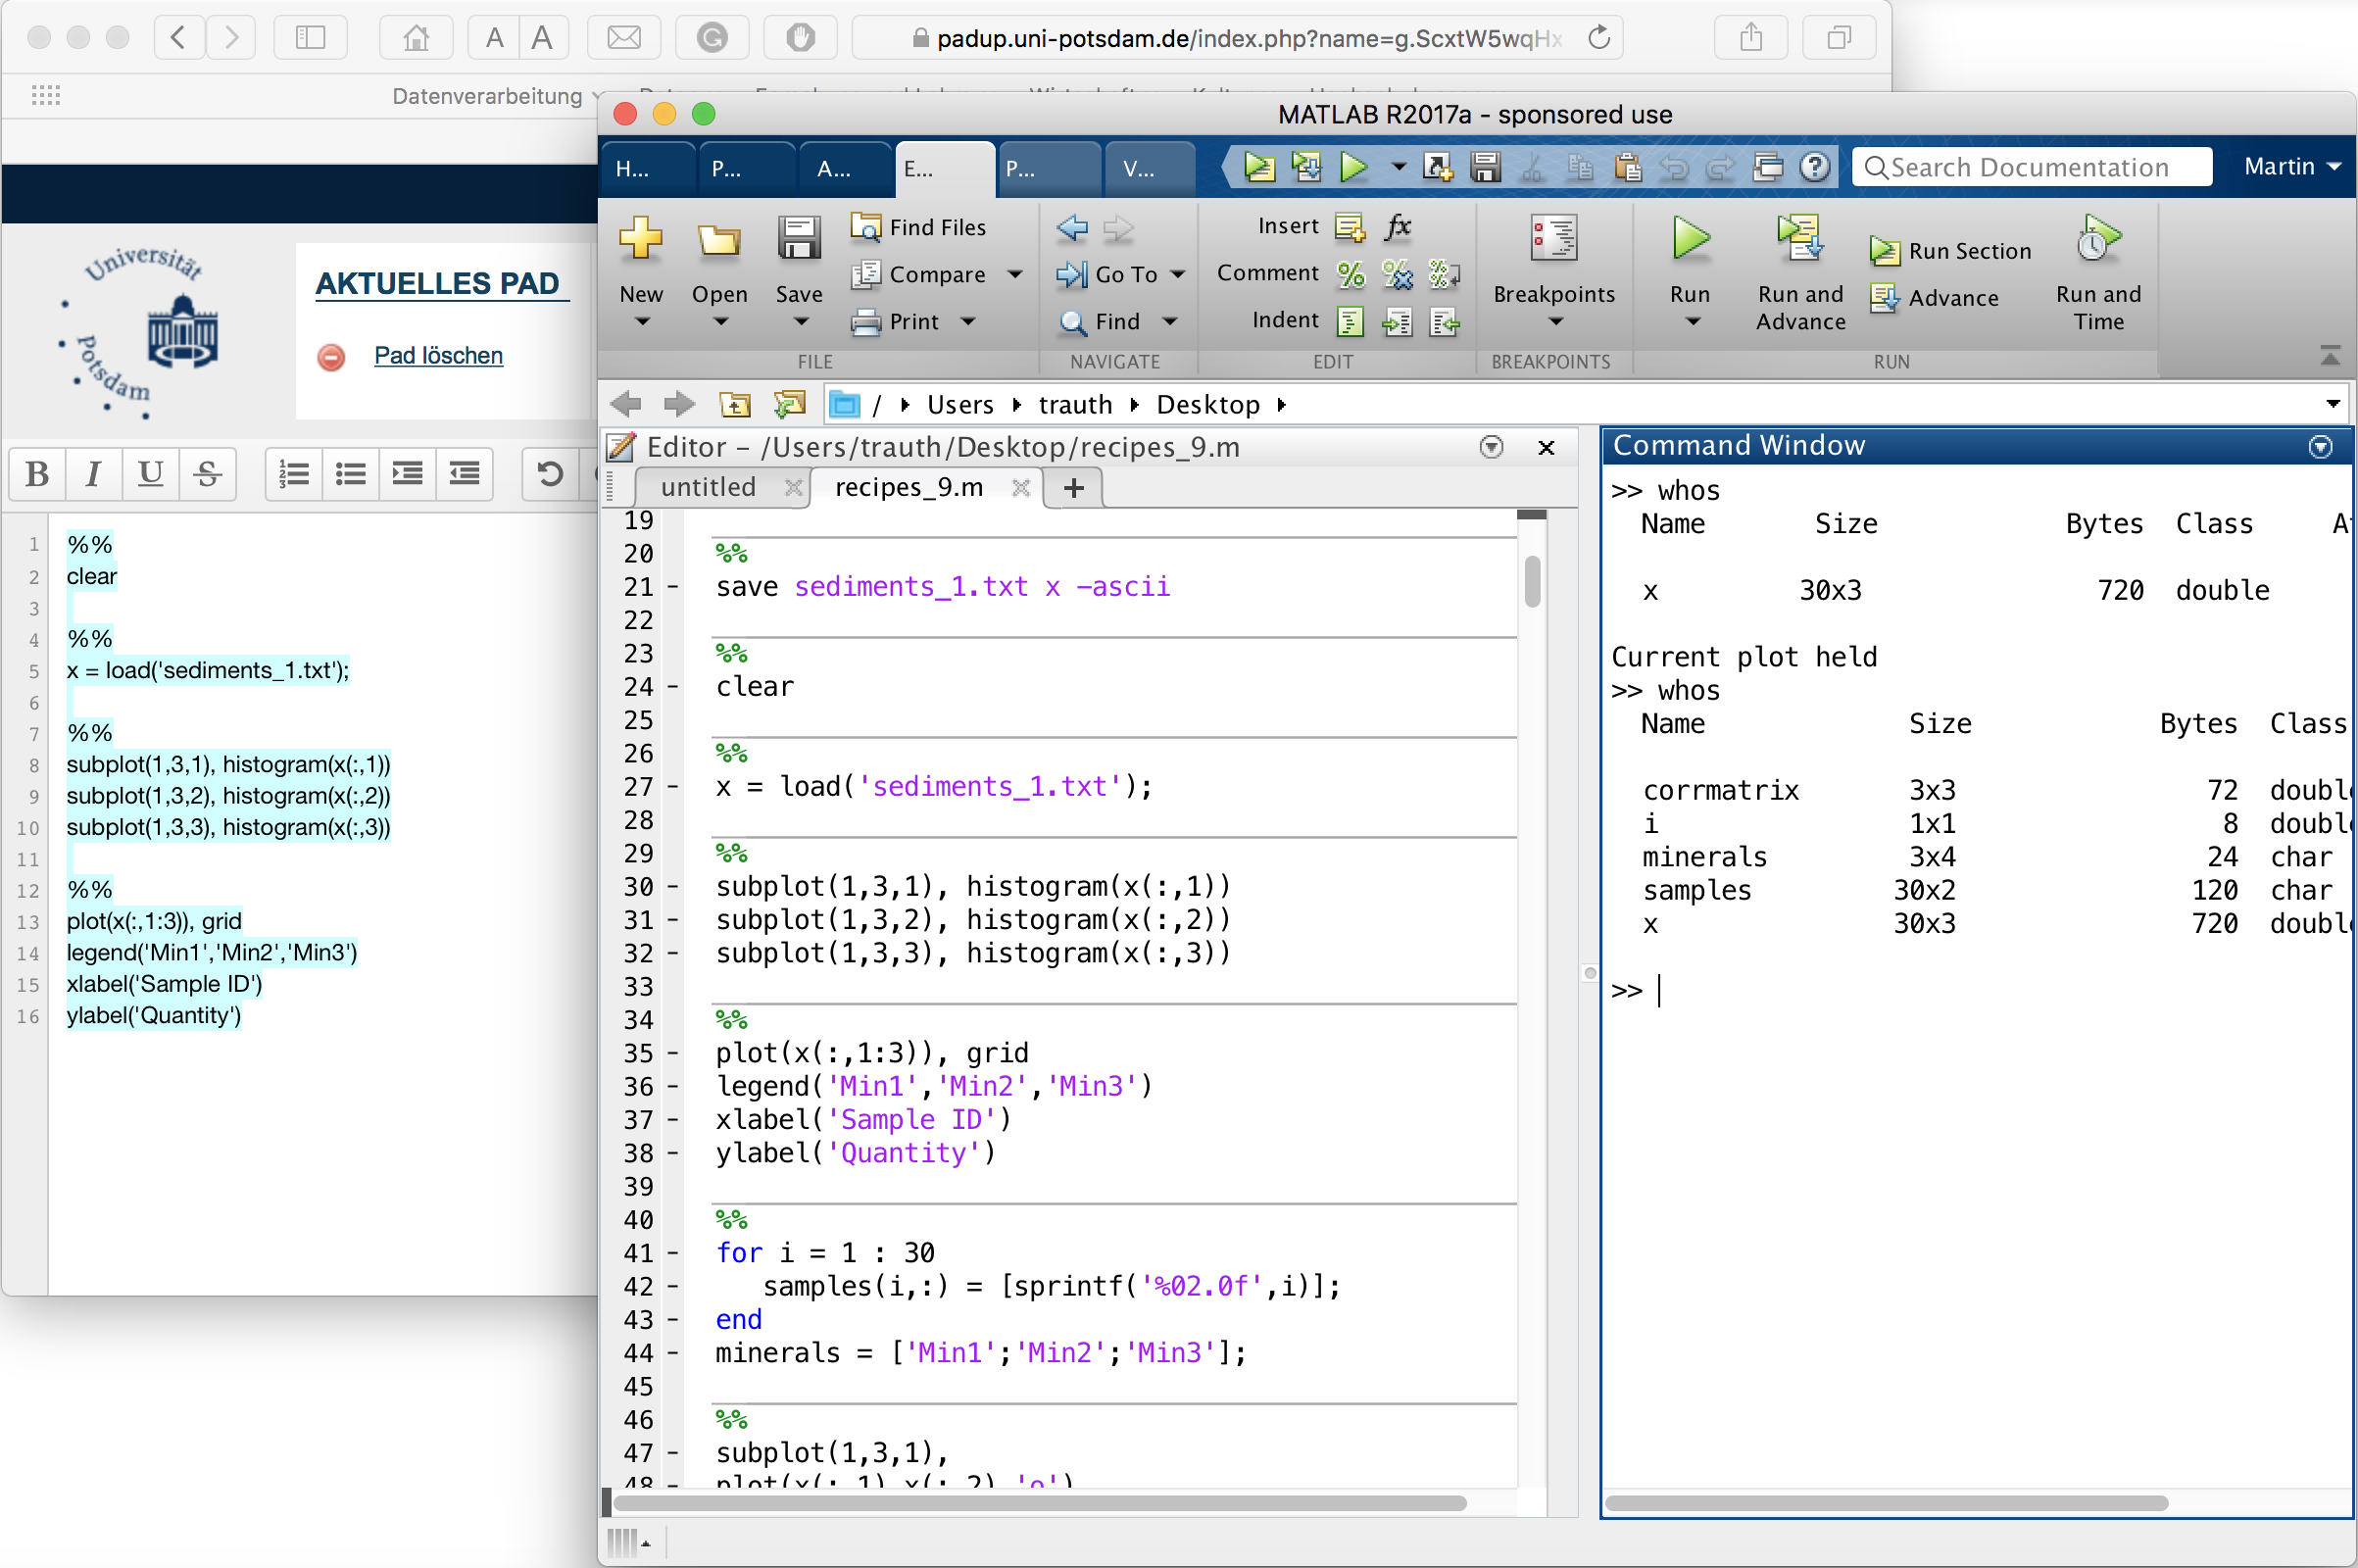
During the last 15 years, in particular since I teach the international courses either in Potsdam or elsewhere, I use MATLAB as the only tool. During the course no one has to type MATLAB code from the projector display since we are using Etherpad to copy/paste and edit code in real time. Etherpad is the most popular and free online text editor providing collaborative editing of code. I copy the code from MATLAB to the Etherpad and the participants, also logged on the same pad, copy the code from the Etherpad to MATLAB. Since everyone writes with different colors, participants can change the code and discuss the modifications.
Readers of the books, on the other hand, use the recipes, which can be downloaded free of charge at Springer Extras. Thus, no one really needs to type code from the book as I did 25 years ago when reading the book Numerical Recipes by by William H. Press, Saul A. Teukolsky, William T. Vetterling, Brian P. Flannery.