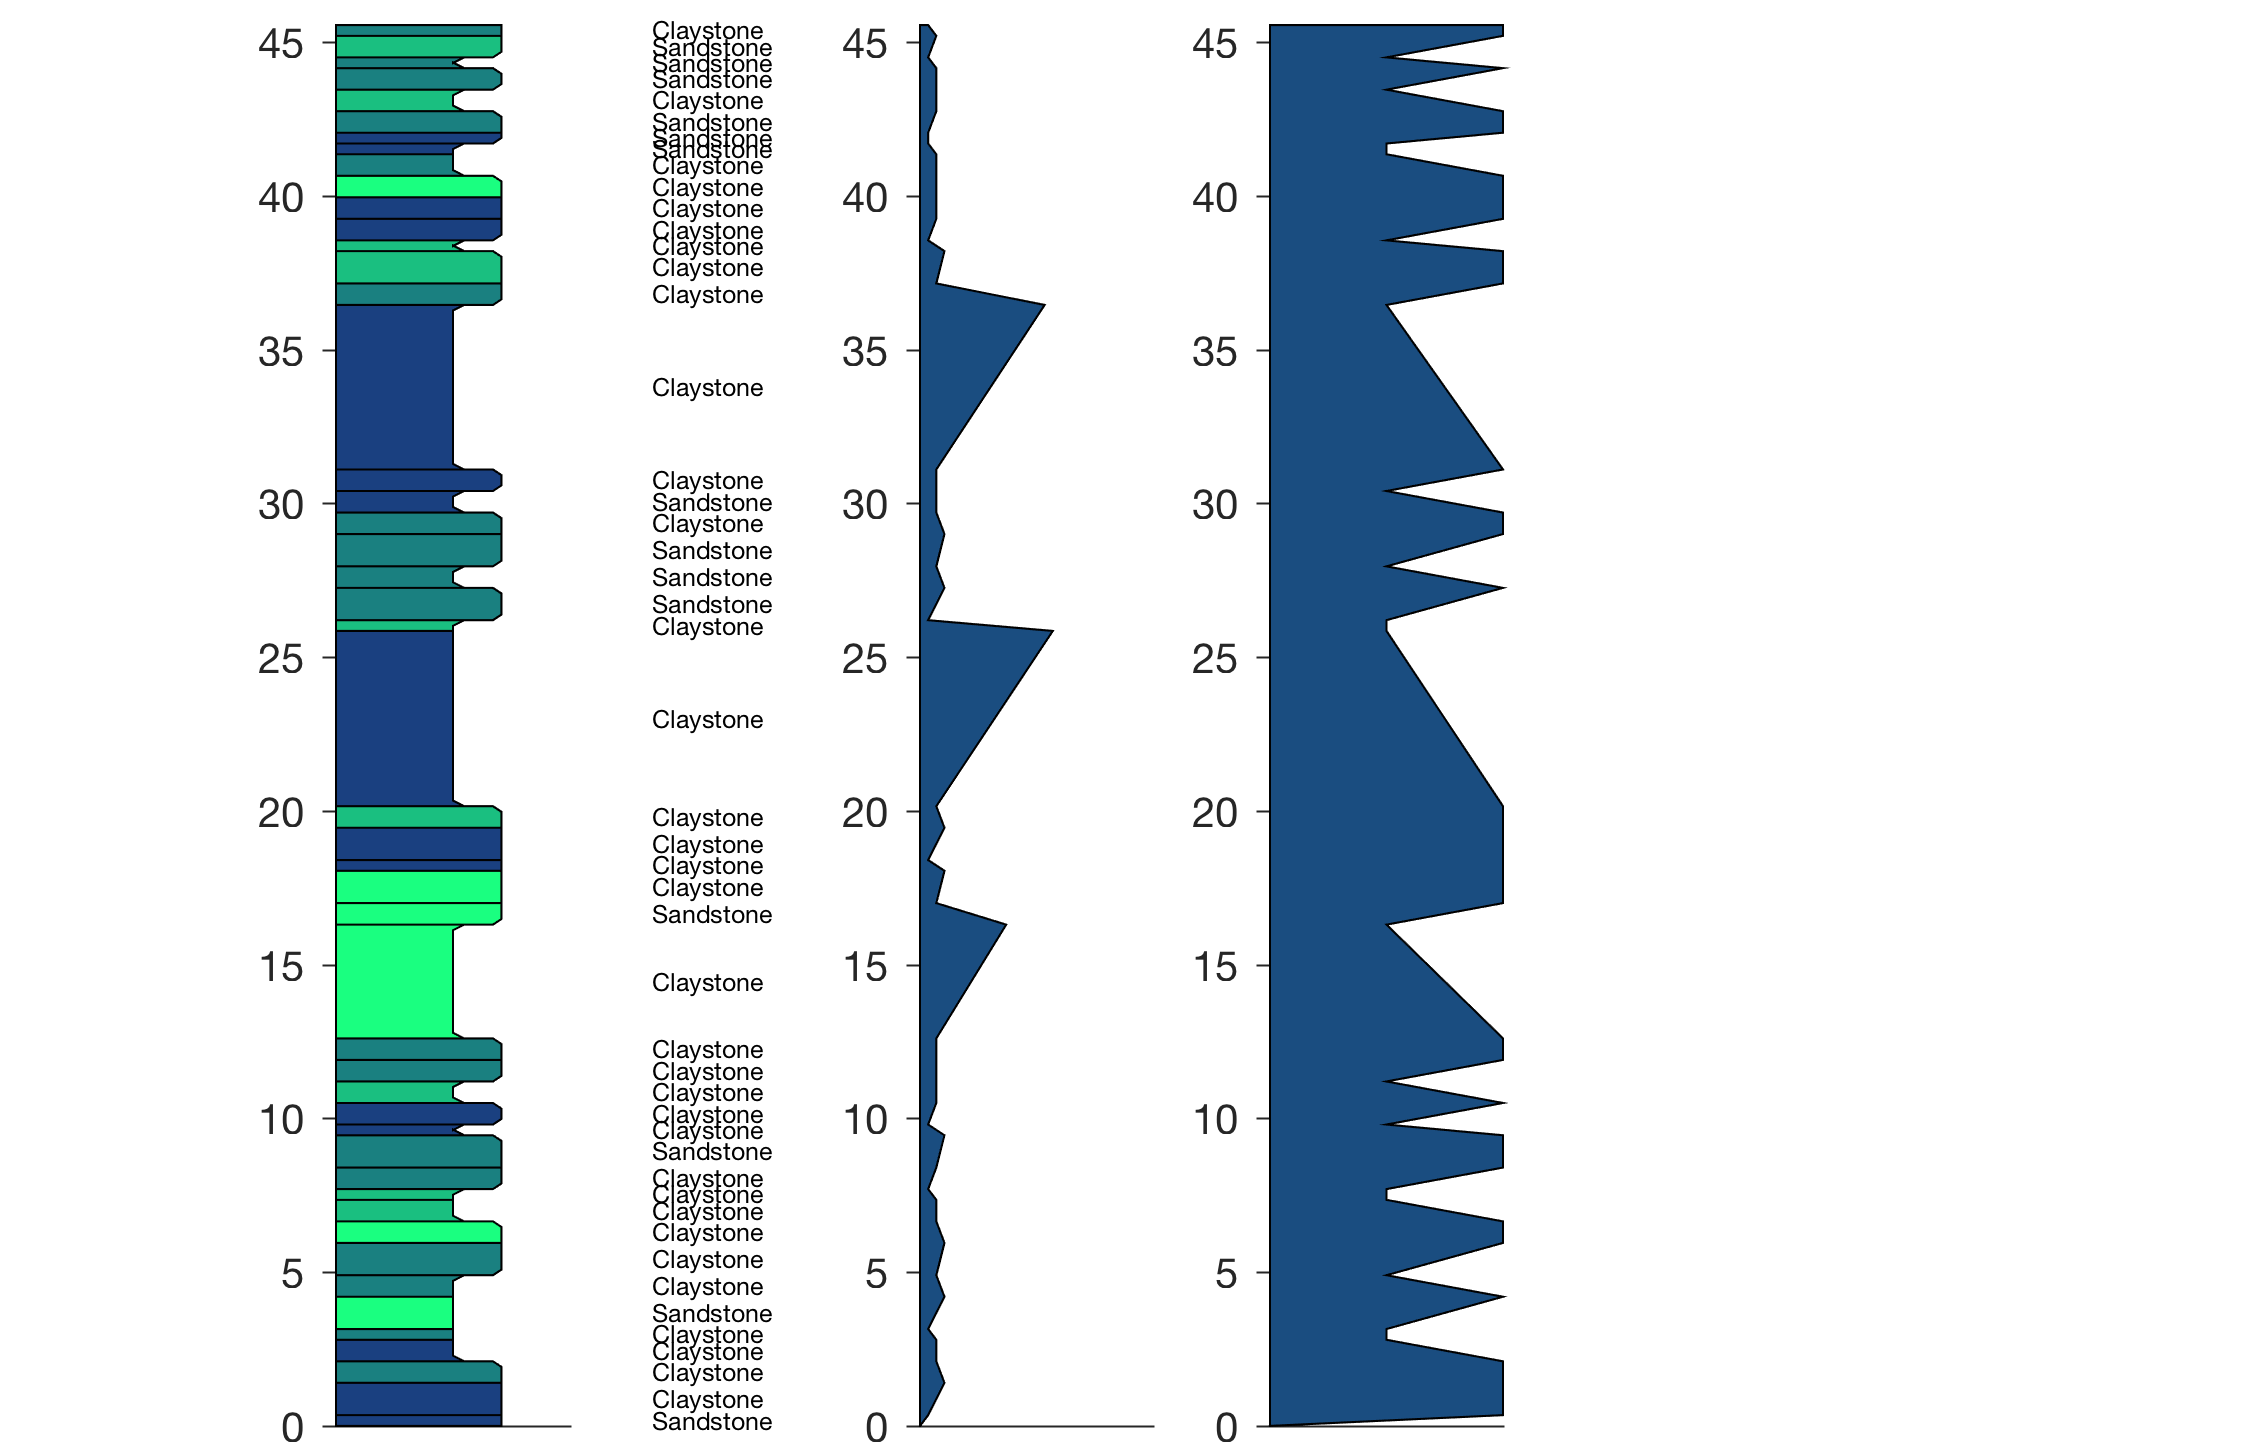
As a geoscientist using MATLAB, about a decade ago I sought a way to draw a stratigraphic column with rounded corners, labels, and a number of data curves. The result of a programming exercise during a rainy Sunday afternoon was the function stratplot, which was subsequently published in Chapter 5.7 of MDRES in the year 2012.
We first load the sediment data and labels from text files. The file sedimentdata.txt contains five columns: (1) layer thickness t, (2) degree of weathering w, (3) type of lithology l, and (4) and (5) two other parameters of the sediment d1 and d2.
clear, clc, close all
data = load('sedimentdata.txt');
fid = fopen('sedimentlabels.txt');
tlitho = textscan(fid,'%s');
fclose(fid);
litho = tlitho{1};
clear tlitho fid ans
We need to flip the data array data and the label array litho in an up/down direction if the first line in the data array represents the lowermost sediment layer, as this needs to be displayed at the bottom of the graph.
data = flipud(data);
litho = flipud(litho);
Next, we add a zero to either end in order to close the patches in the plot.
[n,m] = size(data);
datanew(1,:) = zeros(1,m);
for i = 1:n
    datanew(i+1,:) = data(i,:);
end
data = datanew;
data(n+2,:) = zeros(1,m);
We define specific variables, such as t for the layer thickness, w for the degree of weathering, l for the type of lithology, and ct for the cumulative thickness, to plot the data.
t = data(:,1);
w = data(:,2);
wc = data(:,2)./max(data(:,2));
l = data(:,3);
lc = data(:,3)./max(data(:,3));
ct = cumsum(t);
Finally, we display the stratigraphic column as a sequence of rectangular colored layers in which the color represents the sediment type. The script first creates a white figure window, then creates a stratigraphic column with angular corners using fill, labels the layers, and creates two curves using the function patch.
figure1 = figure('Color',[1 1 1]);

% PART 1 Stratigraphic column
axes1 = axes('position',[0.15 0.1 0.1 0.8],...
    'YLim',[0 max(ct)],...
    'Color','None',...
    'TickDir','out',...
    'XTickLabel',[],...
    'XTick',[]);
hold on
for i=2:length(ct)-1
layercolor = [0.1 lc(i) 0.5];
if w(i)==2&w(i-1)==1&w(i+1)==1
    X=[0 0 w(i)-0.2 w(i) w(i) w(i)-0.2];
    Y=[ct(i-1) ct(i) ct(i) ct(i)-0.2*mean(t) ...
    ct(i-1)+0.2*mean(t) ct(i-1)];
    fill1 = fill((X).^.5,Y,layercolor);
    elseif w(i)==1 & w(i-1)==2 & w(i+1)==2
    X=[0 0 w(i)+0.2 w(i) w(i) w(i)+0.2];
    Y=[ct(i-1) ct(i) ct(i) ct(i)-0.2*mean(t) ...
    ct(i-1)+0.2*mean(t) ct(i-1)];
    fill1 = fill((X).^.5,Y,layercolor);
elseif w(i)==1&(w(i-1)==1&w(i+1)==1)| ...
    (w(i-1)==0&w(i+1)==1)
    X=[0 0 w(i) w(i)];
    Y=[ct(i-1) ct(i) ct(i) ct(i-1)];
    fill1 = fill((X).^.5,Y,layercolor);
elseif w(i)==1&w(i-1)==1&w(i+1)==0
    X=[0 0 w(i) w(i)];
    Y=[ct(i-1) ct(i) ct(i) ct(i-1)];
    fill1 = fill((X).^.5,Y,layercolor);
elseif w(i)==2&(w(i-1)==2&w(i+1)==2)|...
    (w(i-1)==0&w(i+1)==2)
    X=[0 0 w(i) w(i)];
    Y=[ct(i-1) ct(i) ct(i) ct(i-1)];
    fill1 = fill((X).^.5,Y,layercolor);
elseif w(i)==2&w(i-1)==2&w(i+1)==0
    X=[0 0 w(i) w(i)];
    Y=[ct(i-1) ct(i) ct(i) ct(i-1)];
    fill1 = fill((X).^.5,Y,layercolor);
elseif w(i)==2&(w(i-1)==2&w(i+1)==1)|...
    (w(i-1)==0&w(i+1)==1)
    X=[0 0 w(i)-0.2 w(i) w(i)];
    Y=[ct(i-1) ct(i) ct(i) ...
    ct(i)-0.2*mean(t) ct(i-1)];
    fill1 = fill((X).^.5,Y,layercolor);
elseif w(i)==2&(w(i-1)==1&w(i+1)==2)|...
    (w(i-1)==1&w(i+1)==0)
    X=[0 0 w(i) w(i) w(i)-0.2];
    Y=[ct(i-1) ct(i) ct(i) ...
    ct(i-1)+0.2*mean(t) ct(i-1)];
    fill1 = fill((X).^.5,Y,layercolor);
elseif w(i)==1&w(i-1)==1&w(i+1)==2
    X=[0 0 w(i)+0.2 w(i) w(i)];
    Y=[ct(i-1) ct(i) ct(i) ...
    ct(i)-0.2*mean(t) ct(i-1)];
    fill1 = fill((X).^.5,Y,layercolor);
    elseif w(i)==1&w(i-1)==2&w(i+1)==1
    X=[0 0 w(i) w(i) w(i)+0.2];
    Y=[ct(i-1) ct(i) ct(i) ...
    ct(i-1)+0.2*mean(t) ct(i-1)];
    fill1 = fill((X).^.5,Y,layercolor);
end
end

% PART 2: Labels
axes1 = axes('position',[0.25 0.1 0.1 0.8],...
    'YLim',[0 max(ct)],...
    'Color','None',...
    'Visible','off');
for i=1:length(ct)-2
    text1 = text(0.35,ct(i+1)-t(i+1)./2,...
    litho(i,:),'Fontsize',6);
end

% PART 3: Patch 1
axes1 = axes('position',[0.4 0.1 0.1 0.8],...
    'YLim',[0 max(ct)],...
    'Color','None',...
    'TickDir','out',...
    'XTickLabel',[],...
    'XTick',[]);
patch1 = patch(data(:,4),ct,[0.1 0.3 0.5]);

% PART 4: Patch 2
axes1 = axes('position',[0.55 0.1 0.1 0.8],...
    'YLim',[0 max(ct)],...
    'Color','None',...
    'TickDir','out',...
    'XTickLabel',[],'XTick',[]);
patch1 = patch(data(:,5),ct,[0.1 0.3 0.5]);

