
The MATLAB function axes creates a Cartesian axes in the current figure. Many MATLAB users do not use the figure and axes functions because all graphics functions generate a figure window and an axis system. However, the two functions together offer many possibilities to arrange FigureWindows on the display or to place one or more axes on this FigureWindows. Here are some examples that do not even come close to what these functions offer.
Having created a Figure Window with figure the function axes creates the axes system. We use a single property, ‘Position’, to define the size and location of the axes in the Figure Window, specified as a four-element array of the form [left bottom width height]. As an example, using [0 0 1 1] we create an axes completely filling the figure window because the first two values, both zeros, define the lower left corner of the figure window as the origin of the axes. The last two values, both ones, define the width and the height to be 100% of the width and the height of the Figure Window, with no place for axes labels.
clc, close all
figure('Position',[50 850 600 400])
axes('Position',[0 0 1 1])
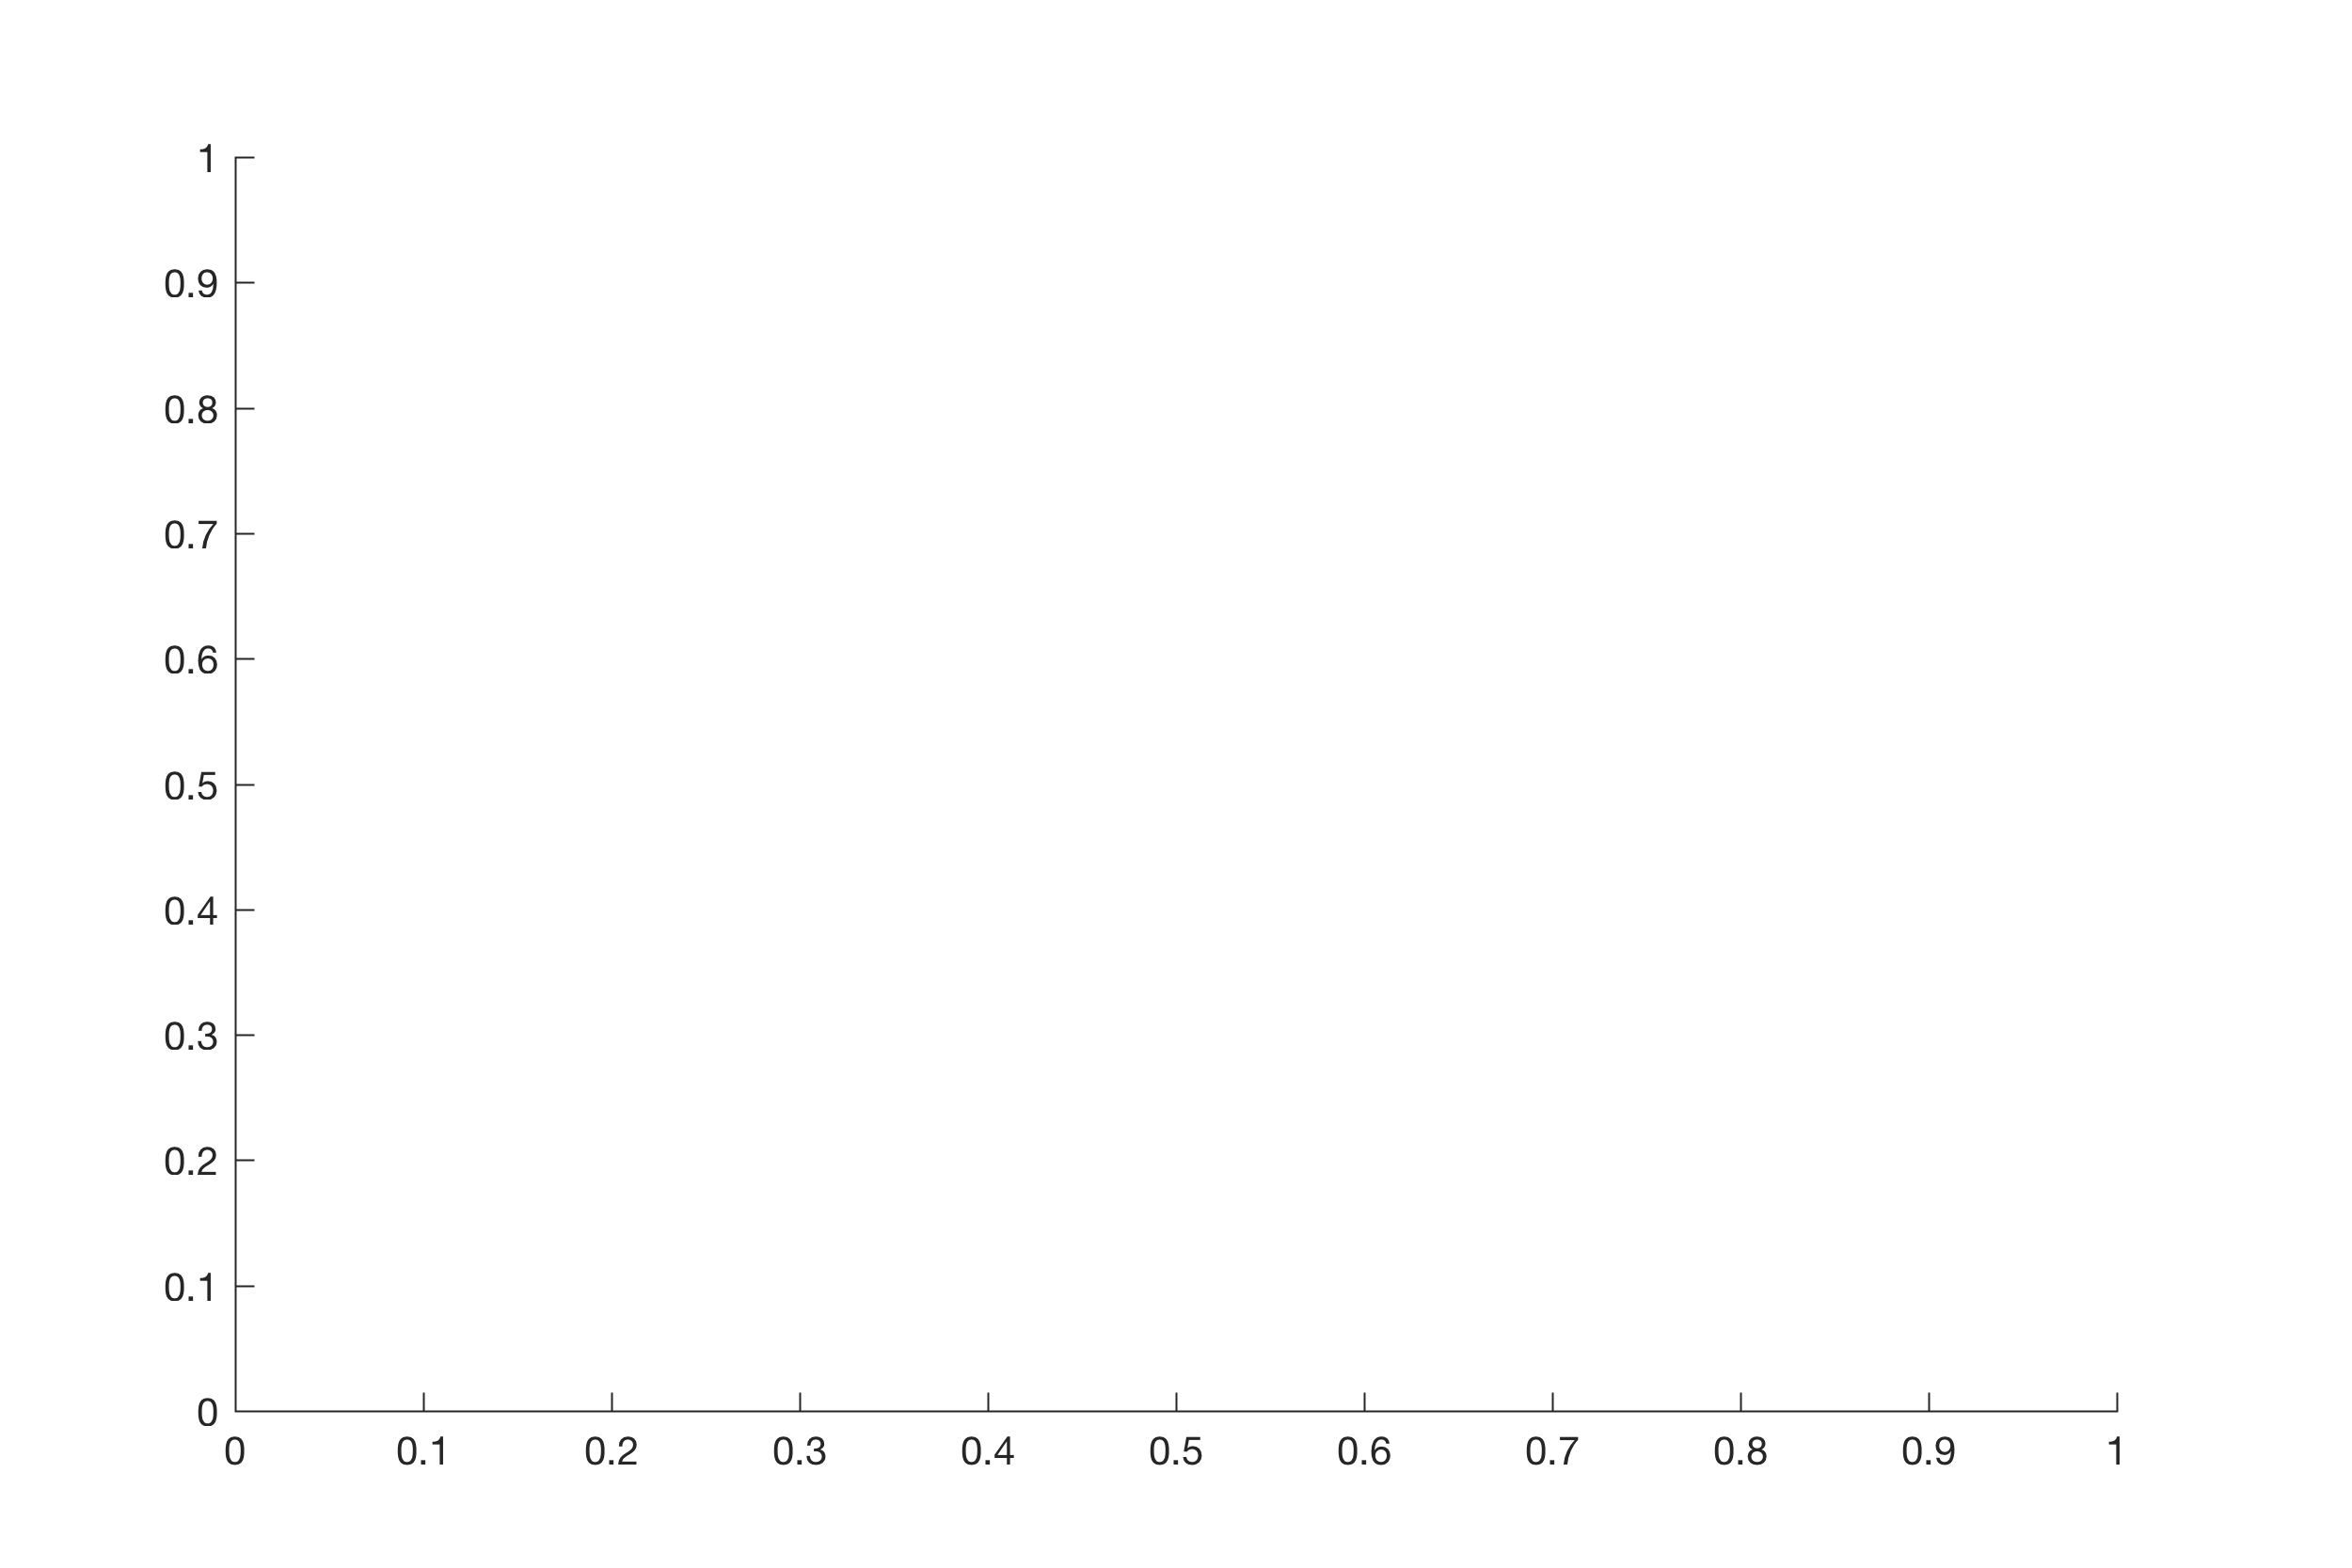
Using [0.1 0.1 0.8 0.8] uses [0.1 0.1] as the origin and [0.8 0.8] as the width and height of the axes.
figure('Position',[50 850 600 400])
axes('Position',[0.1 0.1 0.8 0.8])
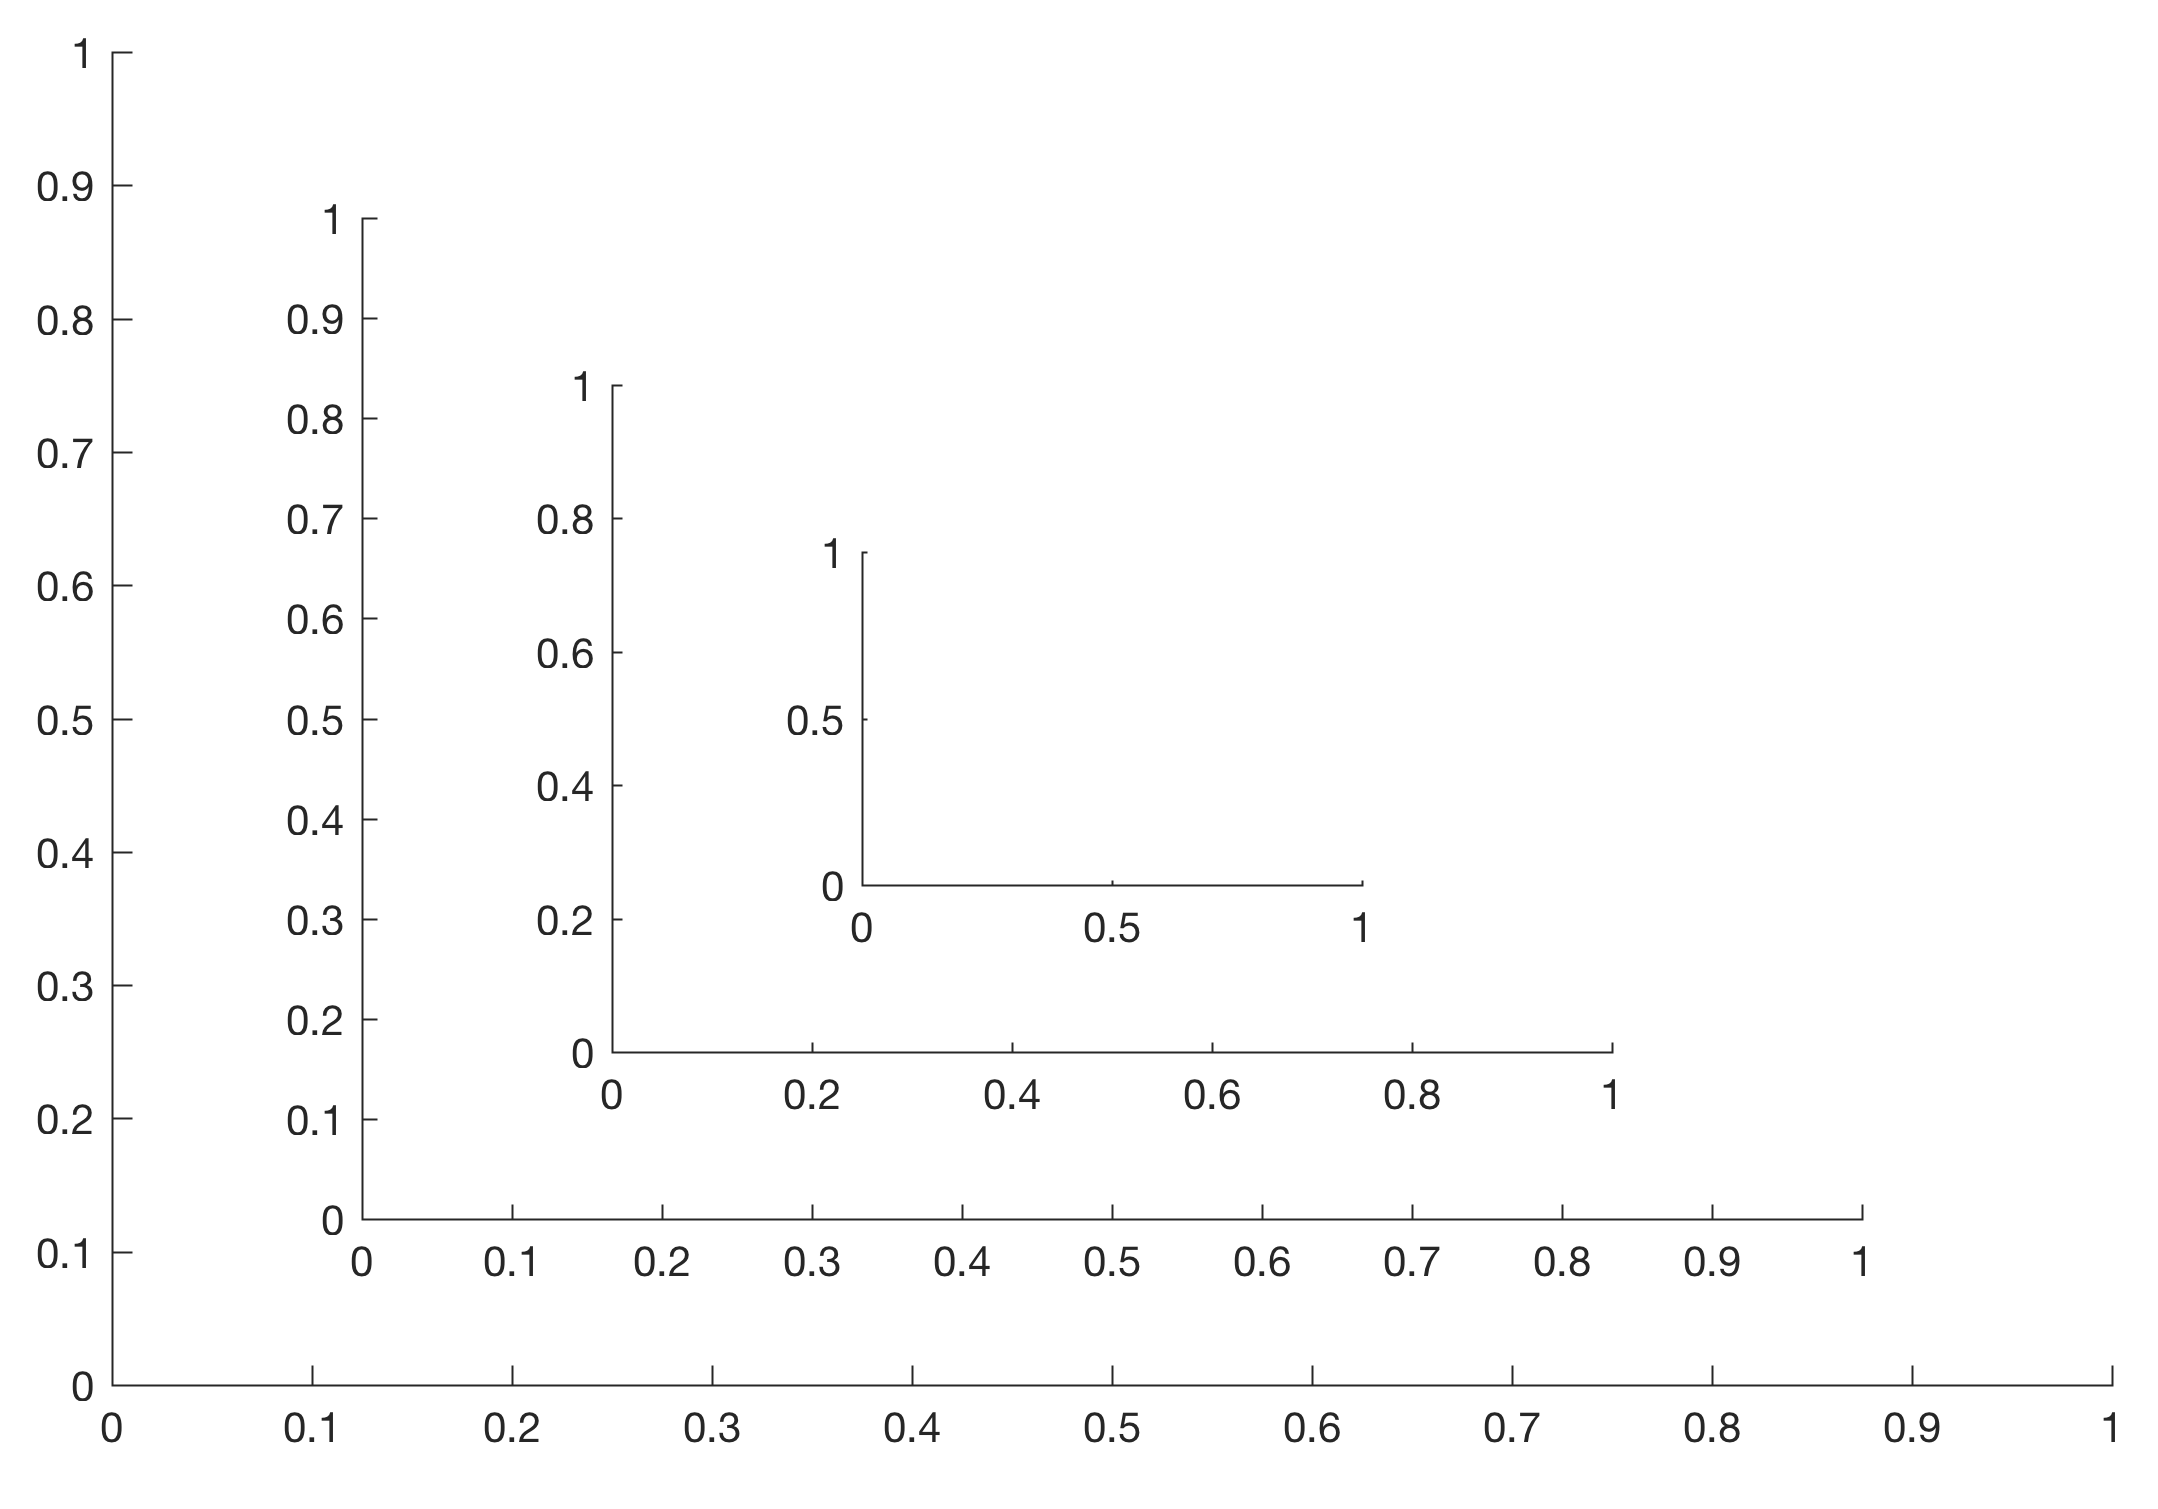
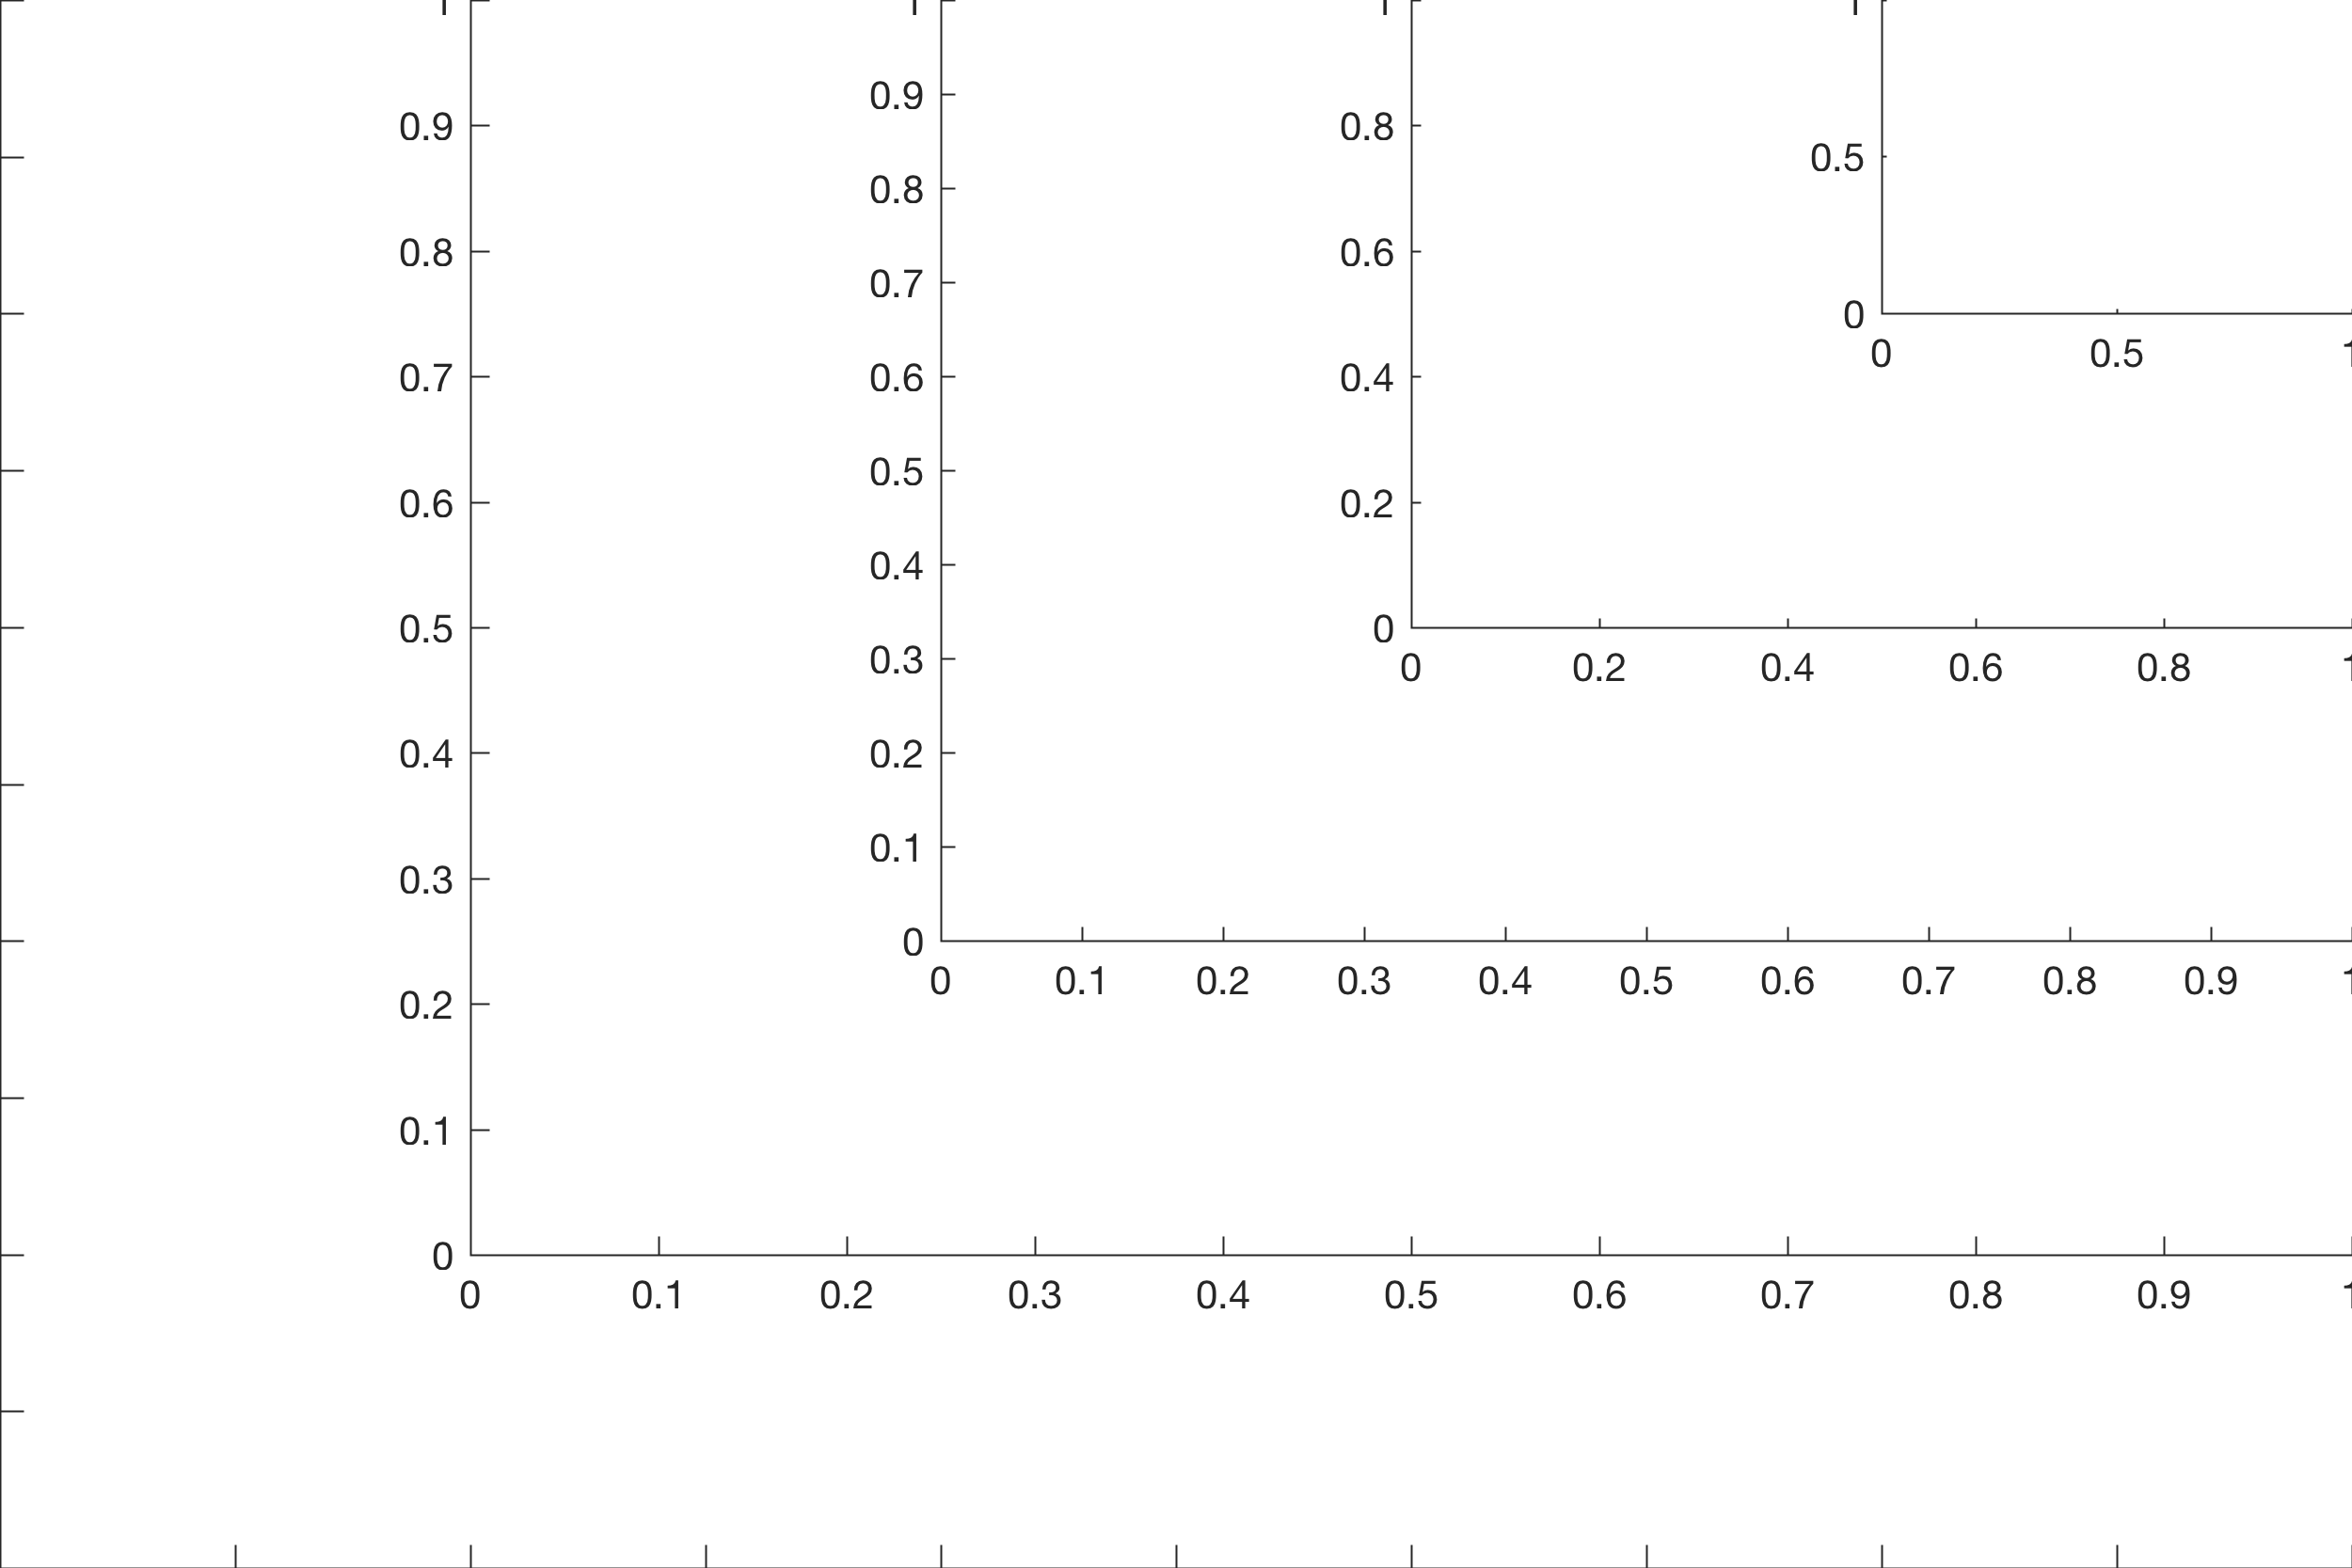
Now we can play around with this concept to create multiple axes in the Figure window.
figure('Position',[50 850 600 400])
axes('Position',[0 0 1 1])
axes('Position',[0.1 0.1 0.8 0.8])
axes('Position',[0.2 0.2 0.6 0.6])
axes('Position',[0.3 0.3 0.4 0.4])
axes('Position',[0.4 0.4 0.2 0.2])
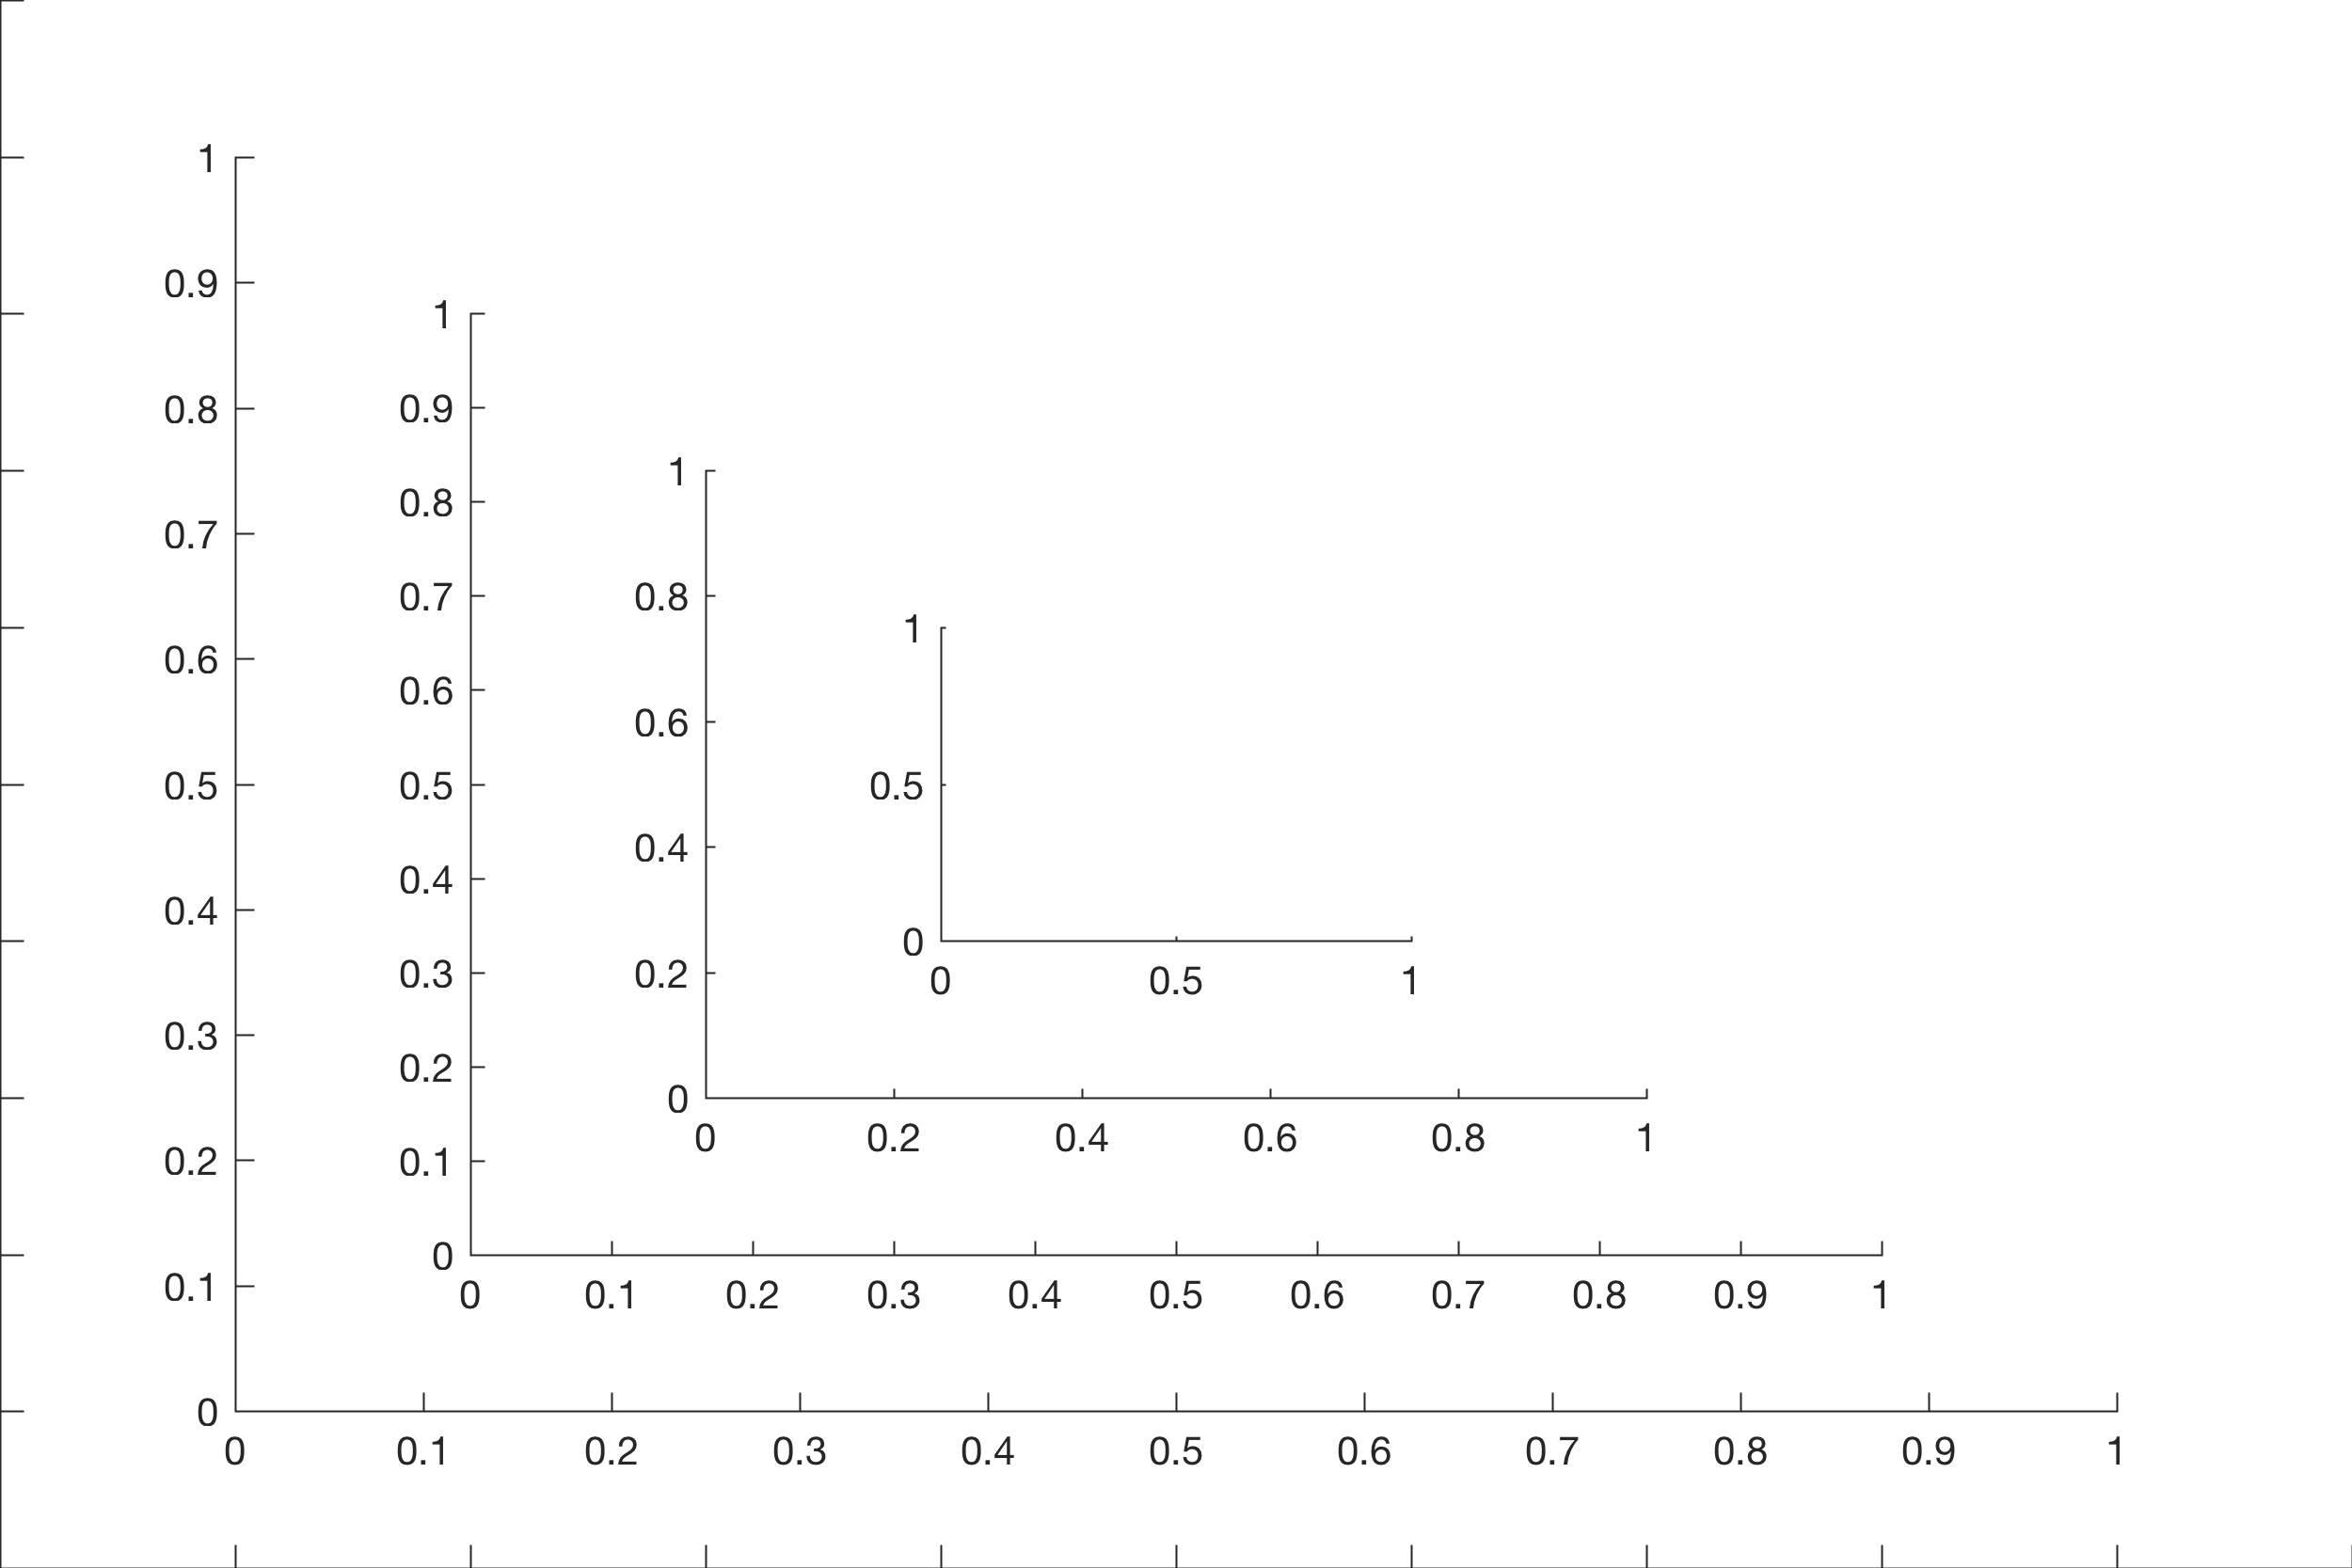
figure('Position',[50 50 600 400])
axes('Position',[0 0 1 1])
axes('Position',[0.2 0.2 0.8 0.8])
axes('Position',[0.4 0.4 0.6 0.6])
axes('Position',[0.6 0.6 0.4 0.4])
axes('Position',[0.8 0.8 0.2 0.2])
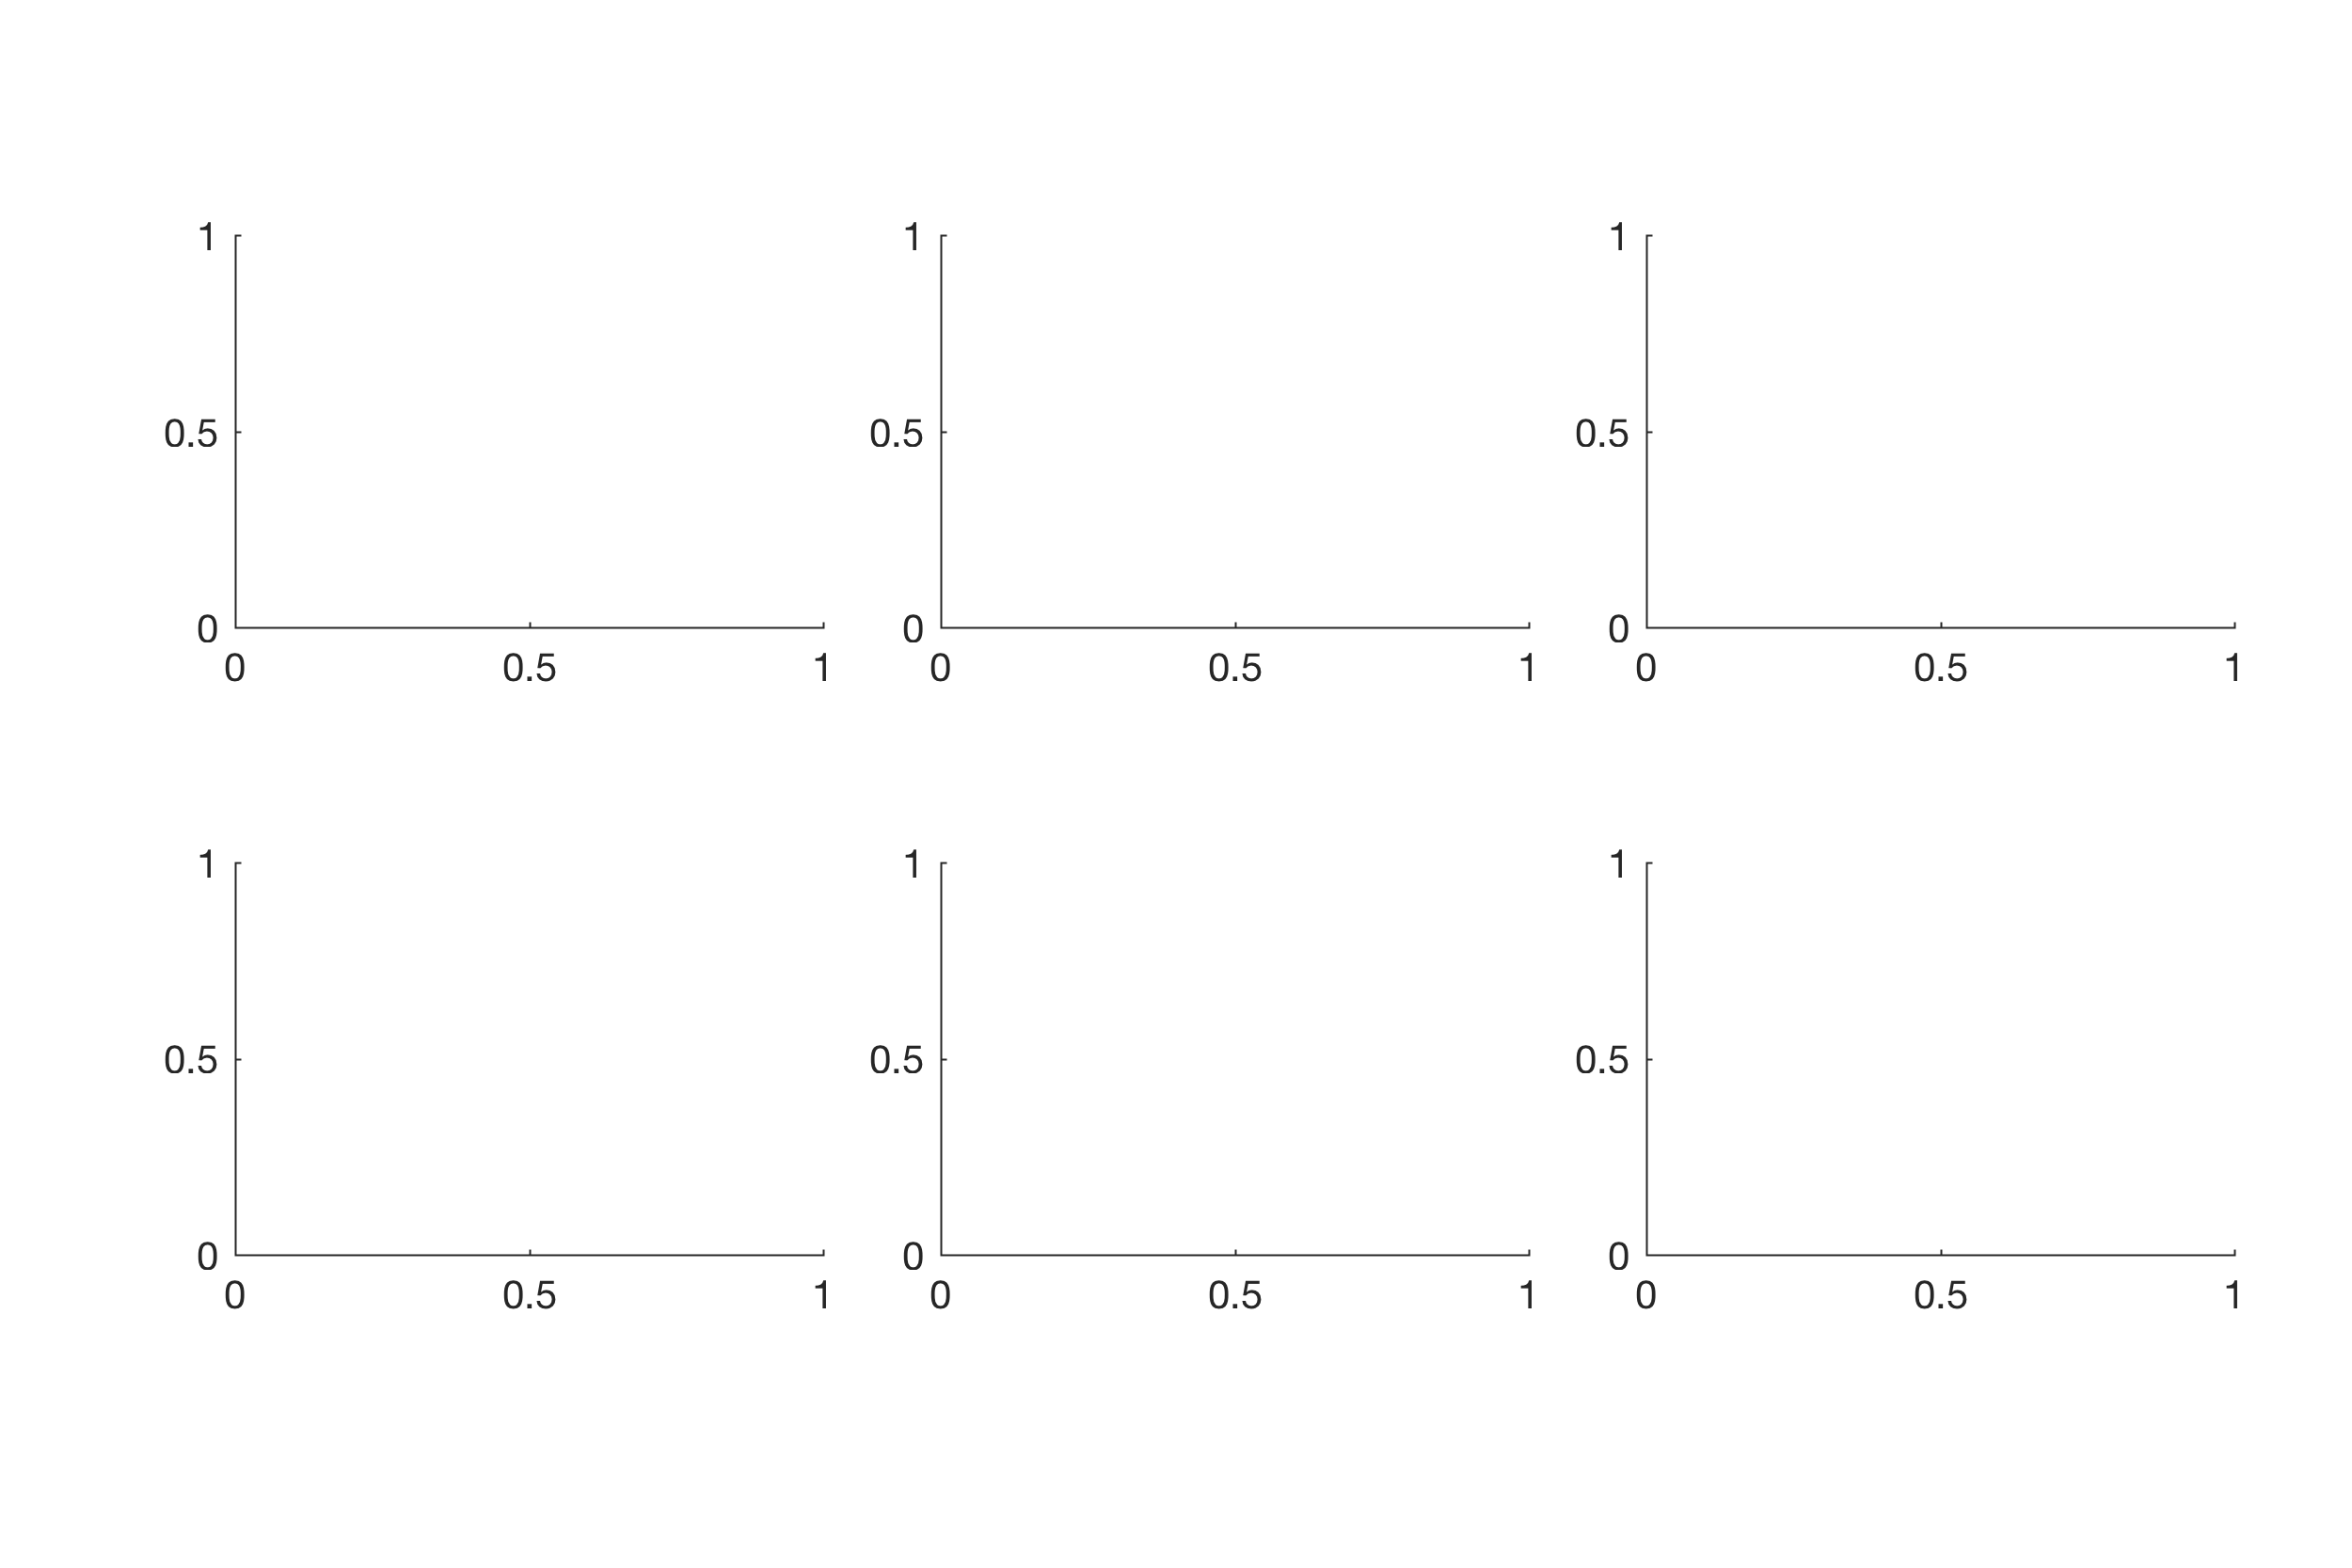
This is an example creating multiple axes in an grid-type arrangement similar to the subplot function.
figure('Position',[50 50 600 400])
axes('Position',[0.1 0.2 0.25 0.25])
axes('Position',[0.4 0.2 0.25 0.25])
axes('Position',[0.7 0.2 0.25 0.25])
axes('Position',[0.1 0.6 0.25 0.25])
axes('Position',[0.4 0.6 0.25 0.25])
axes('Position',[0.7 0.6 0.25 0.25])
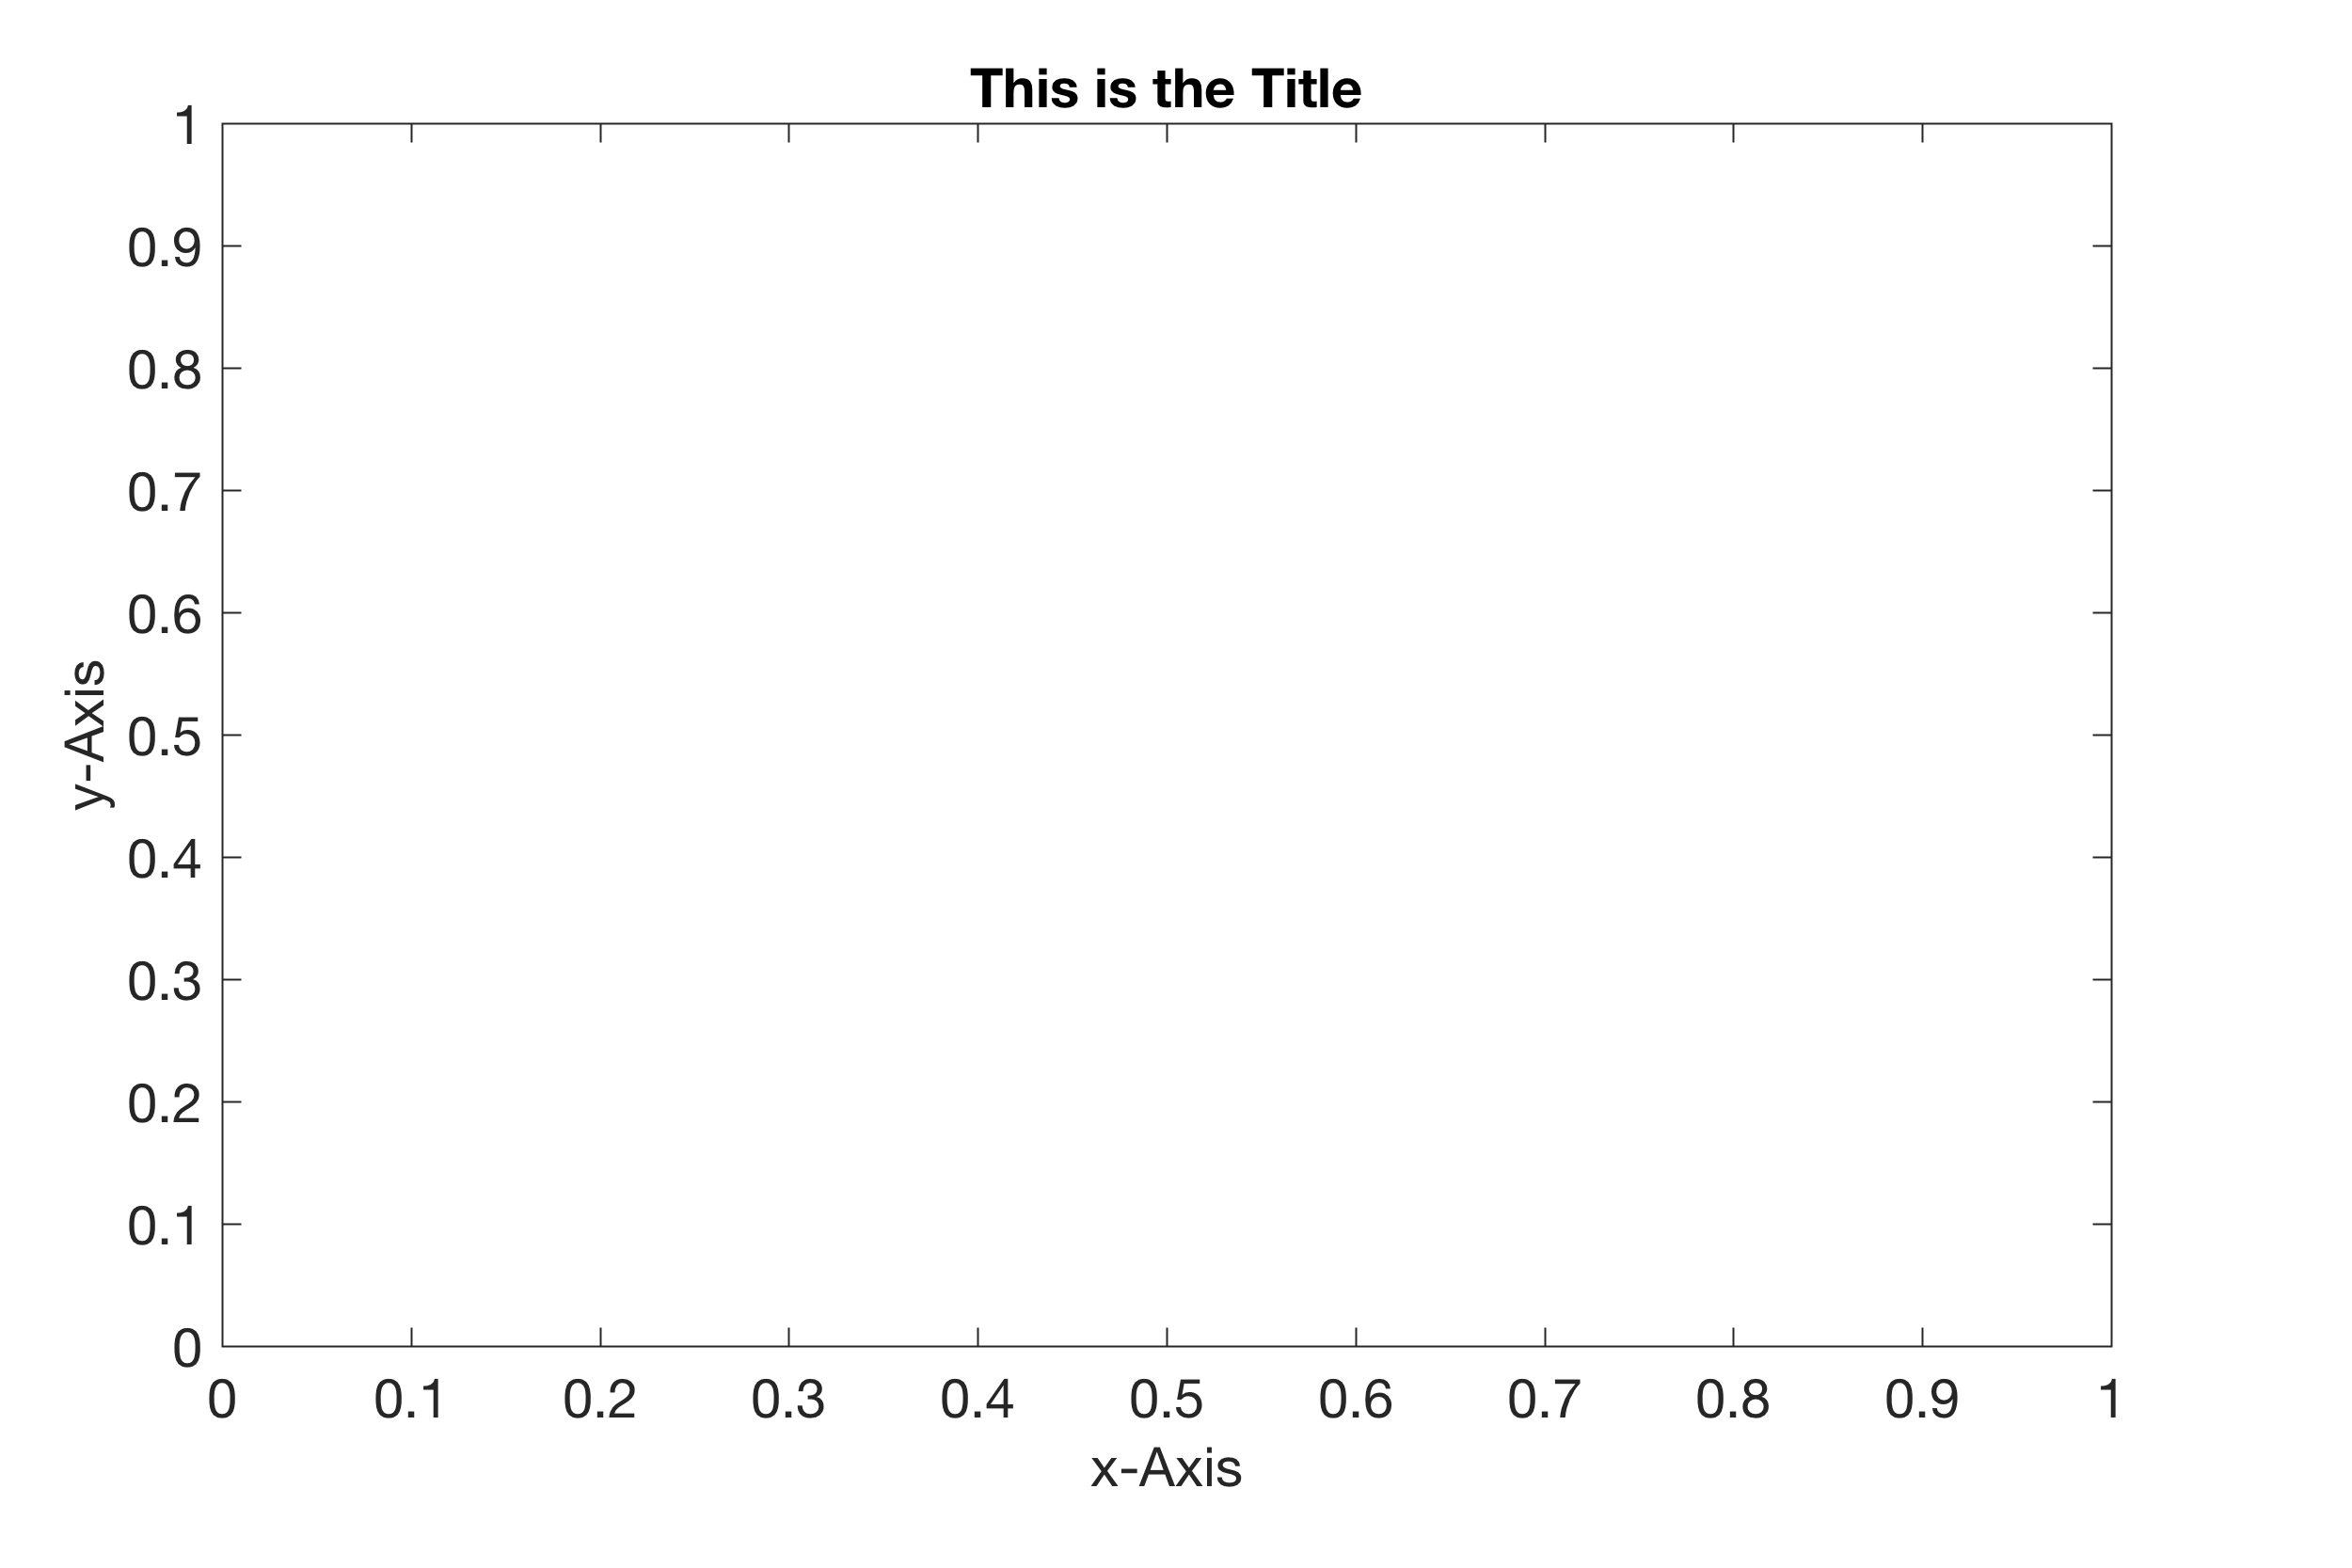
As demonstrated in an earlier post we can use other properties of axes to modify its design, in addition to adding axis labels and a title.
figure('Position',[50 850 600 400])
axes('Position',[0.2 0.15 0.7 0.7],...
     'Box','On',...
     'FontSize',14)
xlabel('x-Axis',...
     'FontSize',14)
ylabel('y-Axis',...
     'FontSize',14)
title('This is the Title',...
     'FontSize',14)
Switching from the default normalized position units to centimeters we can create publishable figures of a specific width and height in centimeters.
figure('Position',[50 850 600 400])
axes('Units','Centimeters',...
    'Position',[2 2 17 11],...
    'Box','On',...
    'FontSize',14)
xlabel('x-Axis',...
    'FontSize',14)
ylabel('y-Axis',...
    'FontSize',14)
title('This is the Title',...
    'FontSize',14)
