
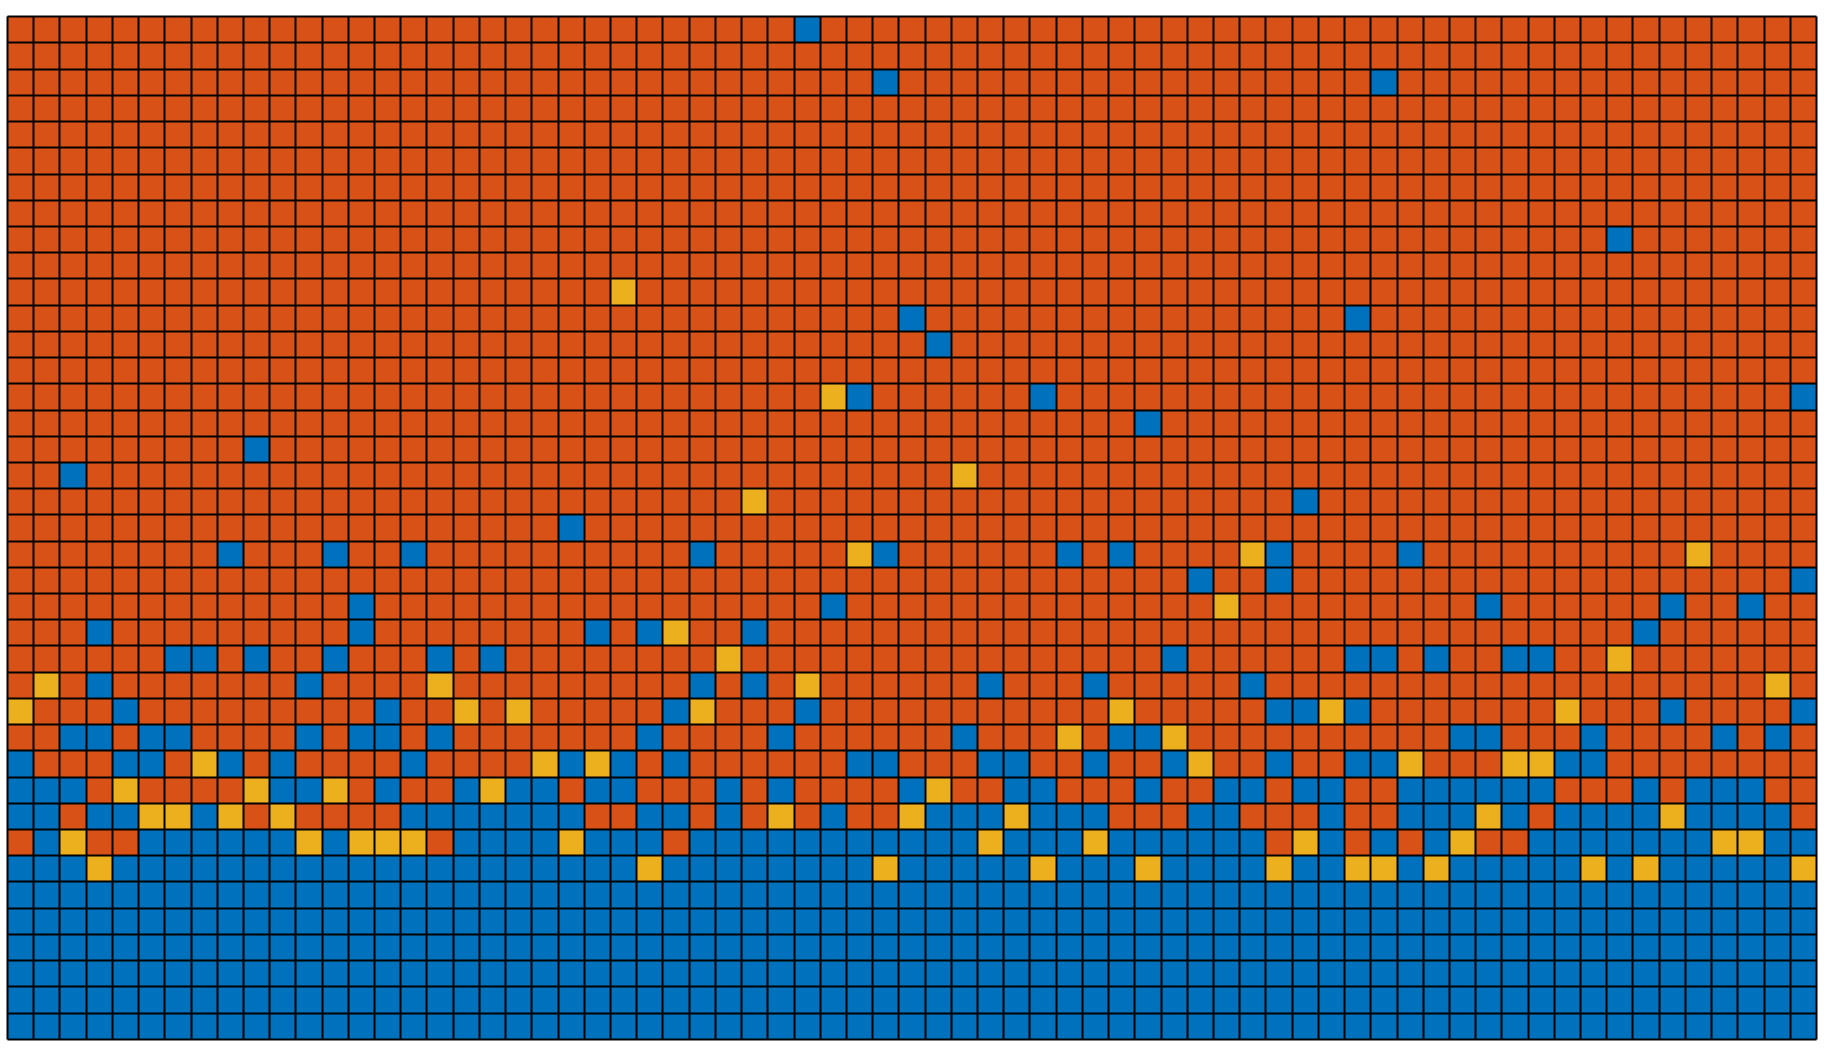
Here is the second of several animated models of bioturbation. It simulates the effect of mixing of a 5 cm thick layer by benthic organisms on a single 1 cm thick layer of yellow particles, followed by layers with 100% red particles.
The function [S,ABU] = BIOTURBATION_2(L,C,M) is a model for benthic mixing, where L is the number of sediment layers added to an initial pile of 10 layers, C is the number of particles per layer and M is the depth of homogeneous mixing. The function displays the mixed sediment column as yellow, red and blue pixels. It also returns the mixed sediment column as matrix and a vector containing the number of particles per layer after mixing.
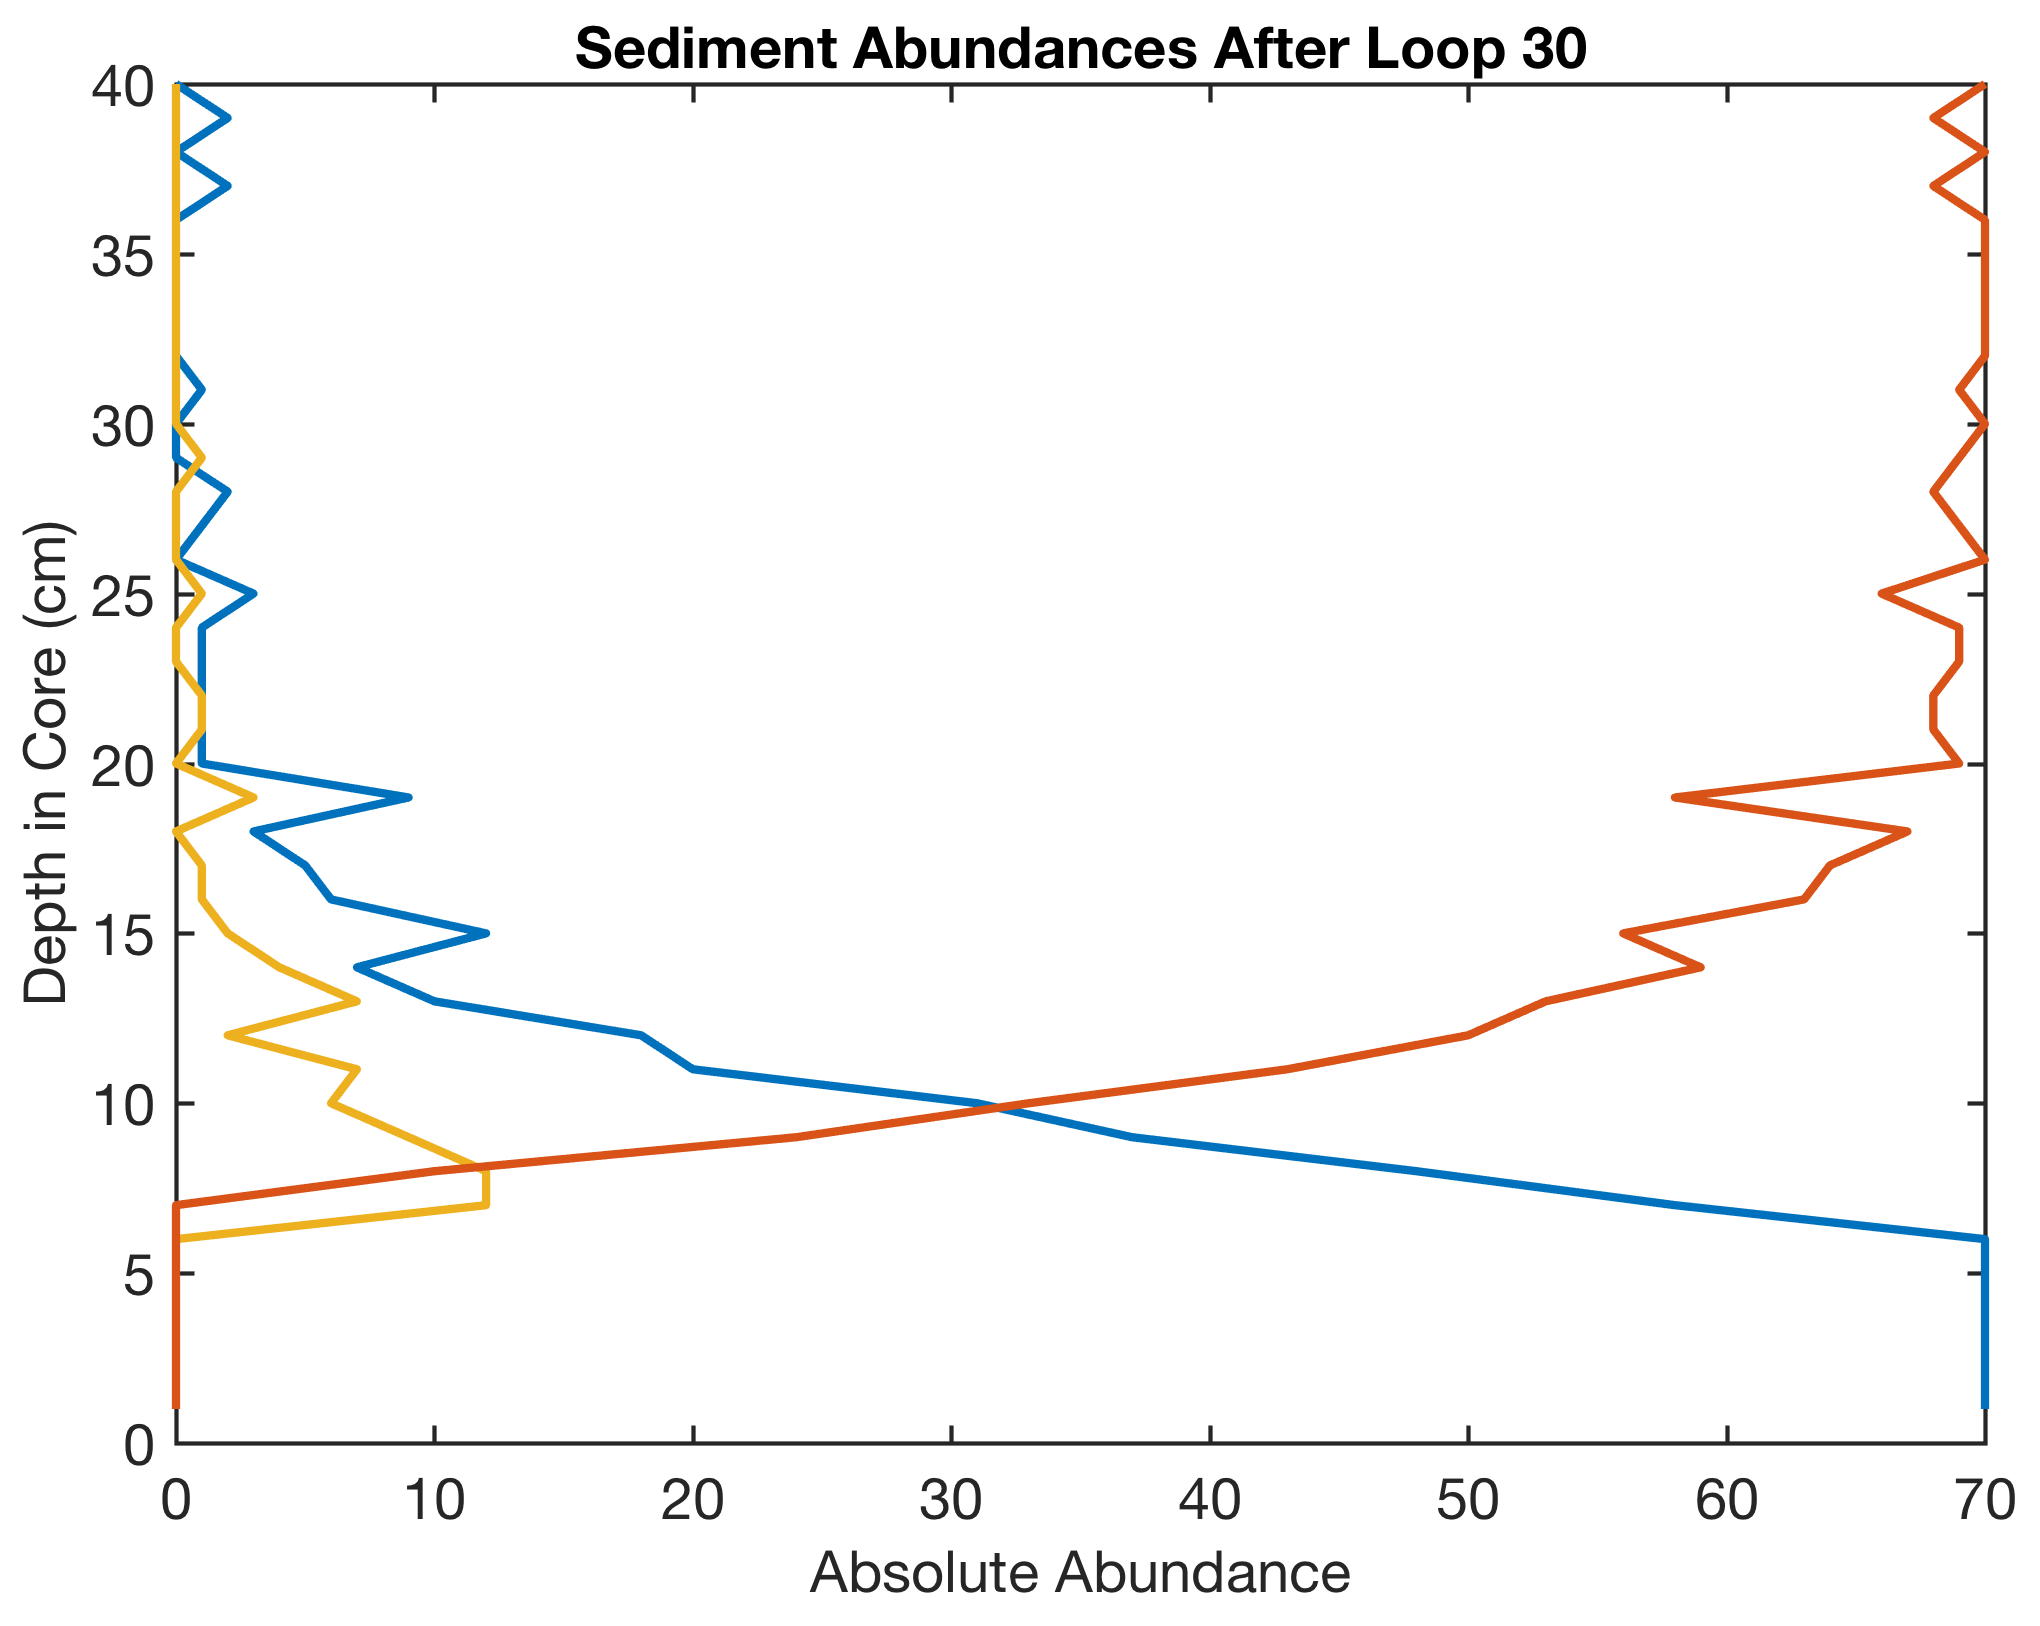
Here is a plot of the sediment abundance after benthic mixing:
References
Berger, W.H., Heath, R.G. (1968) Vertical mixing in pelagic sediments. Journal of Marine Research 26, 134–143.
Trauth, M.H., Sarnthein, M., Arnold, M. (1997) Bioturbational mixing depth and carbon flux at the seafloor. Paleoceanography, 12, 517-526.
Trauth, M.H. (1998) TURBO: a dynamic-probabilistic simulation to study the effects of bioturbation on paleoceanographic time series. Computers and Geosciences, 24(5), 433-441.
Trauth, M.H. (2013) TURBO2: A MATLAB simulation to study the effects of bioturbation on paleoceanographic time series. Computers and Geosciences, 61, 1-10.